
Figure 6.
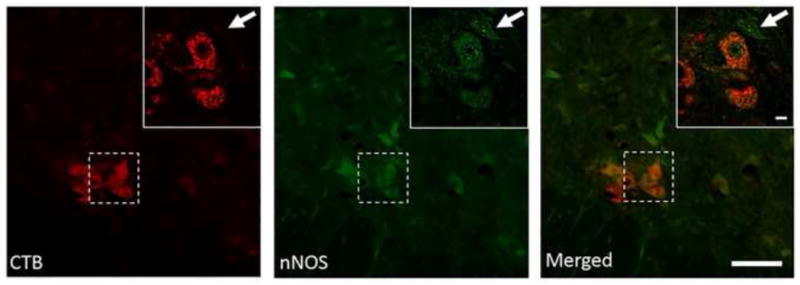
Immunohistochemical analysis of nNOS expression (green) in cholera toxin-B (CTB) labeled phrenic motor neurons (red) in the ~C4 spinal cord. Note the expression nNOS within CTB-positive neurons (double-labeled) and also neighboring cells (arrow). Low magnification also shows diffuse expression in the phrenic motor nucleus region; a higher magnification (inset) also shows expression specifically within phrenic motorneurons. Lower magnification represents are shown as a Z-stack (16 images, 2μm steps, rendered as max intensity; scale bar = 100μm) whereas higher magnification of the region of interest (inset) are a one stack image taken in the middle of the Z-stack to highlight nNOS expression within the cytoplasm (Scale bar = 10μm).