Abstract
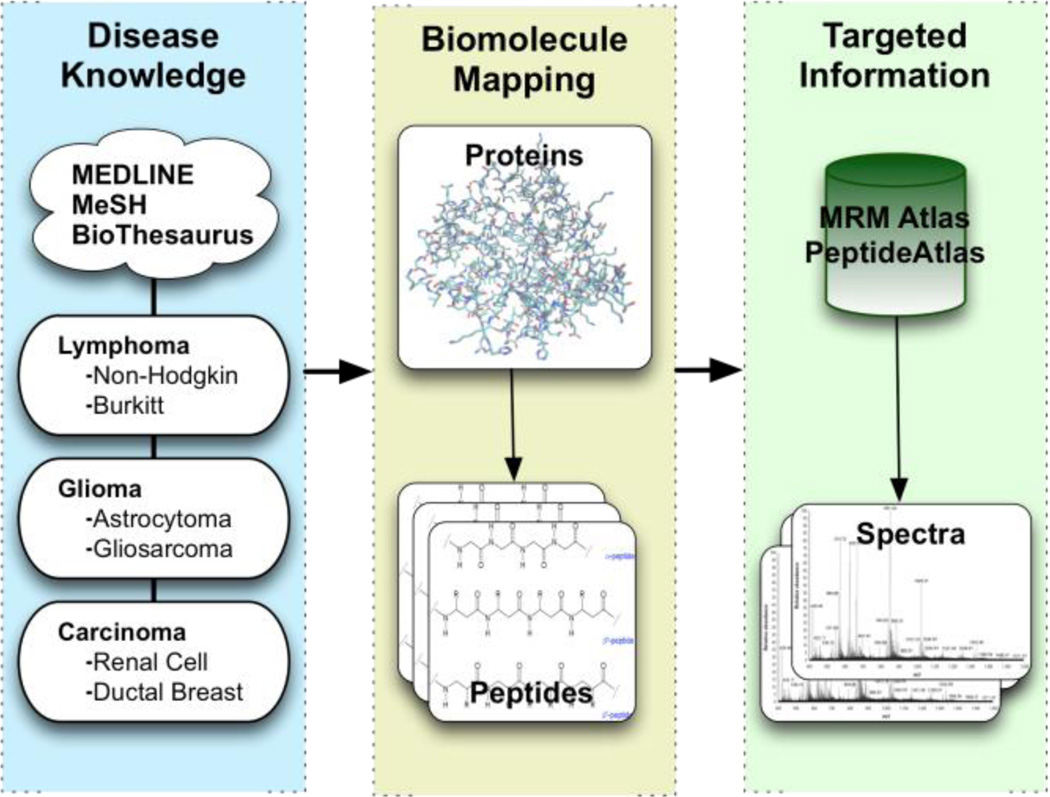
Mass spectrometry information has long offered the potential of discovering biomarkers that would enable clinicians to diagnose disease, and treat it with targeted therapies. Hundreds of human samples alone have been used to generate thousands of spectra for identification. This data, and the generation of targeted peptide information, represents the first step in the process of locating disease biomarkers. Reaching the goal of clinical proteomics requires that this data be integrated with additional information from disease literature and genomic studies. Here we describe PeptideAtlas and associated methods for mining the data, as well as the software tools necessary to support large-scale integration and mining.
Keywords: SRM, Mass spectrometry, proteomic, visualization, data mining
1 Introduction
The PeptideAtlas [1] provides a repository of information from thousands of mass spectrometry experiments across numerous, species, tissues and disease conditions. This wealth of data is an important source of information in the study of human diseases. Disease biomarkers help to both diagnose diseases such as cancer, as well as provide the potential for treatments (e.g. targeting virulence factors in infectious diseases). Mass spectrometry information has been used in identifying candidate biomarkers for diverse diseases including ovarian cancer [2] and erosive rheumatoid arthritis [3], as well as virulence factors for Streptococcus pyogenes bacteria [4].
The Atlas contains thousands of spectra, as well as associated data about identified peptides and putative proteins across multiple species. While the initial goal for the Atlas was to annotate genome information with peptides observable via mass spectrometry, advances in both instrumentation and informatics mean that it now provides an integrated view on the human proteome which can be mined to identify putative biomarkers that are detectable on the current generation of instrumentation.
As the purpose of the Atlas is to provide a comprehensive catalogue of experiments which can be used to both design new experiments and catalogue previous ones, the process of creating this Atlas has been standardized to ensure a high level of confidence in the data it provides. Starting in the laboratory a protein sample is prepared (possibly digested, labeled, purified or separated) and run on a mass spectrometer to generate MS/MS spectra. The spectra are then analyzed using one of several spectra matching tools (SEQUEST [5], X!Tandem [6], SpectraST [7]) to identify possible peptides. The identified peptides are then scored and filtered using PeptideProphet [8], matched to proteins in the appropriate organism database and annotated using ProteinProphet [9]. This process ensures that identified peptides and proteins meet a high standard for inclusion in an Atlas. Currently PeptideAtlas provides builds for nine different organisms ranging from mouse and human, to halobacterium and honeybee. New Atlases are being built regularly as well. This process is now being used to provide high-quality repositories of the detectable proteome across various species including human, which can be used to design targeted experiments.
This wealth of data that is represented in the PeptideAtlas currently, and which is being continually generated is clearly an important source of information in the study of human disease. Mining it through the use of appropriate tools and additional sources of information can enable researchers to target specific biomarkers of disease.
In the section 2 on “Mining for Biomarker Discovery” two approaches to mining PeptideAtlas data using literature associations and genomic annotations are described. Tools and services used to both integrate and mine this data are discussed in this section under “Service and Application Integration”. In section 3, “Architecture to Manage High-Throughput Spectral Data”, an overview is provided of the software architecture that is necessary to support high-throughput generation of Atlases as well as mining for targeted discovery.
2 Mining for Biomarker Discovery
The spectra and peptide information provided by the PeptideAtlas can be used to inform further studies into specific metabolic pathways or diseases ranging from bacterial infection to cancer. Mining the repository enables identification of specific transition patterns that uniquely identify proteins used as biomarkers. Ultimately this data needs to be integrated with other experiment technologies (e.g. gene expression, genomic sequencing, cellular imaging) which is becoming increasingly important in biomarker discovery.
Integrative approaches to the identification of biomarkers require the ability to explore and visualize inferences drawn from spectral libraries, scientific literature and genomic information. Integrating these multiple sources of information allows researchers to identify the peptide transitions that are most relevant to a particular disease or biological phenomena.
2.1 Disease Focused Mining
The Atlas provides information about the proteins and transitions of their constituent peptides. Due to the scale of the repository the discovery of the most suitable transitions that can uniquely identify proteins requires dedicated software and mining tools. When wishing to discover the most suitable transitions for proteins that are most likely to be associated with particular disease states, the complexity of this task is dramatically increased. The sheer number of factors and uncertainties with choosing the correct transitions for a particular set of diseases requires purpose built integration and inference tools.
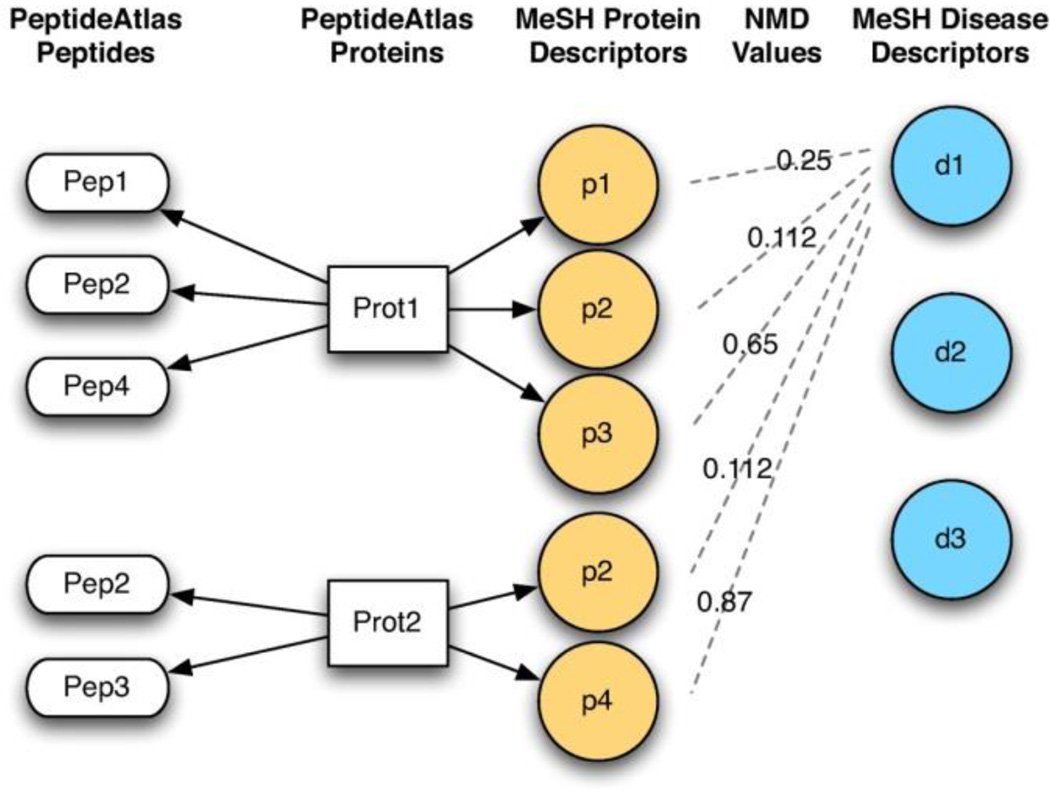
The main use of these tools is in the automatic design of transition lists for targeted proteomics experiments, although other usages are possible (e.g. filtering of tandem MS results). The identification of transition lists, that represent the detectable peptides of proteins most likely to be associated with a disease, requires inference of disease-protein associations (see Figure 1). Once these associations have been identified they can be integrated directly with the Atlas using one of the integration services provided. These integration services are described in section 2.3 (Service and Application Integration), and provide access to the Atlas using common protocols (see Figures 5–8).
Figure 1.
To generate the transition list two measures are taken, the first is a measure of the distance between a specific disease and a set of proteins that are known to be associated with a disease, the second is a measure between each protein and the “detectablity” of its constituent peptides. The first measure is based upon NGD and uses literature mining (through annotation associations). The second measure is based upon instrument specific observations and is derived directly from the Atlas.
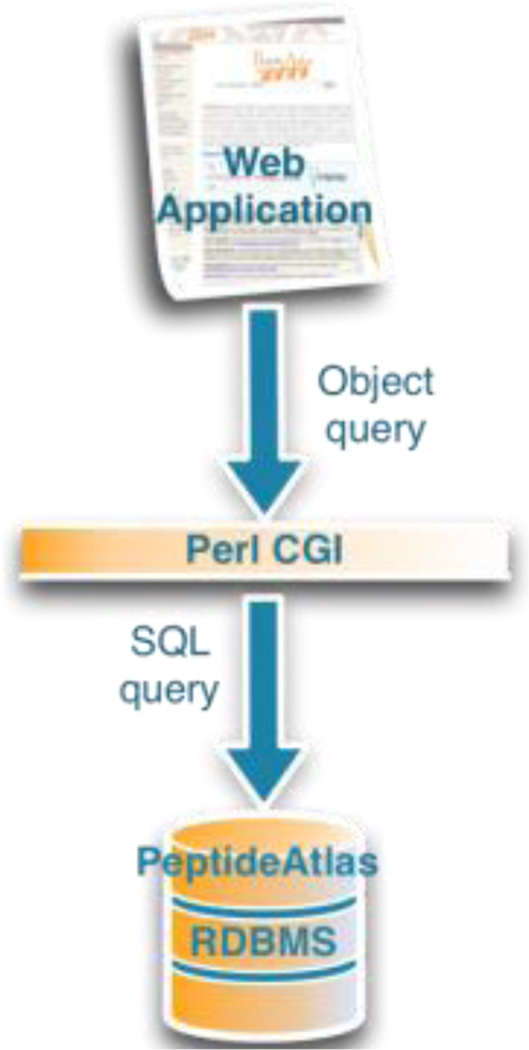
Figure 5.
The original PeptideAtlas web application was served through a standard Perl CGI layer that both creates the web page and responds to requests by making direct queries on the underlying database.
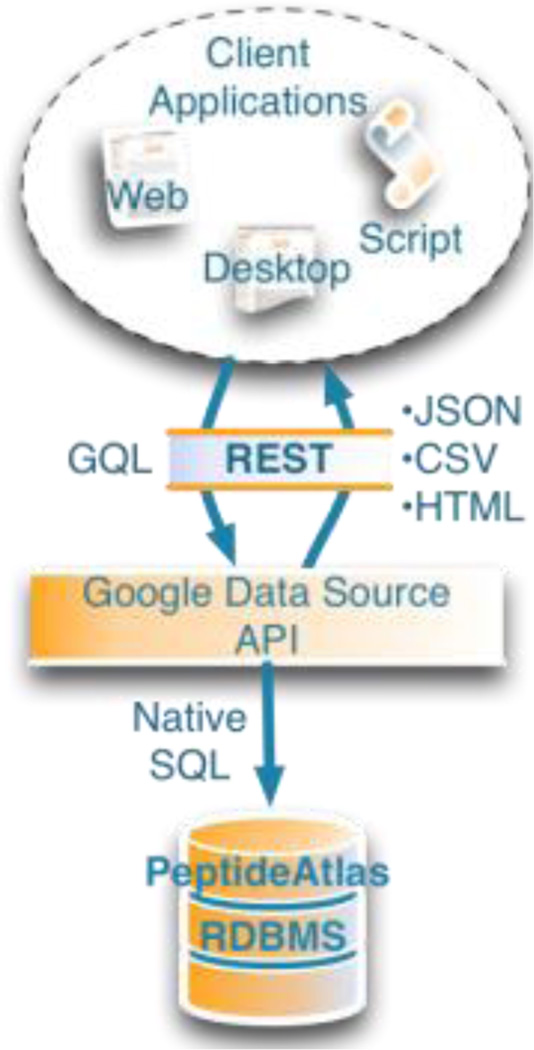
Figure 8.
The Google Data Source API is a single layer that takes RESTful web requests in a simplified query format (GQL) and translates it directly to SQL. Any client that can make HTTP requests can use the service.
The protein-disease associations can be inferred using a variety of means, and a dedicated tool has been developed to allow for such disease-centric mining. The tool infers relationships using the semantic distance between proteins and diseases, which are derived from co-occurrence of terms in MEDLINE. The association table between diseases and proteins is calculated and stored, and then used by the main application. The semantic relatedness of a protein and a disease is high (and the distance is therefore low) if the terms that represent them in MESH occur in the same documents with a high frequency; the score is normalized based upon the general frequency of the terms in MEDLINE. Conversely terms that do not co-occur frequency have a high distance. The underlying inference mechanism is based upon Normalized Google Distance (NGD). These distance measures are based upon well grounded theories of information complexity [11, 12]. For more information about the tool, and the inference mechanism see mspecLINE [13].
The derived underlying associations can then be used to infer sets of disease-protein networks. The Atlas disease based mining tool uses a threshold value, then expands the network to integrate information about detectable peptides and their suitability using the Atlas Empirical Observability Score (EOS) (see Figure 2).
Figure 2.
We used BioThesaurus, MEDLINE, and MeSH to construct the NMD and MEDLINE Data Stores. A web service on top of the Atlas operates on the caBIG Cancer Biomedical Informatics Grid [10], and provides information about observed spectra. A data service is made available as a Google Data Source, and can be queried using GQL. This service is a read-only SQL-like interface that allows complex queries across the collected data stores for the retrieval of disease and protein related information.
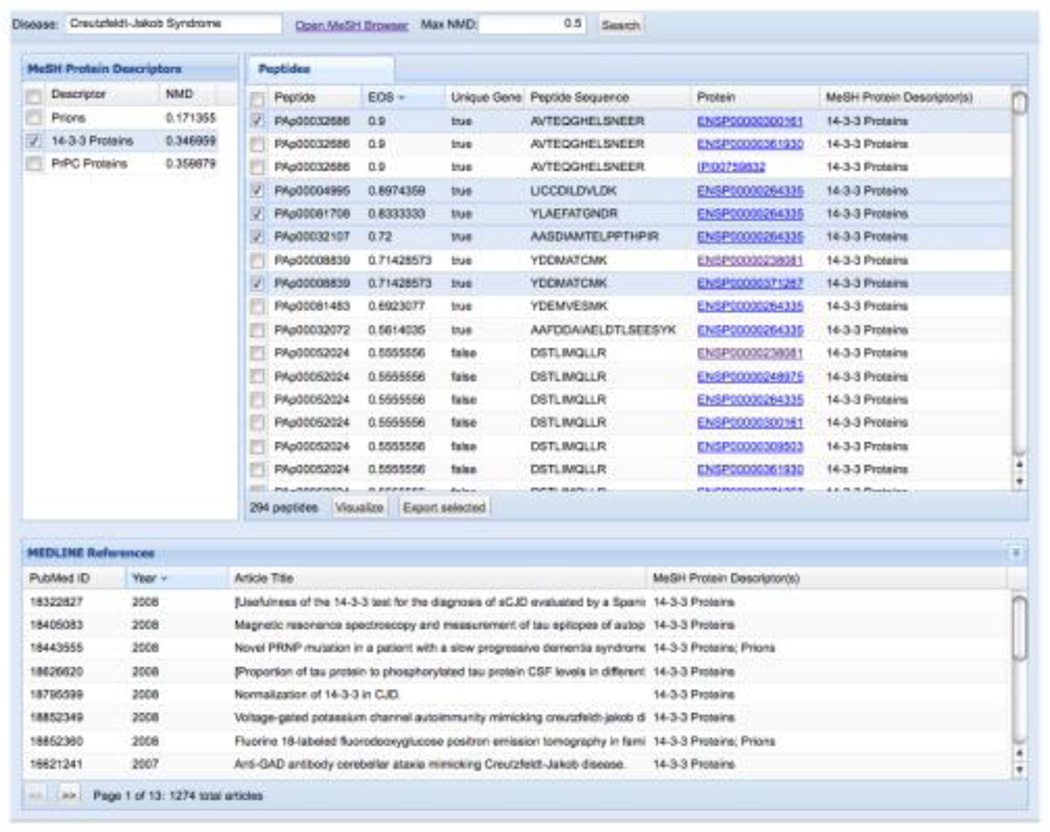
A graphical front end for the tool is provided (see Figure 3). This tool simplifies the process of using the inference and integration system, and allows the identification of disease specific peptide transitions to be undertaken with the minimal of knowledge about the underlying algorithms. Within the tool the user selects the disease they are interested in (as defined in MESH), and then the proteins most associated with that disease are shown. The peptides that can be used to identify those proteins can then be browsed, and can be filtered based upon EOS score to identify those that are proteotypic. All evidence for the associations can be directed mined through links to MEDLINE. Once the peptides are chosen these can be used to design targeted proteomics experiments through integration with ATAQS [14]. The transitions can also be viewed in Excel, and the derived disease-protein-peptide network can be visualized in Cytoscape (see Figures 9–10).
Figure 3.
Screen capture of the mspecLINE web user interface showing Creutzfeldt-Jakob Syndrome as an example disease. Researchers may review possible disease-related proteins and peptides observable in mass spectrometry experiments, review relevant literature from MEDLINE, and export selected peptides for later use.
Figure 9.
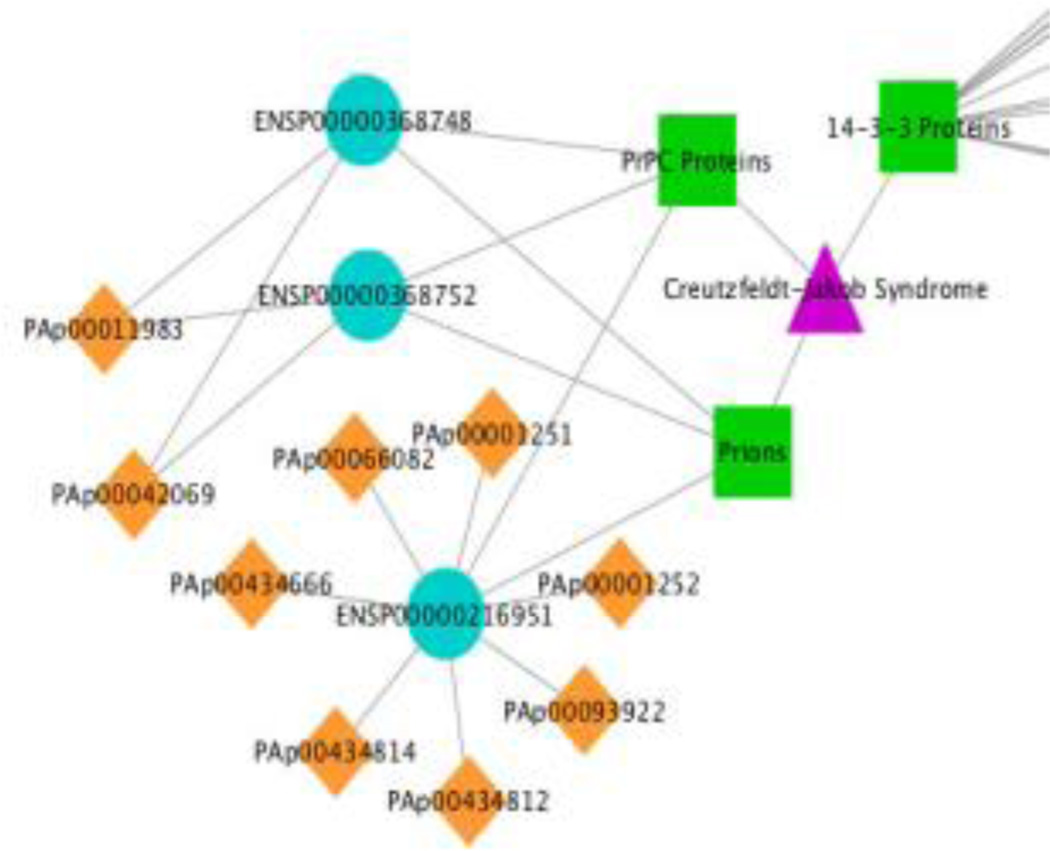
The Atlas programmatic interfaces can be used to support additional tool integration. Cytoscape uses a web service to access Atlas information. This is used by mspecLINE to show the suitability of the associated proteins to serve as biomarkers. Here the purple triangles show disease terms, the green boxes associated MESH-D terms, the cyan circles the mapped human proteins and the orange diamonds show the detectable peptides.
Figure 10.
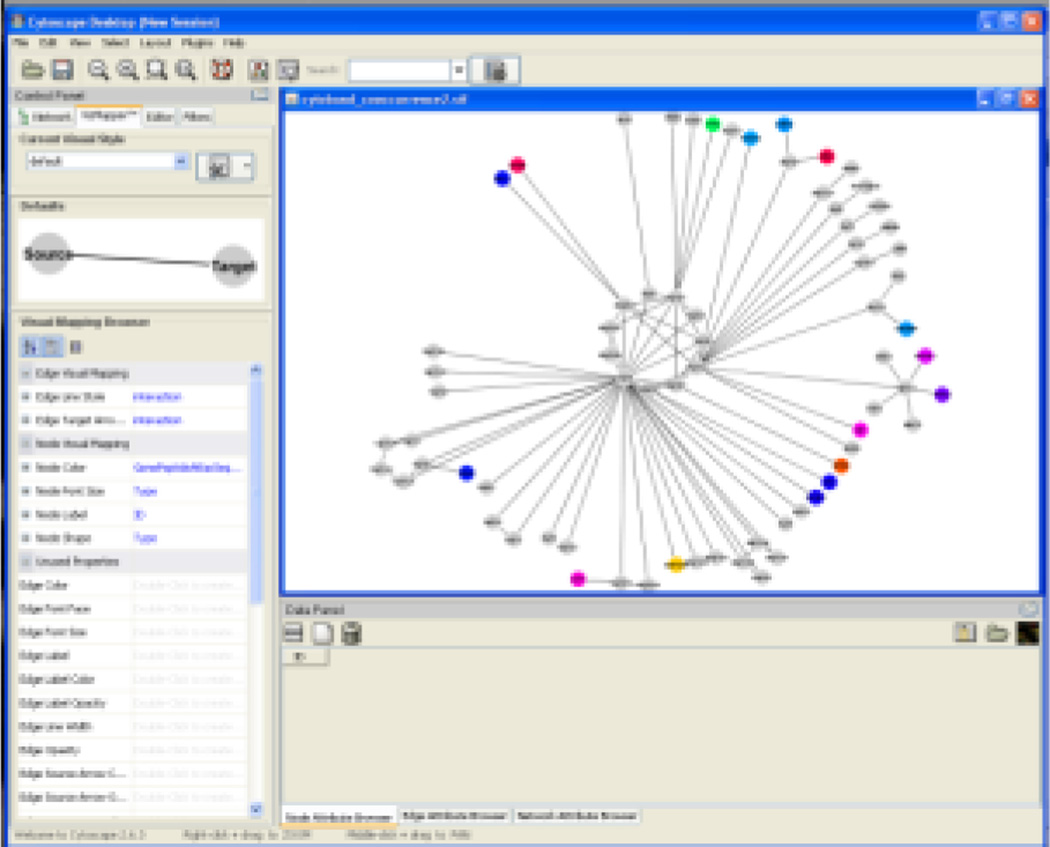
Using Cytoscape, the Atlas information can be overlaid on existing data in a network context, allowing users to locate potential biomarkers within the context of a given cancer network. In this case the network is inferred from the Cancer Genome Atlas project (TCGA). The network shows gene duplication co-occurrences, where associations are between genes that show similar copy-number variation. Atlas data is overlaid to highlight potential biomarkers in this network.
2.2 Gene Centric Mining
With the ever expanding genome centric information being generated it is important that gene based associations are supported in the Atlas. Projects such as The Cancer Genome Atlas (TCGA) are investigating the genomic causes of disease, and are generating huge repositories of genetic and epigenetic data. TCGA alone is generating data from over 10,000 patient genomic sequences across 20 different cancers with the goal of proving a map of the genomic mutations between both different cancers (e.g. Ovarian and Glioblastoma) and across patients within a single cancer. Such data will enable the creation of maps of normal genomic variation, disease-related disruption and disease progression. However, these projects do not provide links to proteomic resources, meaning that the data is lacking this important component which is needed for both validation of many of the findings, as well as the design of associated diagnostics tools and intervention strategies.
Researchers studying a particular disease with known genomic causes or involvement (e.g. Type I diabetes, Huntington’s disease, breast cancer) often target specific genes or loci to investigate such as BRCA1/2 in breast cancer or loci 2q31–q33, 6q21, 10p14-q11 in Type I diabetes. One of the primary initial motivations in the development of PeptideAtlas was to annotate genomes with identified peptide sequences. The generation of multiple human atlases has provided the opportunity to connect large-scale genomic disease data with all known human peptides that can be detected in a mass spectrometer. This allows for the integration of searches that are derived from other experiment types (e.g. high-throughput sequencing of genomes and transcriptomes).
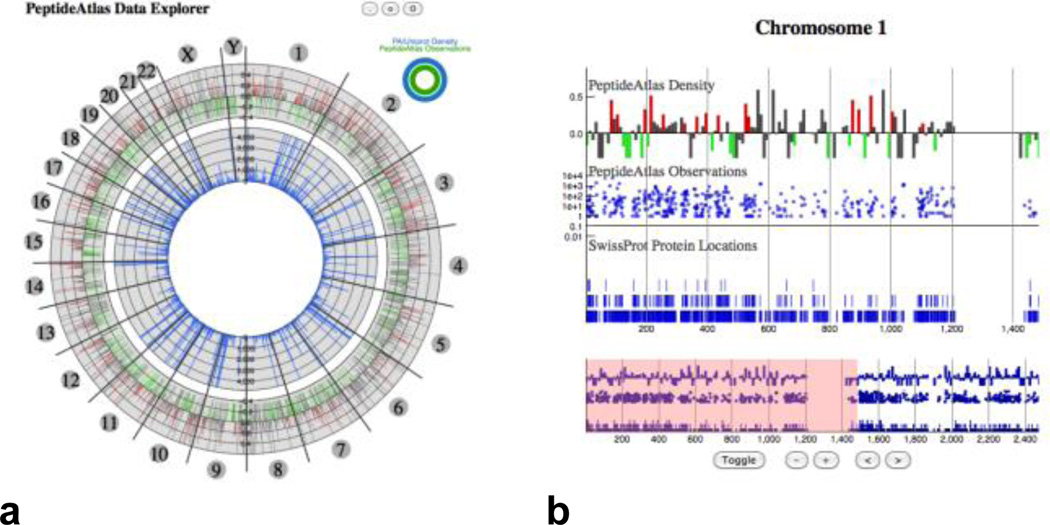
Multiple methods for gene centric mining of the Atlas data are currently available, and appropriate high-throughput visual tools are being developed to provide essential exploration tools (see Figure 4). These tools use specific knowledge (e.g. a gene, loci, or protein of interest) to filter down the search space, so that the spectral searching is manageable. Using visual analytics and information retrieval techniques on particular genes it is possible to discover the associated observed spectra information from PeptideAtlas. This enables the creation of a transition list that is refined to the hundreds of possible transitions that are actually detectable and associated with a specific genomic region.
Figure 4.
Exploring the PeptideAtlas through a gene centered view allows an investigator to mine observed spectra based on chromosome location (a), and drill further in by selecting a location of interest and viewing available genomic and proteomic annotations (b).
2.3 Service and Application Integration
When providing a large scale repository it is important to provide flexibility, as each experiment and researcher will have different needs. Even when mining the spectral data to create transition lists for targeted proteomics, the actual a priori knowledge will be different and the criteria for selection will depend upon the experiment. The researcher will typically wish to integrate the Atlas with genome, pathway or literature data to enable identification of appropriate biomarkers for a disease.
Due to the diversity of applications of large spectral repositories, both in terms of usage and users, a number of interfaces have been developed for the Atlas. Three main types of interface are available:
Direct Mining
These are interactive applications for the researchers to explore, query and retrieve transitions of interest (as discussed in sections 2.1 and 2.2). Two interfaces are currently available: the main PeptideAtlas web application (http://www.peptideatlas.org), and the mspecLINE [13] interface. The main application offers a gene or protein centric access mechanisms to the public datasets where a user can locate the spectra of peptides based on searches for specific identifiers (e.g. Gene Symbol, RefSeq, Ensembl Protein ID). The mspecLINE application offers a disease centric access system which integrations with MEDLINE and allows for searching based upon disease of interest with retrieval of selected peptide spectra.
Access mechanisms
The access mechanisms represent generic technologies which have broad applicability across the biomedical community. These interfaces offer a standard means for performing structured querying on remote data sources, and so are not specific to PeptideAtlas and may be implemented over any structured data. The interfaces offer a framework that the disparate data source providers integrate with. PeptideAtlas primarily provides information through a web application (see Figure 5) but it has also been integrated into three different interfaces (see Figures 6–8) to enable various usage: BioMart [15], caBIG [16] and GDS [17].
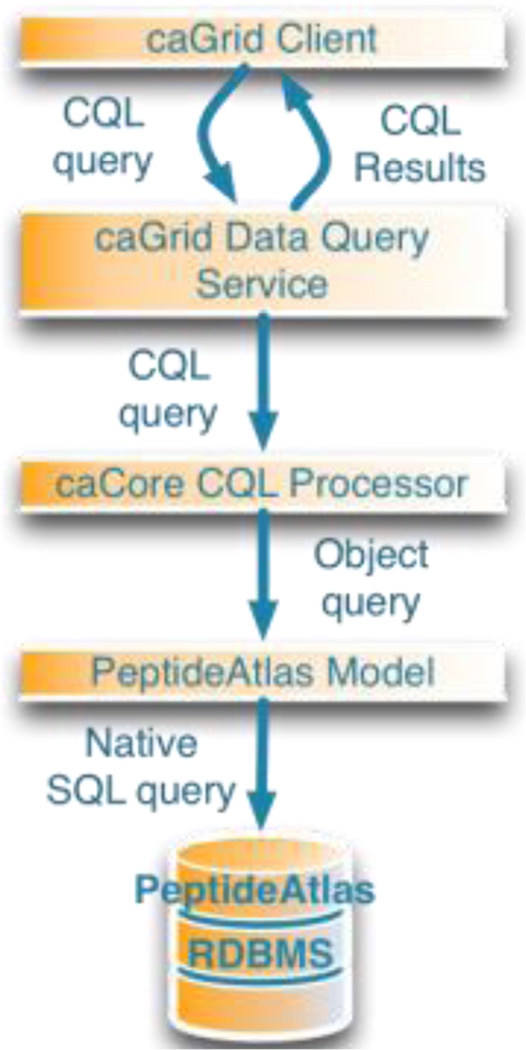
Figure 6.
caBIG provides a set of layers in the caGrid that a query is routed through. A CQL query is translated into a previously defined object model then to SQL. This layering allows for the inclusion of security and other horizontal services.
Specialized Interfaces
PeptideAtlas also offers a number of custom interfaces which are designed for specific applications. A number of bioinformatics tools are available that may be used to assist both in the identification of biomarkers (through integration with other sources of data) and the creation of transition lists. The Atlas has been used to: integrate with Cytoscape [18] to allow for the browsing of disease-protein-peptide associations (see Figure 9); provide additional data sources, so that the data can be overlaid on existing networks or used to infer new networks (see Figure 10); develop visual analytic tools which can be used to interactively browse the repository; and to integrate the lists with instruments for the actual experiment runs using ATAQS (ref). The Atlas is also integrated with Tranche [19] for interoperability with other repositories and bulk downloads of raw data.
As the Atlas continues to grow it is expected that the diversity of applications that use it will continue to expand. For this reason the interfaces that are provided on top of the Atlas are, where possible, standardized so that they are easy to access and use.
3 Architecture to Manage High-Throughput Spectral Data
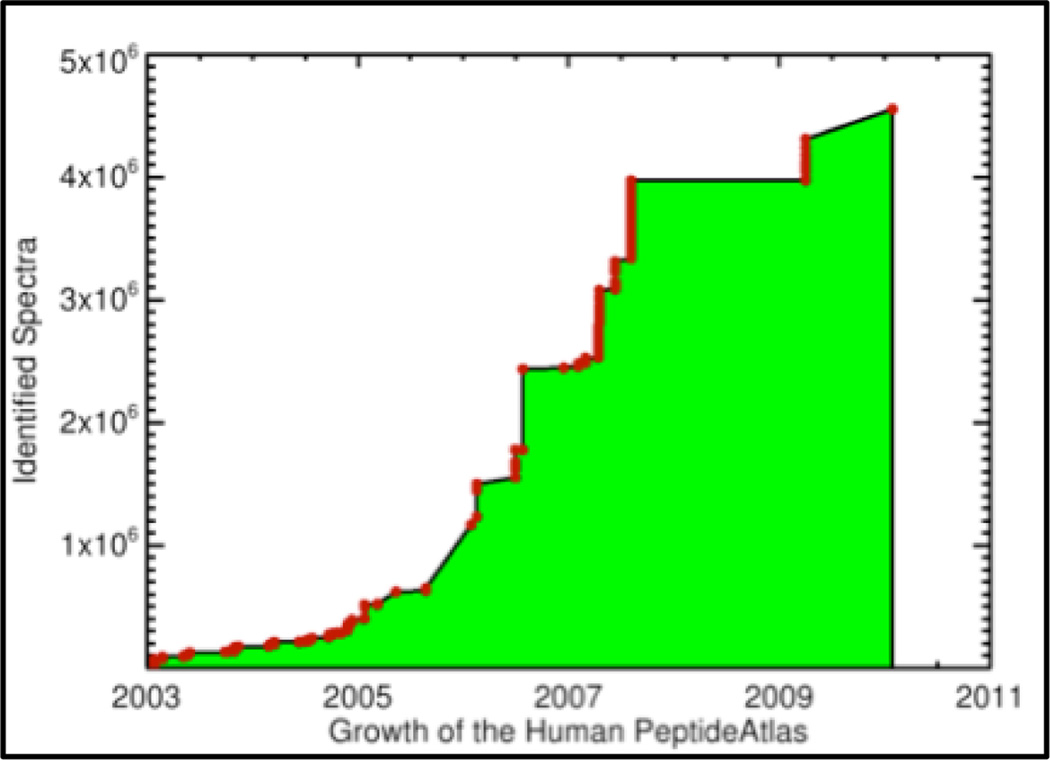
Proteomics has experienced the same explosion of high-throughput technologies seen in genomic sequencing and cellular imaging in the past decade. New instruments have enabled automated runs of multiple samples rapidly and with greater resolution, resulting in massive data sets (see Figure 11). A new technique for targeting specific proteins in complex mixtures, called Selected Reaction Monitoring (SRM) promises to greatly increase the usefulness of mass-spectra based proteomics in both experimental and diagnostic areas. The use of high-throughput technologies and targeting techniques to generate proteomic data from biological samples has made it necessary to develop management strategies for raw and analyzed data.
Figure 11.
PeptideAtlas began in 2003, and, over the years, data from 230 human LC-MS/MS experiments, comprising a total of about 55 million spectra, have been added. About 8% of those spectra could be assigned highly confident peptide identifications. Currently, the human PeptideAtlas contains about 4.5 million identified spectra corresponding to about 60,000 distinct identified peptides. These peptides map to 7553 highly non-redundant protein identifiers, covering about 1/3 of the protein-coding genes in the human genome.
The Atlases that have been built prior to large-scale use of SRM techniques have typically required manual data checking and processing. While standardized toolsets are available for the analysis of data (e.g. Trans Proteomic Pipeline (ref)), use of the tools requires both an expert user and manual location (through directory listings) of data in need of processing. Such manual processes are highly prone to both introducing and missing errors, especially as data throughput increases.
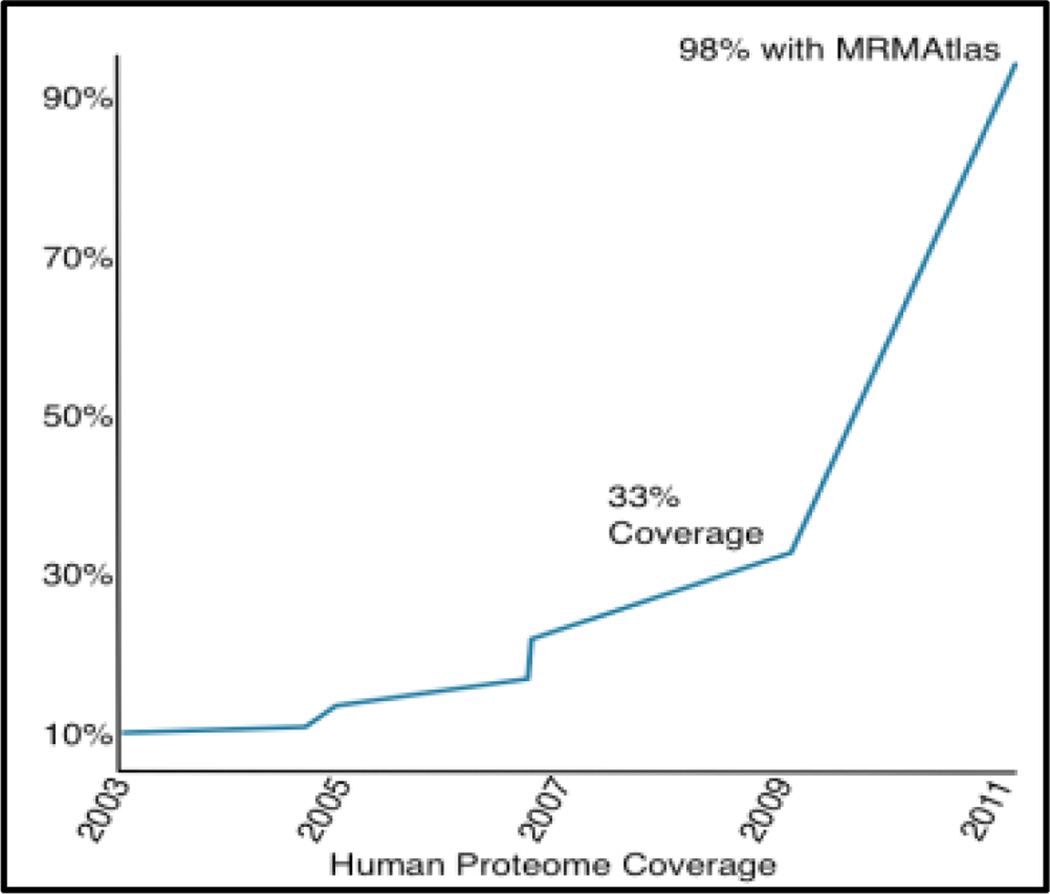
The need for a standard process has become more apparent with the development of a project to characterize the entire human proteome (approximately 1 million peptides) using SRM techniques (see Figure 12). A system providing this high level of QA and standardization has been developed to manage the data flow from the laboratory to final inclusion in a PeptideAtlas repository. It does this through supporting:
Information integration. Experimental data must be preserved from a sample’s entry in the laboratory to final analysis results. Multiple sources and types of data can be involved from tracking physical sample location and, preserving biological sample information to raw spectral data and results of the Trans Proteomic Pipeline.
Workflow management. Data that will be included in the PeptideAtlas is run through a standard processing pipeline that includes QA, spectral scoring and searching before peptide/protein identifications are added to the atlas. As high-throughput data cannot be run through such a process manually a workflow system is in place to ensure standard sample processing, as well as reporting any anomalous data for manual checks by the researcher.
Figure 12.
The use of SRM techniques will dramatically increase the coverage of the human proteome (as well as various other species including human infectious diseases). A protein is considered covered if the PeptideAtlas contains at least one peptide that maps to that protein. Access to these atlases will be critical in transition selection for targeted workflows such as biomarker discovery or quantification.
While this system enables researchers to locate and track proteomic samples and spectral data, supporting the workflow in a high-throughput environment requires a robust computational framework as well.
Using high performance computational (HPC) technologies, tools have been built for high-throughput processing of the data for PeptideAtlas. These tools take advantage of main HPC technologies. Grid and cluster based computing is the main processing framework used [20, 21], however both GPU (SpectraST [7]) and distributed systems (X!Tandem [22]) based computing have also been utilized.
4 Conclusion
The PeptideAtlas is a community resource which is growing in both size and functionality. As advances in mass spectrometry, and their relevance to clinical applications, increase so too will the importance of such repositories of information.
The PeptideAtlas provides a home for both public experiment data, as well as specialized sets of high quality information. Such standardization ensures that the information is applicable for targeted proteomics experiment design. As these data sets are continually growing in size and complexity, the sophistication of the mining tools associated with PeptideAtlas have had to increase. These tools allow for convenient access to the spectra information, and also allow the integration of the peptide data with both disease and gene centric information. Mining and integration mechanisms will continue to be expanded in the PeptideAtlas as its utility increases.
The advent of new instrumentation technologies in mass spectrometry, including new high mass accuracy and targeted approaches, means that the applicability of proteomics in the clinical environment is set to increase. The new approaches allow for a higher reproducibility of protein identifications in small concentrations from complex mixtures when compared to traditional methods. To be effective these approaches require background knowledge to be easily accessible and of a high quality. The PeptideAtlas project provides both of these, and so is set to become an essential tool in the study of human disease.
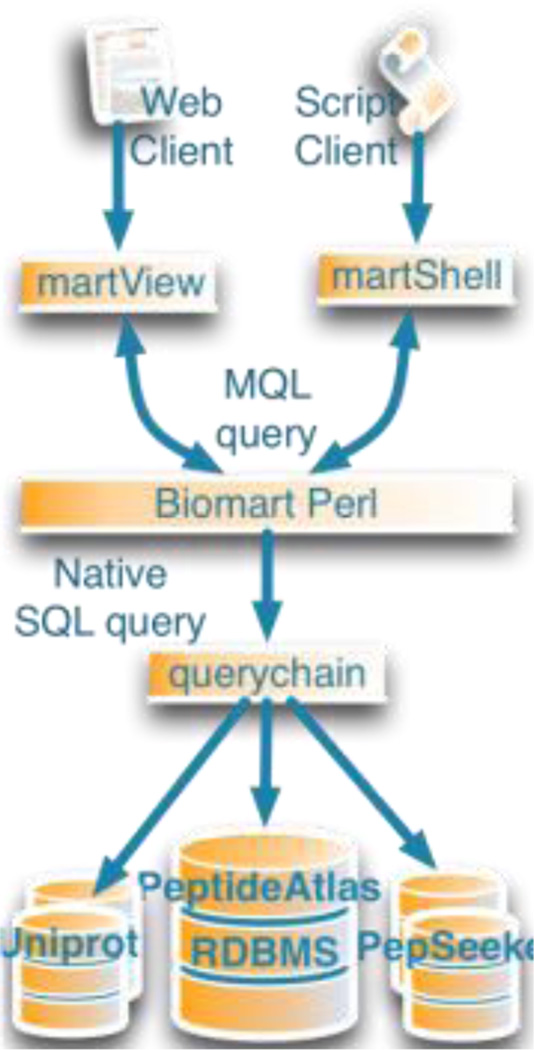
Figure 7.
To provide data as a BioMart service requires that the database schema fits the BioMart specification. This enables users to create queries across any database provided through the BioMart services.
Acknowledgements
This work was supported by grant numbers P50GM076547 and R01GM087221 from the National Institute of General Medical Sciences, NIH contract HHSN272200700038C from the National Institute of Allergy and Infectious Diseases, R01-1CA1374422 from the National Cancer Institute, and from the Systems Biology Initiative of the State of Luxembourg. The content is solely the responsibility of the authors and does not necessarily represent the official views of the NIH.
References
- 1.Desiere F, et al. The PeptideAtlas project. Nucleic Acids Res. 2006;34:D655–D658. doi: 10.1093/nar/gkj040. (Database issue). [DOI] [PMC free article] [PubMed] [Google Scholar]
- 2.Ye B, et al. Haptoglobin- Subunit As Potential Serum Biomarker in Ovarian Cancer. Clinical cancer research. 2003;9(8):2904. [PubMed] [Google Scholar]
- 3.Liao H, et al. Use of mass spectrometry to identify protein biomarkers of disease severity in the synovial fluid and serum of patients with rheumatoid arthritis. Arthritis & Rheumatism. 2004;50(12):3792–3803. doi: 10.1002/art.20720. [DOI] [PubMed] [Google Scholar]
- 4.Lange V, et al. Targeted quantitative analysis of Streptococcus pyogenes virulence factors by multiple reaction monitoring. Molecular & Cellular Proteomics. 2008;7(8):1489. doi: 10.1074/mcp.M800032-MCP200. [DOI] [PMC free article] [PubMed] [Google Scholar]
- 5.Eng J, McCormack A, Yates J., III An approach to correlate tandem mass spectral data of peptides with amino acid sequences in a protein database. Journal of the American Society for Mass Spectrometry. 1994;5(11):976–989. doi: 10.1016/1044-0305(94)80016-2. [DOI] [PubMed] [Google Scholar]
- 6.Craig R, Beavis RC. TANDEM: matching proteins with tandem mass spectra. Bioinformatics. 2004;20(9):1466–1467. doi: 10.1093/bioinformatics/bth092. [DOI] [PubMed] [Google Scholar]
- 7.Lam H, et al. Development and validation of a spectral library searching method for peptide identification from MS/MS. Proteomics. 2007;7(5):655–667. doi: 10.1002/pmic.200600625. [DOI] [PubMed] [Google Scholar]
- 8.Keller A, et al. Empirical statistical model to estimate the accuracy of peptide identifications made by MS/MS and database search. Analytical chemistry. 2002;74(20):5383–5392. doi: 10.1021/ac025747h. [DOI] [PubMed] [Google Scholar]
- 9.Nesvizhskii AI, et al. A statistical model for identifying proteins by tandem mass spectrometry. Analytical chemistry. 2003;75(17):4646–4658. doi: 10.1021/ac0341261. [DOI] [PubMed] [Google Scholar]
- 10.Saltz J, et al. caGrid: design and implementation of the core architecture of the cancer biomedical informatics grid. Bioinformatics. 2006;22(15):1910–1916. doi: 10.1093/bioinformatics/btl272. [DOI] [PubMed] [Google Scholar]
- 11.Li M, Vitanyi PMB. An introduction to Kolmogorov complexity and its applications. Springer-Verlag New York Inc.; 2008. [Google Scholar]
- 12.Bennett CH, et al. Information distance. Information Theory, IEEE Transactions on. 1998;44(4):1407–1423. [Google Scholar]
- 13.Handcock J, Deutsch EW, Boyle J. mspecLINE: bridging knowledge of human disease with the proteome. BMC Med Genomics. 2010;3:7. doi: 10.1186/1755-8794-3-7. [DOI] [PMC free article] [PubMed] [Google Scholar]
- 14.Brusniak MYK, et al. ATAQS: A computational software tool for high throughput transition optimization and validation for selected reaction monitoring mass spectrometry. BMC Bioinformatics. 2011;12(1):78. doi: 10.1186/1471-2105-12-78. [DOI] [PMC free article] [PubMed] [Google Scholar]
- 15.Kasprzyk A, et al. EnsMart: a generic system for fast and flexible access to biological data. Genome Res. 2004;14(1):160–169. doi: 10.1101/gr.1645104. [DOI] [PMC free article] [PubMed] [Google Scholar]
- 16.Kakazu KK, Cheung LW, Lynne W. The Cancer Biomedical Informatics Grid (caBIG): pioneering an expansive network of information and tools for collaborative cancer research. Hawaii Med J. 2004;63(9):273–275. [PubMed] [Google Scholar]
- 17.Google Code Data Source Library, "Introduction to the Data Source Library", 2010, http://code.google.com/apis/visualization/documentation/dev/dsl_intro.html. Available from: http://code.google.com/apis/visualization/documentation/dev/dsl_intro.html.
- 18.Shannon P, et al. Cytoscape: a software environment for integrated models of biomolecular interaction networks. Genome Res. 2003;13(11):2498–2504. doi: 10.1101/gr.1239303. [DOI] [PMC free article] [PubMed] [Google Scholar]
- 19.Falkner JA, Ulintz PJ, Andrews PC. A Code and Data Archival and Dissemination Tool for the Proteomics Community. American Biotechnology Laboratory. 2006 [Google Scholar]
- 20.Krishnan A. GridBLAST: a Globus based high throughput implementation of BLAST in a Grid computing framework. Concurrency and Computation: Practice and Experience. 2005;17(13):1607–1623. [Google Scholar]
- 21.Oehmen C, Nieplocha J. Scalablast: A scalable implementation of blast for high-performance data-intensive bioinformatics analysis. IEEE Transactions on Parallel and Distributed Systems. 2006:740–749. [Google Scholar]
- 22.Duncan DT, Craig R, Andrew J. Parallel tandem: a program for parallel processing of tandem mass spectra using PVM or MPI and X! Tandem. Journal of proteome research. 2005;4(5):1842–1847. doi: 10.1021/pr050058i. [DOI] [PubMed] [Google Scholar]


