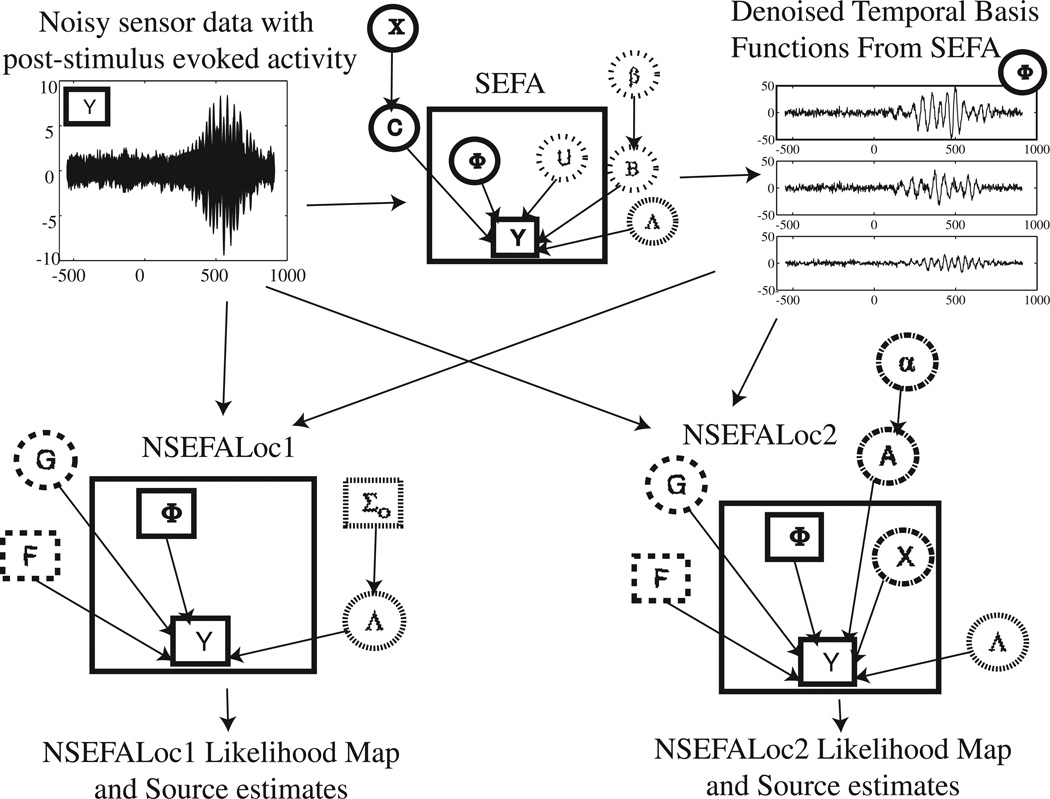
Fig. 1.
Graphical models for NSEFALoc1 and NSEFALoc2. Noisy sensor data is first processed by SEFA to determine the denoised temporal basis functions Φ, of which a linear mixture can produce any localized evoked source. These TBFs are then input as fixed bases to both NSEFALoc1 and NSEFALoc2, which estimate the spatial weighting G of these TBFs for each voxel. The likelihood map can be displayed, and the source estimate at its spatial peaks can be plotted. In each graphical model, quantities inside the large square are variables dependent on time while quantities outside are parameters/hyperparameters independent of time. Directed arrows between nodes indicate a probabilistic dependence. Square nodes are known (observed or computed) while circles nodes are unknown. The relative amounts of dashs/dots for each circle or square indicate groupings of nodes.

