Abstract
Plasma sodium concentration is normally held within a narrow range. It may, however, vary greatly under pathophysiological conditions. Changes in osmolality lead to either swelling or shrinkage of red blood cells (RBCs). Here we investigated the influence of suspension osmolality on biophysical properties of RBCs and their ability to perfuse an artificial microvascular network (AMVN). Blood was drawn from healthy volunteers. RBC deformability was measured by osmotic gradient ektacytometry over a continuous range of osmolalities. Packed RBCs were suspended in NaCl solutions (0.45, 0.6, 0.9, 1.2, and 1.5 g/dL), resulting in supernatant osmolalities of 179±4, 213±1, 283±2, 354±3, and 423±5 mOsm/kg H2O. MCV (mean corpuscular volume) and MCHC (mean corpuscular hemoglobin concentration), were determined using centrifuged microhematocrit. RBC suspensions at constant cell numbers were used to measure viscosity at shear rates ranging from 0.11 to 69.5 s−1 and the perfusion rate of the AMVN. MCV was inversely and MCHC directly proportional to osmolality. RBC deformability was maximized at isosmotic conditions (290 mOsm/kg H2O) and markedly decreased by either hypo- or hyperosmolality. The optimum osmolality for RBC suspension viscosity was shifted towards hyperosmolality, while lower osmolalities increased suspension viscosity exponentially. However, the AMVN perfusion rate was maximized at 290 mOsm/kg H2O, and changed by less than 10% over a wide range of osmolalities. These findings contribute to the basic understanding of blood flow in health and disease, and may have significant implications for the management of osmotic homeostasis in clinical practice.
Keywords: osmolality, red blood cell deformability, microvascular perfusion, microfluidics
Introduction
Plasma osmolality is primarily determined by the plasma sodium concentration. It is held within narrow limits under normal physiological conditions. Alterations in plasma osmolality are readily sensed by hypothalamic receptors in the brain, which initiates compensatory mechanisms such as water intake in the case of hyperosmolality or water excretion in the case of hypoosmolality. In hypoosmolality, the secretion of antidiuretic hormone ADH is suppressed, which leads to decreased water reabsorption in the collecting tubules of the kidney and thereby increases water excretion. In hyperosmolality, the body reacts with thirst-driven water ingestion and an increased ADH secretion leading to water retention in the kidney.1, 2
This normal homeostasis of plasma sodium concentration and osmolality can be disturbed under pathophysiological conditions and represents the most common clinical electrolyte disorder,1 which is associated with a considerable morbidity and mortality when severe.3, 4 However, even mild hypoosmolality caused by hyponatremia is associated with a poor outcome in chronic heart failure.5 Hyponatremic hypoosmolality of severe degree can occur in the syndrome of inappropriate ADH secretion (SIADH), e.g. after brain injury, or when an excess of free water is either ingested or infused during medical treatment. Symptoms are nausea, malaise and headache, followed by lethargy, disorientation, seizure, coma and even death in severe hyponatremia.6 On the other hand, hypernatriemic hyperosmolality, which is much less common, is seen in diabetes insipidus due to either a lack of ADH or an unresponsiveness of the kidney to ADH. Symptoms of hypernatriemic hyperosmolality are similar to symptoms of hyponatremic hypoosmolality: initial unspecific symptoms such as anorexia, restlessness, nausea and vomiting are followed by more severe neurological symptoms such as lethargy, stupor or coma.1, 7
The neurological symptoms are caused by an osmotic gradient, which is generated between the extracellular space and the intracellular compartment of brain cells. In case of hypoosmolality, water moves into neuronal cells and causes cell swelling and tissue edema,8, 9 in hyperosmolality, water is lost from the cells which leads to cell shrinkage. Both conditions impair cell function. Cell swelling and shrinkage is induced in every cell exposed to osmotic gradients, including blood cells.10 In hypoosmolality, the red blood cells (RBCs) increase their volume and thereby sphericity and at the same time reduce the cellular viscosity determined by the intracellular hemoglobin concentration.11 On the other hand, hyperosmolality leads to a volume reduction but increased cellular viscosity.11 These opposing changes could have an influence on RBC deformability, and thus on microvascular blood flow. It was the aim of the study to investigate the role of osmolality of the suspending medium on RBC deformability, RBC suspension viscosity and the ability of RBCs to perfuse an artificial microvascular network.
Materials and Methods
Sample Preparation
Solutions with different osmolalities were prepared as follows. Saline (0.9% NaCl, 277mOsm/kg H2O) was used as a basis. For hypoosmolar solutions it was diluted 1:1 and 2:1 with distilled water, which resulted in measured osmolalities of 136 and 182 mOsm/kg H2O, respectively. Higher osmolalities were obtained by adding either 30 mg or 60mg sodium chloride (Sigma-Aldrich, St. Louis, MO, USA) to 10 mL of saline, yielding osmolalities of 373 and 466mOsmol/kg, respectively. Osmolalities were measured with a vapor pressure osmometer (Vapro 5520, Wescor Inc., South Logan, Utah, USA). All experiments described below were completed within 2 h.
Blood was taken by venipuncture from healthy volunteers (age range 20-65 years), who gave their informed consent to the in vitro study. Tubes containing 1.8mg/mL K2EDTA as an anticoagulant were used. Routine hematological analyzers (Sysmex XT-1800i, Sysmex Digitana Co, Horgen, Switzerland; Medonic M-series, Boule Medical AB, Stockholm, Sweden in the USA) were used to determine RBC count and mean cellular hemoglobin (MCH). Hematocrit (Hct) was determined by microcentrifugation. For each sample 3 uncoated hematocrit glass tubes (length 75 mm) were filled and centrifuged for 5 min in a micro-hematocrit centrifuge (IEC MB Centrifuge, Damon), the Hct was determined (Hawksley Micro-hematocrit Reader, Lancing, Sussex, UK) and the mean value calculated. The Hct was used to calculate the mean cellular volume in the actual suspension with a given osmolality (MCV = Hct*10/RBC count). This MCV was then used to calculate the MCHC (MCHC = MCH/MCV). Samples of RBCs incubated at high and low osmolality were fixed in 1% glutaraldehyde and prepared for scanning electron microscopy as described previously.12
Ektacytometry
RBC deformability was analyzed by laser diffraction in an ektacytometer (Technicon, Bayer, Leverkusen, Germany) using an osmoscan mode.13 Blood from 6 healthy volunteers (age range 28-50 years) anticoagulated with EDTA as described above was used. Aliquots of 500 µL whole blood were mixed with 3 mL of an isotonic 20% dextran 70kDa solution and inserted into the ektacytometer. RBC elongation as a measure of deformability was then registered continuously while the osmotic conditions were gradually changed, going from hypoosmolality to hyperosmolality. The osmotic gradient was generated by adding sodium chloride to the solution in one compartment of the gradient mixer. The osmolality of the suspension was measured by determining the conductivity of the solution close to the diffractometer of the instrument, which had been calibrated by a series of different osmolalities by cryoscopic osmometry (Osmomat 030, Gonotec GmbH, Berlin, Germany). RBC deformability was plotted against the suspension osmolality. The analog output was digitized using a 12-bit A/D-converter (NI USB-6008, National Instruments, Austin, TX, USA). The deformability index (DI) was calculated at given osmolalities used in the other experiments (179, 213, 283, 354, and 420 mOsm/kg H2O).
Viscometry
EDTA-blood from 8 healthy volunteers was centrifuged at 1500 × g for 5 min. The plasma and buffy coat were discarded. Volumes of 500 µL packed RBCs were added to 750 µL of NaCl solutions with increasing osmolalities (see above). The RBC count and hematocrit of these samples were measured. The hematocrit was then adjusted to 40% in the isotonic aliquot (283 mOsm/kg H2O) by removing a calculated volume of suspending medium. The resulting actual RBC count in the 283 mOsmolar (isosmotic) sample was then used to adjust the same RBC count in the other samples. The final centrifuged hematocrit values of the different osmolality samples were calculated accordingly. RBC suspension viscosities were measured with a couette viscometer (Contraves LS 30, ProRheo, Althengstett, Germany) at room temperature (20-22° C) at shear rates of 69.5, 27.7, 11.0, 3.23, 0.95, 0.28, and 0.11 s−1.
Perfusion of artificial microvascular networks
Artificial microvascular network (AMVN) devices were fabricated using previously described methods.14-17 Each polydimethylsiloxane (PDMS) AMVN device consisted of three identical networks of microchannels, each with a separate domed inlet (4 mm diameter), that all converged into a common domed outlet (1.5 mm diameter) connected to an adjustable water column.14, 15 The interconnected microchannels making up the AMVN had a depth of 5 μm and ranged in width from 5 to 70 μm. The layout of the AMVN was inspired by the microcapillary architecture of rat mesentery and has been described in detail previously.14
Fresh blood antricoagulated with EDTA from 5 healthy volunteers was centrifuged at 1500 × g for 5 min. 100 µL packed RBCs were then resuspended in 150µL NaCl solutions (target hematocrit 40% at isotonicity) of increasing osmolalities (see above). To perform the measurement, 60 µL samples of resuspended RBCs were loaded into the inlets of the AMVN device with a conventional 10-100 μL pipette tip, image acquisition was initiated and the driving pressure was increased to 20 cmH2O. Image acquisition continued for 10 minutes. An inverted bright field microscope (IX71, Olympus America Inc., Center Valley, PA, USA) equipped with a high-speed camera (MC1362, Mikrotron GmbH, Unterschleissheim, Germany) were used to acquire images. The camera was programmed to acquire sets of 10 frames at 100 fps every 10 seconds. A custom algorithm in MATLAB (The Math Works Inc., Natick, MA, USA) computed mean cell velocity in the microchannel exiting each network unit from the average change in cell position between consecutive timed images for each image set. AMVN perfusion rate was then calculated as the product of mean cell velocity and the cross-sectional area of the exit microchannel (350 μm2).14
Results
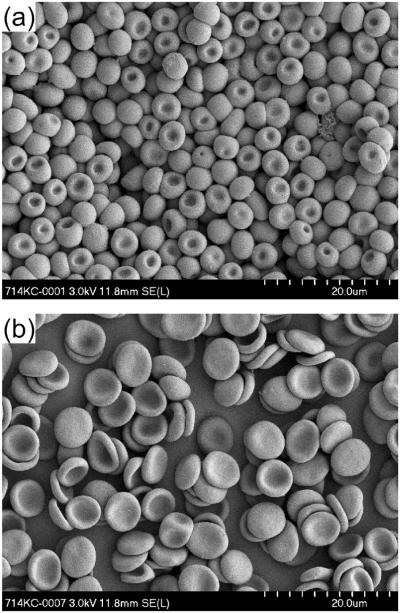
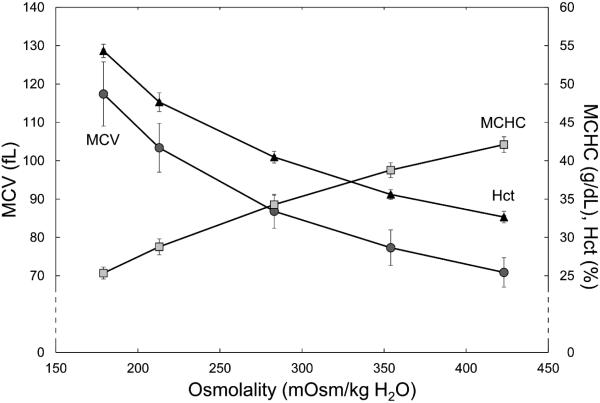
The initial osmolalities of the suspending solutions were 138, 183, 277, 376, and 468 mOsm/kg H2O. The suspension of RBCs in these solutions with a target hematocrit of 40% led to an osmotic equilibration between the suspending solution and the cytoplasm of RBCs. After centrifugation, the osmolalities in the supernatant were 179 ± 4, 213 ± 1, 283 ± 2, 354 ± 3, and 423 ± 5 mOsm/kg H2O, respectively. Hypoosmolality induced water uptake by the discocytes leading to spherical swelling with a reduction of the cell diameter (Fig. 1a). On the other hand, hyperosmolar conditions dehydrated RBCs, which became more flattened discocytes (Fig. 1b). The difference in diameter seen in Figure 1 may be exaggerated due to the isotonic glutaraldehyde fixing solution, which might have decreased osmotically the existing RBC volume in hypoosmolar medium. The influence of the different osmolalities on MCV and MCHC is shown in Figure 2. With increasing osmolality, MCV decreased, while MCHC increased. Correspondingly, the hematocrit for a given number of RBCs was inversely proportional to osmolality: it increased with lower and decreased with higher osmolality (Fig. 2).
Figure 1.
Scanning electron micrographs of RBCs at an original 2000x-magnification. (a) RBCs in hypotonic solution (189 mOsm/kg H2O). (b) RBCs in hypertonic solution (431 mOsm/kg H2O).
Figure 2.
The centrifuged hematocrit (Hctc, triangles) and the calculated RBC indices – MCV (circles) and MCHC (rectangles) – for constant RBC numbers at different osmolalities. Mean values ± SD, n = 6.
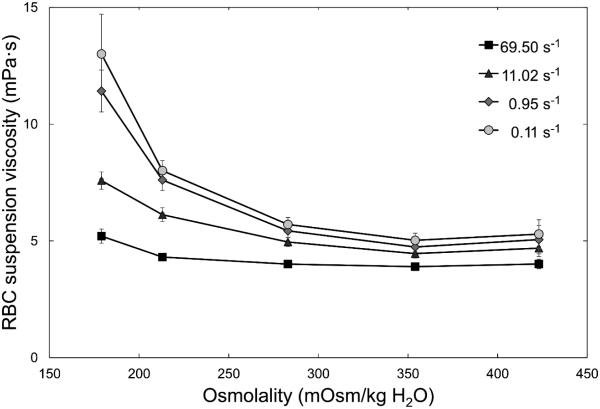
The suspension viscosities at constant numbers of RBCs in solutions with different osmolalities for shear rates of 69.5, 11.0, 0.95, and 0.11 s−1 are shown in Figure 3. Hypoosmolality increased suspension viscosities, while hyperosmolality did not, or even tended to lower it compared with isotonicity. These differences increased with decreasing shear rates; at the lowest shear rate (0.11s−1) suspension viscosity was more than doubled at 179 mOsm/kg H2O in comparison with 283 mOsm/kg H2O. Suspension viscosities at a shear rate of 27.7s−1 are given in Table 1; data obtained at 3.23 and 0.28 s−1 did not add value and are not shown.
Figure 3.
Viscosity of RBC suspensions at room temperature for a range of osmolalities measured at shear rates of 69.5, 11.02, 0.95 and 0.11 s−1 with a couette viscometer. Mean values ± SD, n = 8.
Table 1.
Summary of hemorheological parameters at different suspension osmolalities (mean values ± SD).
| Osmolality (mOsm/kg H2O) | 179 | 213 | 283 | 354 | 423 |
|---|---|---|---|---|---|
| Ektacytometric DI (%) | 31 ± 4 | 46 ± 5 | 62 ± 1 | 52 ± 8 | 33 ± 23 |
|
Suspension viscosity (mPa·s) at
27.7 s−1 |
5.3 ± 0.2 | 5.1 ± 0.2 | 4.5 ± 0.2 | 4.3 ± 0.2 | 4.4 ± 0.3 |
| AMVN perfusion rate (nL/s) | 0.226 ± 0.003 | 0.230 ± 0.005 | 0.236 ± 0.008 | 0.226 ± 0.004 | 0.221 ± 0.011 |
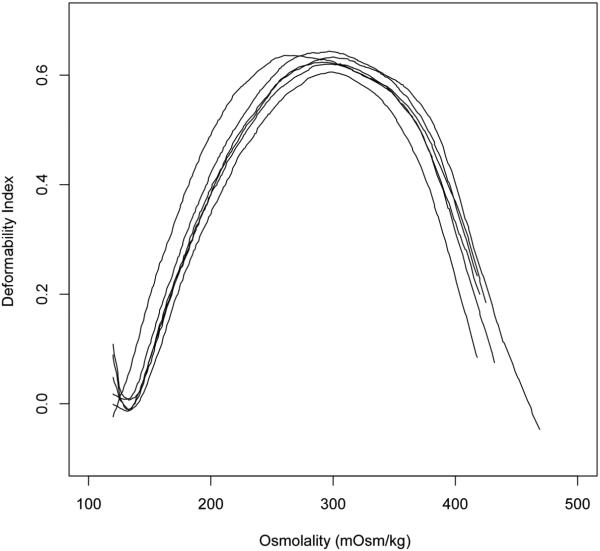
Figure 4 shows the results of the osmotic gradient ektacytometry measurements The ektacytometry curve had a characteristic bell shape (Fig. 4), with the highest RBC deformability corresponding to the isotonic conditions (283 mOsm/kg H2O). Hypoosmolality and hyperosmolality both led to a decrease in RBC deformability as measured by osmotic gradient ektacytometry. The numeric values of the ektacytometric deformability index (DI) at the 5 investigated osmolalities is shown in Table 1.
Figure 4.
Deformability index (DI) measured by osmotic gradient ektacytometry for RBCs across a range of osmolalities. Each line (osmoscan) corresponds to a separate sample, n = 6.
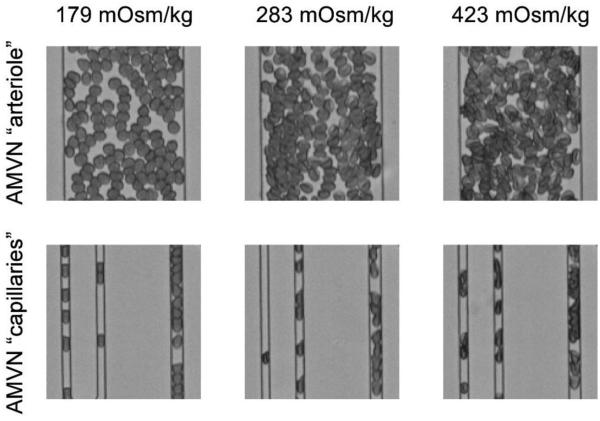
Figure 5 shows microscopic pictures of RBCs suspended at different osmolalities flowing through the artificial microvascular network (AMVN). RBCs in a hypotonic solution (left side) appeared more spherical and were less dense, whereas in a hypertonic solution they appeared more dense (right side) than in isosmotic conditions (middle). Hypoosmotically swollen RBCs filled a 7 µm wide microchannel almost entirely. Because they were not completely spherical (see Fig.1), however, they were able to deform during the passage of 5 µm channels into a sausage-like shape with two convex ends, which is in contrast to isoosmolality (middle) showing missile-like shapes with a convex front end and concave trailing end.
Figure 5.
Bright-field micrographs of RBCs suspended in hypotonic (left), isotonic (middle) and hypertonic (right) solutions as they perfuse portions of the AMVN. Inlet arterioles with a diameter of 70 µm (upper row) and capillaries with diameters of 5 µm and 7 µm (lower row) are shown.
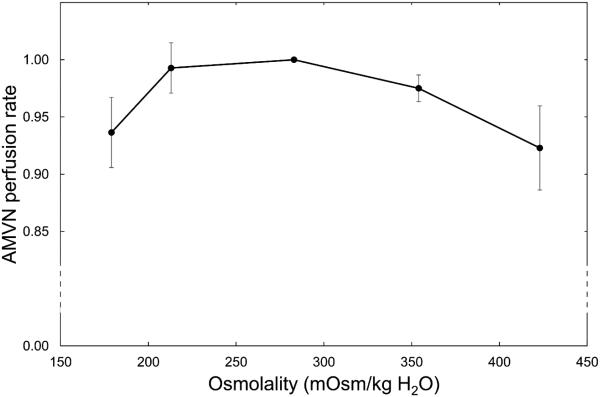
The effect of osmolality on the ability of RBCs to perfuse the AMVN is shown in Figure 6. The mean perfusion rate for each sample was calculated as the cross-sectional area (350 μm2) multiplied by the average of the mean cell velocities in the venule of the AMVN for the first 10 sets of images after the three velocities plateaued (simultaneously) following the increase of the driving pressure to 20 cmH2O (as previously described).15-17 Figure 6 shows normalized (with respect to isotonic conditions) perfusion rates for RBCs resuspended at constant RBC numbers (corresponding to 40% hematocrit in isotonic saline) in suspending solutions with initial osmolalities of 150, 200, 300, 400 and 500 mOsm/kg H2O and measured average osmolalities in the supernatant of 189, 228, 293, 364, and 431 mOsm/kg H2O. RBCs showed the maximum AMVN perfusion rate in isotonic conditions. Deviations from isoosmolality in either direction decreased the AMVN perfusion rate (maximum decrease in mean AMVN perfusion rate was 6.6%). The numeric data are given in Table 1.
Figure 6.
Normalized AMVN perfusion rates (relative to the AMVN perfusion rate under isosmotic conditions) for RBCs suspended in solutions with different osmolalities. Mean values ± SD, n = 5.
Discussion
The osmolality of the suspending medium affected RBC shape. As originally described by Evans and Fung,18 hypoosmolality gradually increases RBC thickness and decreases the diameter, while the two opposing dimples persist until a spherical shape is reached. Our morphological analysis by scanning electron microscopy (Fig. 1a) at severe hypoosmolality indicates that one dimple persists until complete sphericity is reached, while the opposing dimple disappears, leading to an extreme form of cup-shaped RBC, which agrees also with earlier theoretical considerations.19 The persistence of a marked dimple area in an otherwise almost spherical shape is remarkable, it is not an artifact of RBC fixation by glutaraldehyde or the sample preparation.20 The biconcave RBC shape is explained by the principle of least total curvature of the membrane, which means that the bending energy is minimized.19 The biophysical properties of the membrane are considered to be uniform over the surface,19 with dimple areas moving over the membrane surface during the tank-treading motion in shear flow. That is, RBC deforms to an ellipsoidal shape and its membrane rotates steadily around the cell,21 which also occurs in hypotonically swollen RBCs.22 Our scanning electron micrographs also show (Fig. 1b) that RBC shrinkage in hypertonic medium rarely induces RBC crenation (echinocytosis), which had been observed for higher osmolalities in earlier studies.11, 23
Automated hematology analyzers used routinely in clinical practice cannot detect osmotically induced changes of RBC volume because a relatively large volume of isotonic solution is added to the sample in the instrument before measurement,24 which reverses the RBC volume almost instantly.25 Osmotically induced changes of RBC indices are therefore rarely reported in the literature. The RBC indices must be assessed with the help of centrifuged microhematocrit, which analyses RBCs at the actual suspension osmolality. It has been shown that osmolalities below 250 mOsm/kg increase the sphericity of RBCs to a point, where the trapping of suspending medium between RBCs during centrifugation gradually increases, which leads to an overestimation of MCV.26 This may explain the non-linear increase of MCV and decrease of MCHC at very low osmolalities shown in Figure 2.
Osmotic gradient ektacytometry is an elegant way to measure RBC deformability by quantifying cell elongation under high shear conditions in a continuum of osmolalities.13, 27 We observed maximum elongation (deformability index) around 290 mOsm/kg H2O. The osmolality with maximum RBC elongation varies among different species, for example, it is around 350 mOsm/kg H2O in mice and pigs.28 The maximum ektacytometric elongation index represents a balance in the adjustment of cell surface area-to-volume ratio, and intracellular viscosity. The deformability index declined at hypoosmolality because of the osmotically increased volume at constant surface area; at hyperosmolality, the deformability index decreases because of the increased intracellular viscosity due to osmotic loss of water and rising hemoglobin concentration.27 Cell elongation during flow in an ektacytometer is one way to measure certain aspects of RBC deformability, which can, however, not be generalized for all types of RBC deformations present in the microcirculation. The capability of RBCs to pass narrow channels is determined by other factors, including the surface area/volume ratio (or sphericity) of the cells. Previous filtration experiments have shown that isoosmolality (290 mOsm/kg H2O) does not necessarily maximize the measured RBC deformability. In filters with larger pores (7µm), 200 mOsm/kg H2O generated the lowest filtration resistance, whereas in filters with very small pores (3µm) hyperosmolality around 400 mOsm/kg H2O generated the lowest filtration resistance.11 These findings emphasize that RBC deformability cannot be sufficiently described by a single in vitro test, but needs to be accessed more comprehensively with several different methods.15
For the measurement of viscosity, RBCs were suspended at a constant cell number, but variable hematocrit. Hypoosmolality, which induced RBC swelling and by that increased hematocrit, increased suspension viscosity at all shear rates. The use of saline instead of plasma as a suspending medium eliminated RBC aggregation, which would have further increased low shear viscosity. Hypotonically swollen RBCs have been shown to aggregate less,11 which may counterbalance to some extent the increased low shear viscosity at hypoosmolality in vivo.
We evaluated the ability of RBCs suspended in saline of different osmolalities to perfuse microvasculature by measuring the perfusion rate of an artificial microvascular network (AMVN). In the AMVN device, RBCs experience a wide range of physiologically relevant deformations, similar to those they experience in vivo, including folding deformations when entering the smallest capillary microchannels, and deformations due to shear and cellular collisions occurring in larger channels. Thus, because RBCs experience multiple types of deformation challenges, the measurement of the AMVN perfusion rate for a RBC suspension provides a much more comprehensive assessment of RBC rheological properties than conventional, single-parameter measurements of RBC deformability.14, 15 Here we showed that deviations in osmolality (±100 mOsm/kg H2O) resulted in relatively minor decline in AMVN perfusion rates.
Although one must be cautious when directly extrapolating in vitro findings to in vivo conditions, our results may have significant clinical implications. First of all, they show that data from a single biorheological measurement may be misleading and induce inappropriate conclusions with regard to pathophysiology and ensuing therapeutic concepts. In the present study, ektacytometric RBC elongation suggested that isoosmolar conditions yielded best results and that even moderate deviations in osmolality should be avoided. On the other hand, suspension viscosity showed that not isoosmolar, but hyperosmolar conditions would be beneficial, indicating that for bulk viscosity hematocrit is more important than RBC deformability. Since viscosity determines blood flow in large vessels, it is tempting to speculate that some degree of plasma hyperosmolality could be beneficial for the macrocirculation and hypoosmolality would be detrimental. One has to keep in mind that not only blood cells, but also endothelial cells undergo swelling when exposed to a hypotonic solution, which would additionally increase flow resistance.29 The concept of a beneficial effect of hyperosmolality is corroborated by in vivo studies showing that hypertonic solutions improve cardiac function in children after open-heart surgery30 and improve the outcome after hemorrhagic shock.31-34
Conclusions
The marked effect of osmolality on RBC deformability and suspension viscosity are in contrast to microvascular network perfusion, which changed only by a few percent in an osmolality range from 200 to 400 mOsm/kg H2O. An appropriate perfusion of the microcirculation is pivotal for any organ function. The newly available AMVN is probably the best and most comprehensive way to analyze RBC flow in the microcirculation in vitro. Our results show that the microcirculation is relatively inert to changes in osmolality. This finding is physiologically and clinically relevant, because it explains how adequate organ perfusion could be maintained even under relatively harsh conditions such as in severe dehydration.
Highlights.
Osmolality changed red cell shape, volume, intracellular hemoglobin concentration.
Bulk viscosity of red cell suspensions was minimized in hyperosmotic conditions.
Both hypo- and hyperosmolality markedly decreased red blood cell deformability.
Osmolality had a minor effect on perfusion of an artificial microvascular network.
Our data corroborates the beneficial effect of hyperosmolality observed clinically.
Acknowledgements
We thank Pamela Furlong, AO Research Institute, Davos, Switzerland for the scanning electron micrographs. This work has been supported by a 2012 NIH Director's Transformative Research Award (NHLBI R01HL117329, PI: Shevkoplyas).
Footnotes
Publisher's Disclaimer: This is a PDF file of an unedited manuscript that has been accepted for publication. As a service to our customers we are providing this early version of the manuscript. The manuscript will undergo copyediting, typesetting, and review of the resulting proof before it is published in its final citable form. Please note that during the production process errors may be discovered which could affect the content, and all legal disclaimers that apply to the journal pertain.
Statement of Competing Financial Interests
All authors report no potential conflicts of interest.
References
- 1.Reynolds RM, Padfield PL, Seckl JR. Disorders of sodium balance. Bmj. 2006;332:702–705. doi: 10.1136/bmj.332.7543.702. [DOI] [PMC free article] [PubMed] [Google Scholar]
- 2.Danziger J, Zeidel ML. Osmotic Homeostasis. Clinical journal of the American Society of Nephrology : CJASN. 2014 doi: 10.2215/CJN.10741013. [DOI] [PMC free article] [PubMed] [Google Scholar]
- 3.Arieff AI. Hyponatremia, convulsions, respiratory arrest, and permanent brain damage after elective surgery in healthy women. The New England journal of medicine. 1986;314:1529–1535. doi: 10.1056/NEJM198606123142401. [DOI] [PubMed] [Google Scholar]
- 4.Kumar S, Berl T. Sodium. Lancet. 1998;352:220–228. doi: 10.1016/S0140-6736(97)12169-9. [DOI] [PubMed] [Google Scholar]
- 5.Klein L, O'Connor CM, Leimberger JD, Gattis-Stough W, Pina IL, Felker GM, Adams KF, Jr., Califf RM, Gheorghiade M, Investigators O-C. Lower serum sodium is associated with increased short-term mortality in hospitalized patients with worsening heart failure: results from the Outcomes of a Prospective Trial of Intravenous Milrinone for Exacerbations of Chronic Heart Failure (OPTIME-CHF) study. Circulation. 2005;111:2454–2460. doi: 10.1161/01.CIR.0000165065.82609.3D. [DOI] [PubMed] [Google Scholar]
- 6.Ellis SJ. Severe hyponatraemia: complications and treatment. QJM : monthly journal of the Association of Physicians. 1995;88:905–909. [PubMed] [Google Scholar]
- 7.Shah MK, Workeneh B, Taffet GE. Hypernatremia in the geriatric population. Clinical interventions in aging. 2014;9:1987–1992. doi: 10.2147/CIA.S65214. [DOI] [PMC free article] [PubMed] [Google Scholar]
- 8.McManus ML, Churchwell KB, Strange K. Regulation of cell volume in health and disease. The New England journal of medicine. 1995;333:1260–1266. doi: 10.1056/NEJM199511093331906. [DOI] [PubMed] [Google Scholar]
- 9.Manley GT, Fujimura M, Ma T, Noshita N, Filiz F, Bollen AW, Chan P, Verkman AS. Aquaporin-4 deletion in mice reduces brain edema after acute water intoxication and ischemic stroke. Nature medicine. 2000;6:159–163. doi: 10.1038/72256. [DOI] [PubMed] [Google Scholar]
- 10.Gallagher PG. Disorders of red cell volume regulation. Current opinion in hematology. 2013;20:201–207. doi: 10.1097/MOH.0b013e32835f6870. [DOI] [PubMed] [Google Scholar]
- 11.Reinhart WH, Chien S. Roles of cell geometry and cellular viscosity in red cell passage through narrow pores. The American journal of physiology. 1985;248:C473–479. doi: 10.1152/ajpcell.1985.248.5.C473. [DOI] [PubMed] [Google Scholar]
- 12.Reinhart SA, Schulzki T, Bonetti PO, Reinhart WH. Studies on metabolically depleted erythrocytes. Clin Hemorheol Microcirc. 2014;56:161–173. doi: 10.3233/CH-131682. [DOI] [PubMed] [Google Scholar]
- 13.Deuel JW, Lutz HU, Misselwitz B, Goede JS. Asymptomatic elevation of the hyperchromic red blood cell subpopulation is associated with decreased red cell deformability. Annals of hematology. 2012;91:1427–1434. doi: 10.1007/s00277-012-1467-5. [DOI] [PubMed] [Google Scholar]
- 14.Burns JM, Yang X, Forouzan O, Sosa JM, Shevkoplyas SS. Artificial microvascular network: a new tool for measuring rheologic properties of stored red blood cells. Transfusion. 2012;52:1010–1023. doi: 10.1111/j.1537-2995.2011.03418.x. [DOI] [PubMed] [Google Scholar]
- 15.Sosa JM, Nielsen ND, Vignes SM, Chen TG, Shevkoplyas SS. The relationship between red blood cell deformability metrics and perfusion of an artificial microvascular network. Clin Hemorheol Microcirc. 2014;57:275–289. doi: 10.3233/CH-131719. [DOI] [PMC free article] [PubMed] [Google Scholar]
- 16.Forouzan O, Yang X, Sosa JM, Burns JM, Shevkoplyas SS. Spontaneous oscillations of capillary blood flow in artificial microvascular networks. Microvasc Res. 2012;84:123–132. doi: 10.1016/j.mvr.2012.06.006. [DOI] [PubMed] [Google Scholar]
- 17.Shevkoplyas SS, Yoshida T, Gifford SC, Bitensky MW. Direct measurement of the impact of impaired erythrocyte deformability on microvascular network perfusion in a microfluidic device. Lab Chip. 2006;6:914–920. doi: 10.1039/b601554a. [DOI] [PubMed] [Google Scholar]
- 18.Evans E, Fung YC. Improved measurements of the erythrocyte geometry. Microvasc Res. 1972;4:335–347. doi: 10.1016/0026-2862(72)90069-6. [DOI] [PubMed] [Google Scholar]
- 19.Canham PB. The minimum energy of bending as a possible explanation of the biconcave shape of the human red blood cell. Journal of theoretical biology. 1970;26:61–81. doi: 10.1016/s0022-5193(70)80032-7. [DOI] [PubMed] [Google Scholar]
- 20.Eskelinen S, Saukko P. Effects of glutaraldehyde and critical point drying on the shape and size of erythrocytes in isotonic and hypotonic media. Journal of microscopy. 1983;130:63–71. doi: 10.1111/j.1365-2818.1983.tb04198.x. [DOI] [PubMed] [Google Scholar]
- 21.Tran-Son-Tay R, Sutera SP, Rao PR. Determination of red blood cell membrane viscosity from rheoscopic observations of tank-treading motion. Biophys J. 1984;46:65–72. doi: 10.1016/S0006-3495(84)83999-5. [DOI] [PMC free article] [PubMed] [Google Scholar]
- 22.Dodson WR, 3rd, Dimitrakopoulos P. Tank-treading of swollen erythrocytes in shear flows. Physical review E, Statistical, nonlinear, and soft matter physics. 2012;85:021922. doi: 10.1103/PhysRevE.85.021922. [DOI] [PMC free article] [PubMed] [Google Scholar]
- 23.Schmid-Schonbein H, Wells R. Rheological consequences of osmotic red cell crenation. Pflugers Archiv : European journal of physiology. 1969;307:59–69. doi: 10.1007/BF00589459. [DOI] [PubMed] [Google Scholar]
- 24.Watson P, Maughan RJ. Artifacts in plasma volume changes due to hematology analyzer-derived hematocrit. Medicine and science in sports and exercise. 2014;46:52–59. doi: 10.1249/MSS.0b013e3182a0537b. [DOI] [PubMed] [Google Scholar]
- 25.Mlekoday HJ, Moore R, Levitt DG. Osmotic water permeability of the human red cell. Dependence on direction of water flow and cell volume. The Journal of general physiology. 1983;81:213–220. doi: 10.1085/jgp.81.2.213. [DOI] [PMC free article] [PubMed] [Google Scholar]
- 26.Staubli M, Roessler B, Straub PW. Fluid trapping of erythrocytes under hypoosmolar conditions. Blut. 1987;54:239–245. doi: 10.1007/BF00594200. [DOI] [PubMed] [Google Scholar]
- 27.Clark MR, Mohandas N, Shohet SB. Osmotic gradient ektacytometry: comprehensive characterization of red cell volume and surface maintenance. Blood. 1983;61:899–910. [PubMed] [Google Scholar]
- 28.Nemeth N, Kiss F, Klarik Z, Miko I. Comparative osmotic gradient ektacytometry data on inter-species differences of experimental animals. Clin Hemorheol Microcirc. 2014;57:1–8. doi: 10.3233/CH-2012-1620. [DOI] [PubMed] [Google Scholar]
- 29.Overbeck HW, Pamnani MB. Vascular responses to plasma hypoosmolality in man. Proceedings of the Society for Experimental Biology and Medicine Society for Experimental Biology and Medicine. 1975;150:331–336. doi: 10.3181/00379727-150-39030. [DOI] [PubMed] [Google Scholar]
- 30.Schroth M, Plank C, Meissner U, Eberle KP, Weyand M, Cesnjevar R, Dotsch J, Rascher W. Hypertonic-hyperoncotic solutions improve cardiac function in children after open-heart surgery. Pediatrics. 2006;118:e76–84. doi: 10.1542/peds.2005-2795. [DOI] [PubMed] [Google Scholar]
- 31.Zakaria el R, Tsakadze NL, Garrison RN. Hypertonic saline resuscitation improves intestinal microcirculation in a rat model of hemorrhagic shock. Surgery. 2006;140:579–587. doi: 10.1016/j.surg.2006.05.015. discussion 587-578. [DOI] [PMC free article] [PubMed] [Google Scholar]
- 32.Coimbra R, Hoyt DB, Junger WG, Angle N, Wolf P, Loomis W, Evers MF. Hypertonic saline resuscitation decreases susceptibility to sepsis after hemorrhagic shock. J Trauma. 1997;42:602–606. doi: 10.1097/00005373-199704000-00004. discussion 606-607. [DOI] [PubMed] [Google Scholar]
- 33.Angle N, Hoyt DB, Coimbra R, Liu F, Herdon-Remelius C, Loomis W, Junger WG. Hypertonic saline resuscitation diminishes lung injury by suppressing neutrophil activation after hemorrhagic shock. Shock. 1998;9:164–170. doi: 10.1097/00024382-199803000-00002. [DOI] [PubMed] [Google Scholar]
- 34.Gonzalez EA, Kozar RA, Suliburk JW, Weisbrodt NW, Mercer DW, Moore FA. Hypertonic saline resuscitation after mesenteric ischemia/reperfusion induces ileal apoptosis. J Trauma. 2005;59:1092–1098. doi: 10.1097/01.ta.0000188935.66504.00. [DOI] [PubMed] [Google Scholar]


