

Abstract
Adult studies have shown that a basic property of resting-state (RS) brain activity is the coupling of posterior alpha oscillations (alpha phase) to posterior gamma oscillations (gamma amplitude). The present study examined whether this basic RS process is present in children. Given reports of abnormal parietal–occipital RS alpha in children with autism spectrum disorder (ASD), the present study examined whether RS alpha-to-gamma phase-amplitude coupling (PAC) is disrupted in ASD. Simulations presented in this study showed limitations with traditional PAC analyses. In particular, to avoid false-positive PAC findings, simulations showed the need to use a unilateral passband to filter the upper frequency band as well as the need for longer epochs of data. For the human study, eyes-closed RS magnetoencephalography data were analyzed from 25 children with ASD and 18 typically developing (TD) children with at least 60 sec of artifact-free data. Source modeling provided continuous time course data at a midline parietal–occipital source for PAC analyses. Greater alpha-to-gamma PAC was observed in ASD than TD (p<0.005). Although children with ASD had higher PAC values, in both groups gamma activity increased at the peak of the alpha oscillation. In addition, an association between alpha power and alpha-to-gamma PAC was observed in both groups, although this relationship was stronger in ASD than TD (p<0.05). Present results demonstrated that although alpha-to-gamma PAC is present in children, this basic RS process is abnormal in children with ASD. Finally, simulations and the human data highlighted the need to consider the interplay between alpha power, epoch length, and choice of signal processing methods on PAC estimates.
Key words: : alpha, autism spectrum disorder, cross-frequency coupling, magnetoencephalography, phase-amplitude coupling, resting-state
Introduction
An emerging hypothesis posits that autism spectrum disorder (ASD) involves neural synapse excitatory and inhibitory imbalances, with these imbalances resulting in abnormal neural network activity (Collins et al., 2006). Electroencephalography (EEG) and magnetoencephalography (MEG) are well suited to noninvasively study the behavior of neuronal assemblies. Using EEG and MEG, resting-state (RS) and auditory evoked oscillatory abnormalities have been reported in ASD across multiple frequency bands, including delta (1–4 Hz), theta (4–8 Hz), alpha (8–12 Hz), beta (12–30 Hz), and gamma (>30 Hz) (Cantor et al., 1986; Orekhova et al., 2007; Rojas et al., 2008; Wilson et al., 2007). Using source localization to examine the activity in brain space, Cornew and colleagues (2012) reported greater RS alpha- and gamma-band power in ASD versus typically developing (TD) controls in the parietal and occipital regions.
Beyond single-frequency assessments of oscillatory activity, a recently developed functional connectivity measure termed cross-frequency coupling (CFC) provides insight into how local neural networks process information through the interaction or coupling of activity across frequencies. Phase-amplitude coupling (PAC) is a type of CFC where the phase of low-frequency activity (e.g., alpha) modulates the amplitude of high-frequency activity (e.g., gamma). PAC has been observed in multiple brain regions under a variety of conditions (Axmacher et al., 2010; Handel and Haarmeier, 2009; Sauseng et al., 2008). Examining eyes-closed RS sensor data, Osipova and colleagues (2008) showed that gamma-band power was locked to alpha-band phase, with the strongest PAC relationships in the occipital areas. The above as well as many other studies indicate that fast gamma oscillations originate from a network of neurons whose excitability is modulated by a slower alpha rhythm.
Given the abnormal RS alpha and gamma oscillatory activity in ASD previously observed, this study hypothesized that alpha-to-gamma PAC is altered in ASD (Cornew et al., 2012). The present study focused on RS PAC in midline parietal–occipital cortex because this cortical region is close to the large concentration of RS alpha generators in the calcarine cortex (Huang et al., 2014; Salmelin and Hari, 1994). In addition, Cornew and colleagues (2012) showed RS alpha and gamma power abnormalities in this region in children with ASD.
In the present study, simulations were performed before the ASD and TD analyses to demonstrate the limitations of assessing local PAC across a range of frequencies using published PAC methods (Berman et al., 2012; Canolty et al., 2006). These simulations motivated modifications to the ASD and TD PAC analyses and also verified minimum epoch length requirements. In particular, simulations showed the need to apply an asymmetric passband to the high-frequency signal of interest to avoid false-positive PAC estimates and, as in previous PAC publications (Penny et al., 2008a; Tort et al., 2010), simulations confirmed the need for longer epochs to accurately estimate PAC. The simulation findings were applied to a population study of RS alpha–gamma PAC, offering potential for neurobiological insight into RS abnormalities in ASD.
Materials and Methods
Simulated time courses
Simulations investigated the impact of filter design and epoch length on PAC. Brain signals with PAC were simulated using the Matlab (MathWorks) according to Equation (1a–c), with constant amplitude of 1 and constant modulation depth of 0.5. The phases, φ1 and φ2, were set to zero. The SAM(t) function was the amplitude modulated high-frequency signal with carrier frequency fc and modulation frequency fm. SLF(t) was the low-frequency modulation signal. Ssim(t) was the sum of SAM(t), SLF(t), and a pink noise signal, n(t), with a power spectrum of 1/f.
 |
 |
 |
In the present study, simulated signals had a sample rate of 500 Hz and were 120 sec in duration.
Computation of PAC
The estimate of PAC published by Tort and colleagues (2010) was implemented in the Matlab. In particular, the broad-band time-domain source signal was bandpass filtered into two frequency bands of interest: a low-frequency and a high-frequency signal. A Hilbert transform provided the time-varying phase of the low-frequency signal and the time-varying amplitude of the high-frequency signal. A composite source signal was next formed using the phase time course of the low-frequency signal and the amplitude time course of the high-frequency signal. This composite signal was then used to measure the dependence of the amplitude of the high-frequency signal on the phase of the low-frequency signal, computed as the modulation index (MI). The MI measures deviation of the amplitude-phase histogram from a uniform distribution. The underlying assumption is that if the amplitude-phase histogram has a distinct peak, then there is a relationship between the high-frequency signal's amplitude and the low-frequency signal's phase.
To examine coupling between multiple frequency pairs, comodulograms examined PAC (i.e., MI values) between the phase of low-frequency signals (2–20 Hz in 1 Hz steps) and the amplitude of high-frequency signals in 5 Hz steps. The comodulogram indicates the level of coupling between low-frequency phase and high-frequency amplitude pairs, with the abscissa representing the modulating frequency and the ordinate representing the amplitude-modulated frequency. The comodulogram color coding indicates the magnitude of MI values. As discussed in a prior work, the modulating frequency must be lower than the amplitude modulated frequency (Berman et al., 2012).
To compute MI values, the high-frequency amplitude modulated signal was filtered using a variable bandwidth filter because an overly narrow fixed high-frequency bandwidth can destroy amplitude modulation, resulting in false-negative PAC (Berman et al., 2012). To overcome this limitation, a double sideband (DSB) variable bandwidth filter approach was adopted as previously described (Berman et al., 2012). The DSB passband uses a variable bandwidth of 2*fm to ensure coverage of the center frequency (fc) and the two amplitude-modulation sidebands (Table 1). The present study also demonstrated an upper sideband (USB) variable bandwidth filter method. The USB approach passes only fc and the upper sideband (Table 1). The USB approach has a lower passband cutoff at fc−2 Hz to ensure the inclusion of the carrier frequency in the passband. As detailed in the Results, the USB approach was motivated by an artifact observed in the simulations, where the high-frequency passband included the low-frequency modulating frequency paired with the higher frequency. For DSB and USB filtering, the transition bands were 20% of the cutoff frequencies. The low-frequency signal was filtered with a constant bandwidth of 1 Hz with 10% transition bands.
Table 1.
Passband Limits for the Filters
| Passband definition | ||
|---|---|---|
| Filter type | Lower limit | Upper limit |
| DSB | fc−fm | fc+fm |
| USB | fc−2 Hz | fc+fm |
The variable fm is the modulating phase frequency and fc the carrier frequency.
DSB, double sideband; USB, upper sideband.
Population study
Participants included 26 children with ASD [mean age=9.5, standard deviation (SD)=2.2] and 22 TD children (mean age=10.5, SD=2.4). This population overlaps with the subjects reported in Cornew and colleagues (2012). Assessments were performed by a licensed child psychologist with expertise in ASD (Cornew et al., 2012). Given the extensive clinical evaluations upon which the original ASD diagnosis was made, an abbreviated diagnostic battery at the time of MEG confirmed the original diagnosis in the ASD group and ruled out ASD in the TD children. Specifically, diagnostic classification was made using the Autism Diagnostic Observation Schedule (ADOS) and parent report on the Social Communication Questionnaire (SCQ) (Lord et al., 2000; Rutter et al., 2003). Inclusion criteria for the TD control children included scoring below the cutoff for ASD on the ADOS as well as on parent questionnaires. To rule out global cognitive delay, all subjects scored at or above the fifth percentile (SS>75) on the Perceptual Reasoning Index (PRI) of the Wechsler Intelligence Scale for Children-IV (WISC-IV) (Wechsler, 2003). Per parent report, TD subjects also had never been diagnosed with the following: developmental delay, mental retardation, speech/language disorder/delay, communication disorder, language-based or other learning disability, attention deficit hyperactivity disorder (ADHD), or psychiatric conditions, including bipolar disorder, obsessive compulsive disorder, schizophrenia, conduct disorder, depression, or anxiety disorder.
Given known associations between psychotropic medications and electrophysiological brain activity, all subjects included in this study were medication-free (Blume, 2006). Parental report of medication use was obtained during the initial phone screening and again at the study visit to confirm that participants were medication-free from the time of recruitment and that their medication-free status had not changed between the phone screen and study visit.
The study was approved by the Institutional Review Board and all participants' families gave written informed consent. As indicated by institutional policy, where competent to do so, children over the age of seven additionally gave verbal assent.
MEG acquisition
Data were collected using a 275-channel MEG system (VSM MedTech, Inc.). Children were scanned in a supine position and were instructed to lie still with their eyes gently closed during a 2-min RS exam. Three head-position indicator coils were attached to the scalp and foam wedges inserted between the side of the participant's head and the inside of the dewar to ensure immobility. The electro-oculogram (EOG; bipolar oblique, upper right and lower left sites) was collected to ensure that the participants' eyes remained closed throughout the 2-min exam. Recording with a bandpass filter (0.03–150 Hz), EOG and MEG signals were digitized at 1200 Hz with third-order gradiometer environmental noise reduction and down-sampled to 500 Hz.
A three-step process removed muscle and movement artifact. First, participants' raw EOG data were visually examined and MEG epochs contaminated by blinks, saccades, or other significant EOG activity were removed. Second, blind to diagnosis, participants' MEG data were visually inspected for muscle-related activity and data containing muscle activity removed. Third, any additional artifacts were rejected by magnetic field amplitude and sample-sample gradient criteria (amplitude 1200 fT/cm, gradients 4800 fT/cm/sample).
As detailed in the Results section, simulations showed that a minimum of 60 sec of data were needed to obtain stable PAC estimates. As such, four controls and one child with ASD with <60 sec of artifact-free data were excluded. Examining the remaining subjects, there was no significant difference (p>0.4) in epoch length between the ASD group (mean: 85.6 sec, SD: 16.8 sec) and the control group (mean: 88.9 sec, SD: 9.9 sec).
As PAC estimates based on scalp indices (i.e., EEG electrodes or MEG sensors) likely reflect the superposition of activity from multiple brain areas, assessment of functional connectivity is optimally performed in source rather than sensor space (Hoechstetter et al., 2004; Nunez, 1997). MEG data were processed using the BESA 5.2 (MEGIS Software GmbH). To decompose the 275 channel MEG data, a source model with 15 regional sources was applied to project each individual's raw MEG surface data into the brain source space where the waveforms are the modeled source activities (Cornew et al., 2012; Scherg et al., 2002). These regional sources are not intended to correspond to precise neuroanatomical structures, but rather to represent neural activity at coarsely defined regions and to provide measures of brain activity with better signal separation and with a greater signal-to-noise ratio than would be afforded at the sensor level. The locations of the regional sources in the model are such that there is an approximately equal distance between sources (>3 cm), helping to separate signals originating from different brain regions.
RS PAC was examined at a midline parietal–occipital regional source (Fig. 1). This strategy was consistent with the findings of Osipova and colleagues (2010) who found that posterior RS alpha-to-gamma PAC was adequately modeled by a single parietal–occipital source. To obtain a single time course, the parietal–occipital regional source orientation containing the majority of the RS alpha power was identified. The source time-course associated with this optimized dipole orientation was used for PAC analyses. As an internal control, PAC measures and group differences at a midline frontal source were also computed (Fig. 1), with the hypothesis that alpha-gamma PAC would not be observed in frontal regions given the low frontal RS alpha activity.
FIG. 1.
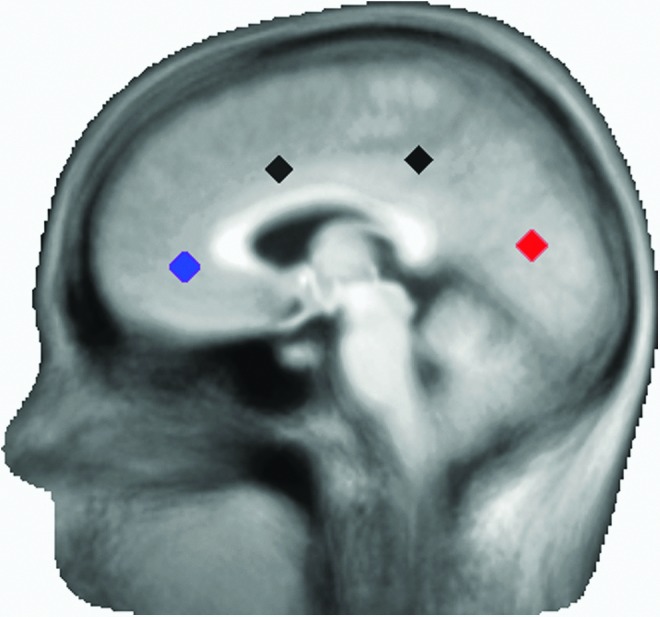
Positions of the parietal–occipital (red) and frontal (blue) sources. A total of 15 sources throughout the brain were included in the source model. Two of the unexamined sources are shown (black).
Epoch lengths of 10, 30, 60 sec, and the maximum length available were examined. As previously noted, all subjects were required to have a minimum of 60 sec of artifact-free data. Population statistics were performed on the comodulogram using t-tests. Given the large number of comparisons, results were familywise corrected using suprathreshold clustering and bootstrapping (Nichols and Holmes, 2002). For our sample size of 43 subjects, a t-value suprathreshold of 2.02 (p=0.05) was used. Permutations showed that a cluster size of four pixels, each with a p-value of 0.05 or less, provided a familywise corrected p=0.05. For frequency pairing where significant group differences were observed, Cohen's D statistic of effect size was calculated.
Results
Simulations
The USB and DSB approaches were first applied to a simulated dataset containing 10 Hz modulating 20 Hz PAC (first column, Fig. 2). As anticipated, both approaches detected 10 Hz modulating 20 Hz PAC. The USB and DSB approaches were next applied to a simulated dataset with 10 and 20 Hz activity, but no PAC (second column, Fig. 2). Whereas the DSB approach incorrectly identified 10 Hz modulating 20 Hz PAC, the USB approach correctly showed no PAC. The false-positive DSB finding (upper right panel, Fig. 2) occured because when filtering a high-frequency signal centered at 20 Hz, the DSB 10 to 30 Hz passband included both the 10 and 20 Hz signals. The summation of the 10 and 20 Hz signals created an artifactual 20 Hz time course amplitude modulated at 10 Hz. In effect, the 10 Hz signal acted as a sideband of the 20 Hz signal. The USB method did not allow such an error because the USB passband did not extend into the lower frequency signal.
FIG. 2.

Simulations showing modulation index (MI) values using a symmetric bandpass filter, including the lower and upper sidebands [double sideband (DSB); upper panel] or an asymmetric bandpass filter, including only the upper sideband (USB; lower panel). The DSB filter incorrectly showed phase-amplitude coupling (PAC) in the simulation with no PAC (upper right panel).
Simulations also examined the effect of epoch length on PAC using the adaptive filter USB approach. Figure 3 shows comodulograms from a simulated 10 Hz signal modulating a 40 Hz signal. Simulations were formed at two noise levels using a Gaussian distribution with variances of 0.1 (upper row) or 2.5 (bottom row) to generate pink noise. Epoch lengths of 10, 30, 60, and 120 sec were examined. As shown in the top row of Figure 3, when noise levels were low, comodulograms did not differ across the epoch length. As shown in the bottom row of Figure 3, with increased noise the comodulograms showed clear 10 Hz modulating 40 Hz PAC only at the longest 120 sec epoch. The 10 sec epoch length comodulogram was uninterpretable. False-positive findings were observed in the intermediate 30 and 60 sec epochs.
FIG. 3.

Comodulograms of simulated 10 Hz modulating 40 Hz at two different noise levels (rows) and four epoch lengths (columns). Simulations showed that the accuracy of estimating MI values increased with epoch length.
It is hypothesized that the false-positive MI findings in the lower signal-to-noise ratio (SNR) simulations are due to the fact that the phase-amplitude histograms used to compute the MI values show spurious peaks at short intervals and thus often spuriously high MI values. At longer epochs, the true phase-to-amplitude distribution was correctly sampled, resulting in a histogram that more closely approximated the true PAC. As shown in Figure 3, at shorter epochs, MI values are more accurately estimated as the phase frequency increases. For example, for a noise variance of 2.5 and epoch length of 60 sec, there is high variability and uncertainty in the comodulogram between frequencies for phase 5 and 8 Hz (Fig. 3, bottom row, 60 sec epoch). However, this background variability is diminished on the right side of the comodulogram. This is likely because the phase of the modulating signal changes more rapidly, allowing more samples at each phase value.
Examining Figure 3, it is of note that the simulated USB comodulograms showed two distinct regions of high alpha-to-gamma PAC. One peak was observed at ∼30 Hz (y axis) as the USB filter at 30 Hz included the 30 Hz lower side band and the 40 Hz center frequency. A second MI peak was observed at ∼40 Hz as the USB filter at 40 Hz included the 40 Hz center frequency and the USB at 50 Hz. For frequencies between these two peaks, the USB passband included only the center frequency signal and neither sideband, and thus produced low MI values. Although simulations showed the need for the USB to avoid false-positive errors, simulations also showed that the USB approach introduces some uncertainity in the true amplitude frequency of PAC.
ASD and TD group differences
Figure 4 shows the impact of filter design on the TD and ASD comodulograms along with the resultant group comparison statistic maps. In both the ASD and TD comodulograms the DSB filter (bottom row) produced a relatively high MI peak at 10 Hz modulating 15–20 Hz. This is likely a false-positive finding since the DSB filter allowed 10 Hz alpha activity to be included as a false sideband in the high-frequency filter band centered at 15 Hz. In the DSB statistics map, the 10 Hz modulating 15–20 Hz MI group difference on the raw t-map was likely due to the significantly increased alpha activity in ASD. This false positive on the raw t-map did not survive familywise correction in this study. The USB approach was robust to this artifact, showing a significant ASD greater than TD group difference only at 10 Hz modulating 40 Hz.
FIG. 4.

Comodulograms shown for typically developing (TD) and autism spectrum disorder (ASD) using the USB bandpass filter (upper row) and the DSB bandpass filters (lower row). Both the uncorrected raw t-maps and familywise corrected statistics maps are shown. Within the familywise corrected maps, each point in the significant cluster is colored to indicate the effect size (Cohen's d values).
Figure 5 shows the effect of varying epoch length on the TD and ASD comodulograms. Mirroring the simulations, shorter epochs showed variability in the comodulograms and what are likely false-positive MI values. The ASD group exhibited higher alpha-gamma PAC and similar cluster location for both 60 sec and maximum epoch group comparisions. Figure 6 shows the distribution of MI values for each group from the comodulogram group difference region of interest for the maximum epoch length. The ASD group shows significantly higher MI than the TD group (p<0.005). As seen in Figure 6, five ASD subjects have MI values>1 SD from the mean. This subset of ASD subjects did not have significantly different age, epoch length, or Social Responsiveness Scale values than the other ASD subjects (p's>0.2). This subset of five ASD subjects also did not completely overlap with the five ASD subjects with the highest alpha power.
FIG. 5.

Comodulograms shown for TD (left column) and ASD (center column) as a function of epoch length (rows). Similar to the simulations, the comodulograms at the shorter epoch lengths showed what are likely false-positive MI values. Familywise corrected statistics maps are shown (right column), with each voxel in the significant cluster showing effect size (color bar shows range of Cohen's d values).
FIG. 6.

Comodulogram statistics map (left), with scatterplot (right) showing the average MI values for each individual averaged over the cluster, where significant group differences were observed. Data are from the maximum epoch length available for each subject. Bars show the standard deviations.
As shown in Figure 7, the phase-amplitude composite histograms for TD and ASD showed that the highest gamma-band amplitudes were observed at 0° alpha phase, which corresponds to the peak of the alpha oscillation. This result indicated that although there were larger MI values in ASD versus TD, the pattern of phase-amplitude pairing was similar in both groups.
FIG. 7.

Gamma amplitude (fT) estimates as a function of alpha phase (degrees) for TD (left panel) and ASD (right panel). The largest amplitude values in both groups were observed at 0° at the alpha peak. The heavy line indicates the mean and the light lines the 95% confidence interval.
Alpha power (9–11 Hz), measured using the maximum data length at the parietal–occipital source, was higher in ASD versus TD (p<0.005). Gamma power (30–40 Hz) at this site did not differ between groups (p=0.4). Figure 8 shows associations between 9 and 11 Hz alpha power and MI within the identified group-difference cluster. A linear regression with alpha-to-gamma MI as the dependent variable and alpha power, group, and a power×group interaction term as independent variables showed a main effect indicating an association between alpha power and MI in both groups (p<0.01), as well as a significant interaction showing that the association was stronger in ASD than TD (p<0.05; Fig. 8).
FIG. 8.

In the cluster where group differences were observed (Fig. 6), scatterplots (and associated linear fits) show associations between alpha power and MI values separately for TD (green) and ASD (red).
Finally, to examine the specificity of the parietal–occipital MI findings, comodulograms were computed from a frontal-midline regional source, a location with low RS alpha power. As shown in Figure 9, no significant group MI differences were observed at this frontal location.
FIG. 9.

Comodulograms for TD (left) and ASD (center) from a midline-frontal source. The associated statistics map (right) for a midline-frontal source shows no MI group differences.
Discussion
In adults, gamma power (30–80 Hz) is coupled to the phase of alpha activity (8–13 Hz) in an eyes-closed RS condition (Osipova et al., 2008). The present study extended these findings by showing RS alpha-to-gamma PAC in children and adolescents, thus demonstrating that these local neural circuits are already developed in children 6 years and older. The present study also showed that these neural circuits are abnormal in ASD, with greater parietal–occipital alpha-to-gamma PAC in ASD versus TD. Finally, as detailed below, the present study demonstrated an interplay between alpha power, epoch length, and choice of signal processing method on PAC estimates, indicating the importance of considering these factors when estimating PAC and assessing PAC group differences.
Analogous to Osipova and colleagues (2008), subjects with stronger alpha showed larger MI values. As shown in Figure 7, although both groups showed an association between greater alpha power and higher MI values, this association was stronger in the ASD than TD group. Given greater alpha power in ASD versus TD it is possible that higher amplitude and/or more continuous alpha activity may provide greater SNR in the ASD group and thus allow MI to be more accurately estimated. In such a case, present alpha-to-gamma MI group differences are mechanistically similar to the finding of abnormally increased alpha power in ASD. However, given that both groups showed an association between alpha power and MI, the higher MI values in ASD may instead reflect a true biological phenomenon, with increased alpha necessary for local networks to associate alpha phase to gamma amplitude. If a biological phenomenon, the larger 10–40 Hz MI values observed in ASD would indicate a cross-frequency neural circuit abnormality in ASD. Of note, although PAC may be abnormally increased in ASD, present findings showed that in both ASD and TD groups increased gamma power was observed at the peaks of the alpha oscillation. Future study of the dependence or independence of alpha power and PAC are warranted. Further studies with higher numbers may also test for the presence of PAC subtypes within the heterogeneous ASD population.
In future studies it may be possible to obtain data that will allow more precise claims about group PAC differences. VanRullen and Koch (2003) postulated that alpha and nested gamma cycles produce discrete perceptions in which gamma waves contain the information of each snapshot, with the organization of the ensemble of snapshots mediated by the alpha waves. Although not specific to alpha, several studies in healthy controls show a relationship between low-frequency to gamma PAC and performance on a variety of tasks. Sauseng and colleagues (2008) observed that increased theta–gamma PAC was related to attending to a visual target. Axmacher and colleagues (2010) reported associations between PAC and working memory in humans, and delta–gamma PAC has been linked to the detection of weak sensory signals (Handel and Haarmeier, 2009). These studies suggest better signal detection as PAC increases. Prior studies have also reported that the coupling frequency for gamma PAC is modulated by behavioral state and location on the cortex (Voytek et al., 2010). The current study was motivated by a specific hypothesis concerning alpha–gamma PAC in midline parietal–occipital cortex, however, abnormal theta–gamma PAC in ASD elsewhere in the brain cannot be ruled out.
There is literature to support a hypothesis of higher alpha-to-gamma PAC associated with better signal detection in ASD, including studies showing that individuals with ASD are faster and more accurate than neurotypical individuals at locating a figure hidden within a line drawing (Jolliffe and Baron-Cohen, 1997) and also at finding target stimuli presented among multiple other items in visual search tasks (O'Riordan, 2004; O'Riordan et al., 2001; Plaisted et al., 1998). A recent study showed that under higher levels of visual load, adults with ASD have enhanced perceptual capacity, leading to superior performance and increased distractor processing on a visual signal-detection paradigm (Remington et al., 2012). Such findings would be consistent with the present results. However, given that RS alpha sometimes reflects an inhibitory rather than an excitatory role, increased RS alpha and thus perhaps increased RS alpha-to-gamma PAC may reflect processes distinct from task-related PAC (Klimesch, 2012).
Abnormal alpha-to-gamma PAC in ASD during a task has been observed in a previous study. In particular, Khan and colleagues (2013) reported that adolescents with ASD failed to show an increase in fusiform face area alpha-to-gamma PAC during an emotional face-viewing task. Although the present and Khan and colleagues (2013) studies both indicate abnormal local functional connectivity as measured by alpha-to-gamma PAC in ASD, the present study indicated increased local connectivity, and the Khan and colleagues (2013) indicated decreased local connectivity. Study differences could be due to differences in RS versus task-related PAC activity (and perhaps also differences in age and brain regions examined). Further studies replicating the present and the Khan and colleagues (2013) findings in children with and without ASD are of interest, as are studies examining associations between RS PAC and task-related PAC. In these studies it would also be important to determine if there are associations between PAC and task performance in the absence of associations between alpha power to determine if alpha power and PAC can be dissociated.
Regarding the technical aspects of the study, the present study showed the advantages of using an asymmetric bandpass when filtering the high-frequency signal and the need for relatively long epochs of data. An asymmetric bandpass filter prevents false positives by including the upper, but not lower sideband of the modulated high-frequency signal of interest frequency. A symmetric bandpass will incorrectly identify PAC if the difference between the high and low frequencies is less than the low frequency. As shown in Figures 2 and 4, with a symmetric bandpass there is a chance that activity from the low-frequency modulating signal will bleed into the high-frequency signal of interest, resulting in false-positive PAC. This false positive could potentially result in incorrect group differences as seen in the raw t-map of Figure 4.
This type of false-positive artifact reveals fundamental limits on local CFC analyses. In particular, the measured time course of neural activity within a particular brain area contains signal from multiple neuronal assemblies, with this activity superimposed in the source time course. To detect local CFC, the neuronal assemblies must be separated by frequency since they are not separated in space. In contrast, long range CFC does not suffer this problem because the coupled signals can be independently measured. The USB filtering strategy seeks to separate the local low-frequency signal from the local higher frequency signal as two distinct neuronal assemblies so that CFC can be accurately measured. Although the use of a USB is necessary, especially when examining PAC near the diagonal of the comodulogram, simulations and real data also reveal a limitation in the use of asymmetric bandpass filters when computing MI values. Simulations showed that when there is real PAC, the USB filter artifactually shifted this activity into lower frequencies, shown in Figure 3 as the ∼10 to ∼30 Hz MI peak in the comodulogram. This limitation will, in certain instances, create ambiguity as to where PAC really occurs. Interpretation of comodulograms must take into account the poor frequency resolution along the amplitude frequency axis and thus PAC within a given modulating frequency band should be interpreted to exist within a range rather than at a discrete frequency.
In agreement with previous PAC investigations the present study showed the dependence of MI measures on epoch length (Penny et al., 2008b). Tort and colleagues (2010) noted that given signals with relatively low noise (e.g., corticography recordings), if a brain signal is a perfect periodic function possessing no noise component, the amount of PAC can be inferred from an epoch as short as a full cycle of the low-frequency fm rhythm. For EEG and MEG recordings such low noise levels are less likely, requiring long recording to obtain accurate MI values. This is especially true for RS data as the magnitude of RS alpha activity is generally nonstationary. Finally, as shown in this study and also noted in Tort and colleagues (2010), the needed epoch length depends not only on noise, but also on the modulating frequency since slower oscillations have fewer cycles sampled than faster oscillations (Tort et al., 2010). As seen in Figures 3 and 5, as epoch length is decreased, the low phase frequencies are the first to present false positives.
A limitation of the preset study is that only 2-min of eyes-closed RS data were obtained. After removing MEG data with artifact, some subjects had <1 min of eyes-closed data. These subjects were not included in the between-group analyses. Given that the simulations indicated that PAC is less reliably estimated with short epochs, in future studies it will be important to obtain sufficient data so that at least 2 min of artifact-free data is available in all subjects.
To conclude, replicating prior studies examining alpha-to-gamma PAC in adults, the present study showed RS alpha-to-gamma PAC in TD children as well as in children with ASD. Although the present findings suggest abnormal RS alpha-to-gamma PAC in ASD, additional studies are needed to further support this claim. For example, additional studies with larger sample sizes would provide the opportunity to match subjects on alpha power and then determine whether ASD and TD still differ in PAC. A potential problem with this strategy, however, is that matching subjects on alpha power may result in a bias toward a subsample of the heterogeneous ASD spectrum with normal-appearing RS alpha. Observing associations between PAC and not alpha power on a signal-detection task might also further show that PAC is functionally unique. Finally, when examining local RS PAC across a range of frequencies, present findings show the need to apply an analyses protocol that applies an adaptive USB to the high-frequency signal of interest, and analyzing a long epoch of data to correctly sample the phase-to-amplitude histogram and thus compute valid MI measures.
Acknowledgments
This study was supported, in part, by NIH grant K01MH096091 (J.I.B.), R01DC008871 (T.P.L.R.), NIH grant K08 MH085100 (J.C.E.), NIH grant R21MH098204 (J.C.E.), and Award number P30HD026979 from the Eunice Kennedy Shriver National Institute of Child Health & Human Development of the NIH. Dr. Roberts acknowledges the Oberkircher Family for the Oberkircher Family Chair in Pediatric Radiology at CHOP.
Author Disclosure Statement
The authors have no commercial associations that might create a conflict of interest in connection with this work.
References
- Axmacher N, Henseler MM, Jensen O, Weinreich I, Elger CE, Fell J. 2010. Cross-frequency coupling supports multi-item working memory in the human hippocampus. Proc Natl Acad Sci U S A 107:3228–3233 [DOI] [PMC free article] [PubMed] [Google Scholar]
- Berman JI, McDaniel J, Liu S, Cornew L, Gaetz W, Roberts TP, Edgar JC. 2012. Variable bandwidth filtering for improved sensitivity of cross-frequency coupling metrics. Brain Connect 2:155–163 [DOI] [PMC free article] [PubMed] [Google Scholar]
- Blume WT. 2006. Drug effects on EEG. J Clin Neurophysiol 23:306–311 [DOI] [PubMed] [Google Scholar]
- Canolty RT, Edwards E, Dalal SS, Soltani M, Nagarajan SS, Kirsch HE, Berger MS, Barbaro NM, Knight RT. 2006. High gamma power is phase-locked to theta oscillations in human neocortex. Science 313:1626–1628 [DOI] [PMC free article] [PubMed] [Google Scholar]
- Cantor DS, Thatcher RW, Hrybyk M, Kaye H. 1986. Computerized EEG analyses of autistic children. J Autism Dev Disord 16:169–187 [DOI] [PubMed] [Google Scholar]
- Collins AL, Ma D, Whitehead PL, Martin ER, Wright HH, Abramson RK, Hussman JP, Haines JL, Cuccaro ML, Gilbert JR, Pericak-Vance MA. 2006. Investigation of autism and GABA receptor subunit genes in multiple ethnic groups. Neurogenetics 7:167–174 [DOI] [PMC free article] [PubMed] [Google Scholar]
- Cornew L, Roberts TP, Blaskey L, Edgar JC. 2012. Resting-state oscillatory activity in autism spectrum disorders. J Autism Dev Disord 42:1884–1894 [DOI] [PMC free article] [PubMed] [Google Scholar]
- Handel B, Haarmeier T. 2009. Cross-frequency coupling of brain oscillations indicates the success in visual motion discrimination. Neuroimage 45:1040–1046 [DOI] [PubMed] [Google Scholar]
- Hoechstetter K, Bornfleth H, Weckesser D, Ille N, Berg P, Scherg M. 2004. BESA source coherence: a new method to study cortical oscillatory coupling. Brain Topogr 16:233–238 [DOI] [PubMed] [Google Scholar]
- Huang MX, Huang CW, Robb A, Angeles A, Nichols SL, Baker DG, Song T, Harrington DL, Theilmann RJ, Srinivasan R, Heister D, Diwakar M, Canive JM, Edgar JC, Chen YH, Ji Z, Shen M, El-Gabalawy F, Levy M, McLay R, Webb-Murphy J, Liu TT, Drake A, Lee RR. 2014. MEG source imaging method using fast L1 minimum-norm and its applications to signals with brain noise and human resting-state source amplitude images. Neuroimage 84:585–604 [DOI] [PMC free article] [PubMed] [Google Scholar]
- Jolliffe T, Baron-Cohen S. 1997. Are people with autism and Asperger syndrome faster than normal on the Embedded Figures Test? J Child Psychol Psychiatry 38:527–534 [DOI] [PubMed] [Google Scholar]
- Khan S, Gramfort A, Shetty NR, Kitzbichler MG, Ganesan S, Moran JM, Lee SM, Gabrieli JD, Tager-Flusberg HB, Joseph RM, Herbert MR, Hamalainen MS, Kenet T. 2013. Local and long-range functional connectivity is reduced in concert in autism spectrum disorders. Proc Natl Acad Sci U S A 110:3107–3112 [DOI] [PMC free article] [PubMed] [Google Scholar]
- Klimesch W. 2012. Alpha-band oscillations, attention, and controlled access to stored information. Trends Cogn Sci 16: 606–617 [DOI] [PMC free article] [PubMed] [Google Scholar]
- Lord C, Risi S, Lambrecht L, Cook EH, Leventhal BL, DiLavore PC, Pickles A, Rutter M. 2000. The autism diagnostic observation schedule-generic: a standard measure of social and communication deficits associated with the spectrum of autism. J Autism Dev Disord 30:205–223 [PubMed] [Google Scholar]
- Nichols TE, Holmes AP. 2002. Nonparametric permutation tests for functional neuroimaging: a primer with examples. Hum Brain Mapp 15:1–25 [DOI] [PMC free article] [PubMed] [Google Scholar]
- Nunez P. 1997. EEG coherency I: statistics, reference electrode, volume conduction, Laplacians, cortical imaging, and interpretation at multiple scales. Electroencephalogr Clin Neurophysiol 103:499–515 [DOI] [PubMed] [Google Scholar]
- O'Riordan MA. 2004. Superior visual search in adults with autism. Autism 8:229–248 [DOI] [PubMed] [Google Scholar]
- O'Riordan MA, Plaisted KC, Driver J, Baron-Cohen S. 2001. Superior visual search in autism. J Exp Psychol Hum Percept Perform 27:719–730 [DOI] [PubMed] [Google Scholar]
- Orekhova EV, Stroganova TA, Nygren G, Tsetlin MM, Posikera IN, Gillberg C, Elam M. 2007. Excess of high frequency electroencephalogram oscillations in boys with autism. Biol Psychiatry 62:1022–1029 [DOI] [PubMed] [Google Scholar]
- Osipova D, Hermes D, Jensen O. 2008. Gamma power is phase-locked to posterior alpha activity. PLoS One 3:e3990. [DOI] [PMC free article] [PubMed] [Google Scholar]
- Osipova MA, Arkov VV, Tonevitsky AG. 2010. Modulation of alpha-rhythm and autonomic status of human by color photostimulation. Bull Exp Biol Med 149:759–762 [DOI] [PubMed] [Google Scholar]
- Penny D, White WT, Hendy MD, Phillips MJ. 2008a. A bias in ML estimates of branch lengths in the presence of multiple signals. Mol Biol Evol 25:239–242 [DOI] [PubMed] [Google Scholar]
- Penny WD, Duzel E, Miller KJ, Ojemann JG. 2008b. Testing for nested oscillation. J Neurosci Methods 174:50–61 [DOI] [PMC free article] [PubMed] [Google Scholar]
- Plaisted K, O'Riordan M, Baron-Cohen S. 1998. Enhanced visual search for a conjunctive target in autism: a research note. J Child Psychol Psychiatry 39:777–783 [PubMed] [Google Scholar]
- Remington AM, Swettenham JG, Lavie N. 2012. Lightening the load: perceptual load impairs visual detection in typical adults but not in autism. J Abnorm Psychol 121:544–551 [DOI] [PMC free article] [PubMed] [Google Scholar]
- Rojas DC, Maharajh K, Teale P, Rogers SJ. 2008. Reduced neural synchronization of gamma-band MEG oscillations in first-degree relatives of children with autism. BMC Psychiatry 8:66. [DOI] [PMC free article] [PubMed] [Google Scholar]
- Rutter M, Bailey A, Lord C. 2003. Social Communication Questionnaire (SCQ). Los Angeles, LA: Western Psychological Services [Google Scholar]
- Salmelin R, Hari R. 1994. Characterization of spontaneous MEG rhythms in healthy adults. Electroencephalogr Clin Neurophysiol 91:237–248 [DOI] [PubMed] [Google Scholar]
- Sauseng P, Klimesch W, Gruber WR, Birbaumer N. 2008. Cross-frequency phase synchronization: a brain mechanism of memory matching and attention. Neuroimage 40:308–317 [DOI] [PubMed] [Google Scholar]
- Scherg M, Ille N, Bornfleth H, Berg P. 2002. Advanced tools for digital EEG review: virtual source montages, whole-head mapping, correlation, and phase analysis. J Clin Neurophysiol 19:91–112 [DOI] [PubMed] [Google Scholar]
- Tort AB, Komorowski R, Eichenbaum H, Kopell N. 2010. Measuring phase-amplitude coupling between neuronal oscillations of different frequencies. J Neurophysiol 104:1195–1210 [DOI] [PMC free article] [PubMed] [Google Scholar]
- VanRullen R, Koch C. 2003. Is perception discrete or continuous? Trends Cogn Sci 7:207–213 [DOI] [PubMed] [Google Scholar]
- Voytek B, Canolty RT, Shestyuk A, Crone NE, Parvizi J, Knight RT. 2010. Shifts in gamma phase-amplitude coupling frequency from theta to alpha over posterior cortex during visual tasks. Front Hum Neurosci 4:191. [DOI] [PMC free article] [PubMed] [Google Scholar]
- Wechsler D. 2003. Wechsler Intelligence Scale for Children-Fourth Edition. Administration and Scoring Manual. San Antonio: Harcourt Assessment, Inc [Google Scholar]
- Wilson TW, Rojas DC, Reite ML, Teale PD, Rogers SJ. 2007. Children and adolescents with autism exhibit reduced MEG steady-state gamma responses. Biol Psychiatry 62:192–197 [DOI] [PMC free article] [PubMed] [Google Scholar]