Abstract
We demonstrate three-dimensional structural and functional retinal imaging with line-field parallel swept source imaging (LPSI) at acquisition speeds of up to 1 MHz equivalent A-scan rate with sensitivity better than 93.5 dB at a central wavelength of 840 nm. The results demonstrate competitive sensitivity, speed, image contrast and penetration depth when compared to conventional point scanning OCT. LPSI allows high-speed retinal imaging of function and morphology with commercially available components. We further demonstrate a method that mitigates the effect of the lateral Gaussian intensity distribution across the line focus and demonstrate and discuss the feasibility of high-speed optical angiography for visualization of the retinal microcirculation.
OCIS codes: (110.4500) Optical coherence tomography, (170.0110) Imaging systems, (170.3880) Medical and biological imaging, (170.4460) Ophthalmic optics and devices
1. Introduction
Since the advent of Optical Coherence Tomography (OCT) and the first demonstration of in vivo retinal imaging [1, 2], there has been a remarkable development in terms of acquisition speed, axial and lateral resolution and diagnostic specificity [3]. Researchers discovered the advantage of Fourier Domain OCT (FD OCT) in terms of speed and sensitivity as compared to Time Domain OCT (TD OCT) [4–6]. Others highlighted the importance of axial resolution [7–10] and transverse resolution [11,12] on the diagnostic impact of retinal assessment with OCT. The improvement in speed enabled by FD OCT was particularly remarkable: At a central wavelength of 840 nm, imaging speeds of 312 kA-scans/s [13] and 500 kA-scans/s [14] where reported using spectrometer based FD OCT. Lately, adaptive optics OCT at 1 MHz with a complex system of 4 interleaved high-speed spectrometers was demonstrated [15]. Recently, swept source OCT (SS OCT) utilizing vertical-cavity surface emitting lasers (VCSEL) at 1060 nm and 580 kHz was demonstrated in vivo [16]. The development of frequency-domain mode-locked (FDML) swept source lasers set the stage for retinal imaging at acquisition speeds exceeding 1 MA-scans/s [17–21] in the regime of 1050 nm and 1300 nm wavelength. The improvement in imaging speed supported functional extensions of OCT where dense sampling is required. The use of mode locked lasers enabled to perform wide field lable-free optical angiography (OA), a powerful method to assess the retinal microvasculature non-invasively [22–25] at acquisition speeds of 1.6 MHz [26]. However, ocular safety considerations strictly limit the maximum permissible exposure (MPE) for laser sources with small angular extent [27,28]. The maximum acquisition speed of point scanning OCT modalities is therefore ultimately linked to the maximum allowed power for a minimum required detection sensitivity, which in turn is proportional to the applied illumination power. Klein et al. for example estimated a minimum required sensitivity of 95 dB for clinical imaging at 1060nm center wavelength with a corresponding maximum A-scan rate of below 1 MHz [20]. Additionally, increasing imaging speed in point scanning setups necessitates growing system complexity and the utilization of sophisticated high-end technology. In particular, 1060 nm FDML sources operating at MHz sweeping rates are not yet commercially available. An alternative concept to point scanning OCT is parallel illumination of the sample with a line focus (line field OCT) or an extended field (full field OCT). Since the interferometric signal is recorded in parallel rather than sequentially, the technological system requirements are significantly relaxed. A further advantage of parallel OCT is the increased MPE for the static beam case, since the power on the cornea can be safely increased when considering extended illumination sources. Retinal imaging with full field OCT (FF OCT) employing a frequency swept source was demonstrated at a maximum acquisition speed of 1.5 MA-scans/s [29]. They pointed out, that for retinal imaging with parallel SS OCT the A-scan should be performed within less than 5ms, otherwise it will be strongly affected by axial and lateral motion artifacts. FF OCT completely gives up the confocal gating, which results in loss of structural contrast due to scattered light. Full Field OCT may additionally suffer from specular reflexes from bulk optics that increase noise and reduce dynamic range. LF OCT on the other hand still keeps half of the confocal gate. Spectrometer based LF OCT systems allow recording full spectral interference spectra of a B-scan in parallel in a single shot [30, 31]. However, they are affected by fringe wash-out and associated signal-to-noise (SNR) loss in case of axial motion. With spectrometer based line field OCT an acquisition speed of 51 kHz for 3D imaging and a detection sensitivity of 89 dB [32] has been achieved. Grajciar et al. reported a parallel FD OCT system based on line focus illumination achieving an equivalent two-dimensional (2D) acquisition speed of 256 kHz and a sensitivity of 89 dB [31]. Swept source based LF OCT in contrast has several advantages when compared to spectrometer based LF OCT: the strongly reduced sensitivity roll-off intrinsic for FD OCT is one. Another is the reduced scattering and signal cross talk due to the temporal separation of spectral sample points. With line-field swept source OCT an equivalent A-scan rate of 100 kA-scans/s has been reported showing significantly reduced influence of scattering crosstalk [33]. A detailed overview of different parallel OCT modalities can be found in a recent review of Drexler et al. [3]. However, the presented retinal images acquired so far suffered from spectral and spatial crosstalk due to the missing confocal gating and thus did not validate the theoretical sensitivity advantage of parallel OCT. Consequently, the image contrast, depth penetration, resolution and sensitivity was not yet competitive to respective point scanning modalities. This is mainly due to the fact, that spectrometer based line field OCT would need fast 2D sensors with small read-out time and line-field modalities based upon swept source lasers are currently limited by the sweeping duration and the frame rate of available linear sensors.
In the following we present retinal imaging with a line-field parallel swept source imaging (LPSI) modality, utilizing a commercially available swept source and line scan camera. Besides line-focus illumination and detection, we mitigate the necessity for high-speed sensor and laser technology by full-range imaging, which allows for increasing the imaging speed by low sampling of the optical spectrum [34–36]. Parallel OCT enables complex signal reconstruction based on tilting of the reference wavefront with respect to the sample wavefront, similar to off-axis holography [37–39]. We demonstrate in vivo structural and functional retinal assessment with acquisition rates and detection sensitivities of up to 1 MHz and 93.5 dB, respectively.
2. Methods
2.1 Setup
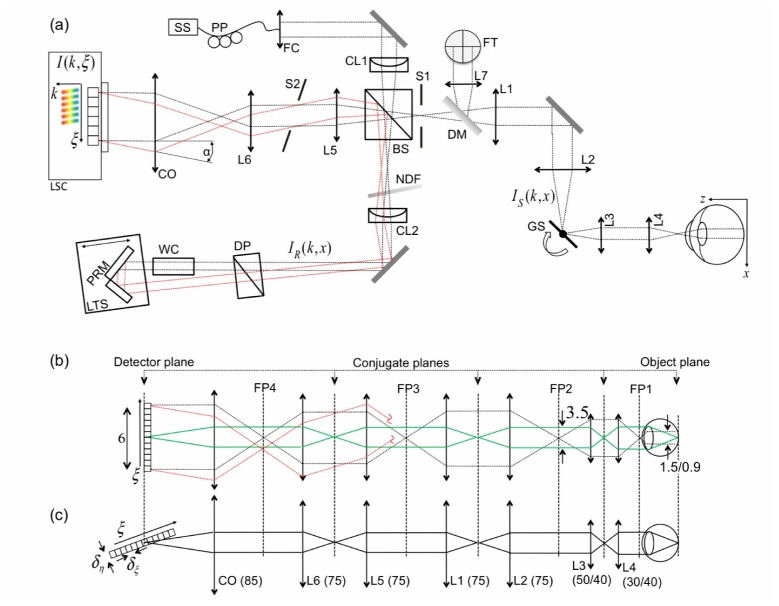
The setup of LPSI is based on the one presented in our previous work [40] (Fig. 1(a) ) and has been adapted for retinal imaging. LPSI comprises swept source OCT combining line-field illumination and complex signal reconstruction through an off-axis configuration.
Fig. 1.
(a) Schematic of LPSI setup as explained in the text. (b) Ray diagram of the illumination beam in tangential (parallel) direction of sample (black dotted line) and reference arm (red dotted line), respectively. The imaging relation is depicted as green line. (c) Illumination (and imaging) beam of the sagittal (scanning) direction. Numbers without units are in mm. IS and IR are sample and reference arm beam, respectively.
We employ a Superlum Broadsweeper 840M with a fiber output power of 20mW after passing an optical booster (Superlum, Cork, Ireland, model 850-50). The sample power (Psam) of 4.6mW is well below the maximum permissible exposure (MPE) dictated by the guidelines for laser safety (see Sec. 3.1). A spectral bandwidth of approx. 30nm full width at half maximum (FWHM) after applying a Gaussian window function yields an axial resolution of 12µm in air. An anamorphic optical scheme is created via an achromatic cylindrical lens (CL1) at the entrance of the interferometer. Figure 1(b) illustrates the illumination and imaging path in tangential (parallel) and sagittal (scanning) direction, respectively. To relay the tangential line focus onto the retina we place two telescopes formed by achromatic lenses L1, L2 and L3, L4 into the sample arm of the interferometer. We used two configurations for L3 and L4 with focal lengths and yielding different lateral resolutions and FOVs. In configuration A we utilize a ratio of , whereas in configuration B a ratio of was used. Values for configuration B are given in brackets in the proceeding discussion. The volunteer’s head rested on an adjustable headrest mounted onto the optical bench. The lateral FOV on the retina is approx. along the line focus. The theoretical diffraction limited lateral resolution in parallel direction is . A single axis galvo scanner is placed in the Fourier plane to the sample plane for 3D imaging. The lateral sampling interval is yielding a FOV in scanning direction of . The theoretical diffraction limited lateral resolution in scanning direction is . The line focus in the reference arm is re-collimated via an achromatic cylindrical lens (CL2). A water chamber (WC) of length in the reference arm compensates for the dispersion mismatch between reference and sample arm emanating from the vitreous body of the eye. Dispersion from bulk optics in the sample arm is compensated by additional glass prisms (DP). The optical path of the reference arm is aligned off-axis with respect to the sample arm, which is a well established method in holography [39] to separate the complex conjugate (CC) artifact and the non-interferometric background (DC) from the structure term of the interferometric cross correlation signal. An angle between reference and sample field creates an intensity modulation of the cross correlation signal along the lateral parallel coordinate, which leads to a separation of the respective interference terms in spatial frequency space. Band-limiting the spatial frequency content of the imaged object structure to one half of the full frequency space via an adjustable slit (S1) allows removing the CC artifact and attenuating the DC term for full-range imaging. Hence, the number of spectral sampling points can be reduced to increase the imaging speed. However, this leads to a slight reduction of sensitivity and a trade off in lateral resolution in parallel direction by a factor of 2. The angle alpha is created by deflecting the reference arm beam by a pair of reference mirrors (PRM) at an angle with respect to each other. In the detection arm, an additional telescope formed by lenses L5 and L6 relays the back-propagating reference and sample fields onto the camera objective (CO, Zeiss Planar T*1,4/85 mm ZF). The line-field interferometric signal is recorded by a linear sensor (Basler sprint spL4096-140km) with horizontal and vertical pixel size. The camera line rate (CLR) is up to with a parallel read out of 1024 pixels. The overall lateral magnification is 4 (6), yielding an image size of in the detector plane. In this paper, we performed 3D retinal imaging at different lateral resolutions and acquisition speeds ranging from 600 to 1000 kA-scans/s . The respective specifications are summarized in Table 1 (configurations A1-A4, B1). We obtained the measured detection sensitivity following the procedure described previously [40]. A full 3D stack consisting of 1000x500 lateral and 250 spectral pixels was recorded in only 0.5 to 0.83s. The signal post-processing was running under a LabView (National Instruments) environment on a personal computer (3.16GHz CPU, 2-cores), with real-time tomogram display at a refresh rate of 10 Hz that allowed easy adjustment of the volunteer. Table 1 further lists the configuration dependent acquisition time for single tomograms , the maximum imaging depth , as well as the actual sweeping bandwith Imaging was performed across the zero path length delay, such that structure term, CC artifact and DC term are overlapping. This allows maximizing the acquisition speed by lower sampling of the spectrum.
Table 1. Summary of imaging parameters for different LPSI Configurations.
| A1 | A2 | A3 | A4 | B1 | |
|---|---|---|---|---|---|
| 600 | 600 | 800 | 1000 | 600 | |
| 1.66 | 1.66 | 1.25 | 1 | 1.66 | |
| 0.83 | 0.83 | 0.63 | 0.5 | 0.83 | |
| 4.6 | 4.6 | 4.6 | 4.6 | 4.6 | |
| 95.5 | 95.5 | 94.5 | 93.5 | 96.5 | |
| 7/10/12 | 7/10/12 | 7/10/13 | 7/10/15 | 4.5/6.5/12 | |
| 50 | 50 | ≈45 | ≈40 | 50 | |
| 1.3 | 1.12 | 1.12 | 1.12 | 1.3 | |
| 10/5/2.5 | 10/5/2 | 10/5/2 | 10/5/2 | 10/5/2.5 | |
| 150 | 120 | 160 | 200 | 150 |
2.2 LPSI signal analysis
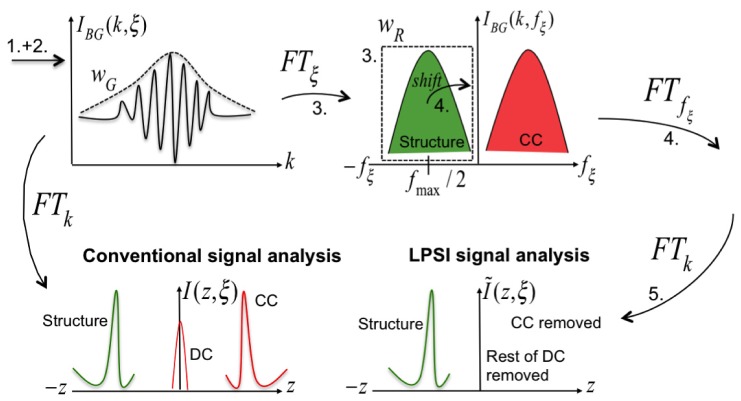
Post-processing of the full 3D stack is performed sequentially for each of the lateral scanning points consisting of lateral (parallel) pixels and K = 250 (200) spectral pixels. In order to obtain unambiguous depth resolved tomograms (B-scan images) of the object structure, we followed the procedure presented previously for LPSI post processing [40]. In contrast to conventional signal analysis performing a single Fourier transform (FT) from wavenumber to depth space, the LPSI analysis enables to separate and remove the CC artifact and the non-interferometric background (DC) from the object structure in spatial frequency space. Additionally we applied a correlation-based axial registration algorithm to minimize the influence of axial motion artifacts. In the following, we summarize the processing steps involved to create the depth-resolved tomograms presented in this paper. Without loss of generality, we restrict our discussion on the processing of a single tomogram at a fixed scanner position . Starting from the recorded line- field interferometric signal , we perform the following steps:
-
1.
Crop images laterally, such that the drop of detection sensitivity within the FOV is less than −8 dB. The lateral sensitivity decay is depicted in Fig. 7. In our case 500 lateral pixels remain.
-
2.Suppress the non-interferometric background (DC) by subtracting the mean spectral intensity from each structural B-scan image:
(1) where is the interferometric signal at scanning position . The mean spectral intensity is calculated by averaging over 100 successive frames in scanning direction. As mentioned above, we apply a Gaussian window function for shaping the spectrum emitted by the swept source laser.
-
3.Perform Fourier Transform in - direction; Subsequently, apply a rect-window function of width in the negative spatial frequency half-space to cancel the remaining DC and CC artifact:
(2) -
4.Shift the remaining spatial frequency content of the object structure to zero and perform the Fourier transform in spatial frequency direction:
(3) where is the maximum spatial frequency content of the object structure given by the inverse of the sensor pixel size , taking into account the lateral magnification of the system and a factor of 2 due to the Nyquist criterion.
-
5.Perform Fourier transform in - direction to change from wavenumber to depth coordinate to obtain CC-artifact-ambiguity-free tomograms:
(4)
Figure 2 highlights the underlying principles involved in performing steps 3-5. The tomograms are scaled taking into account the magnification between object and image coordinates being and of the imaging system and depicted in logarithmic scale if not mentioned explicitly.
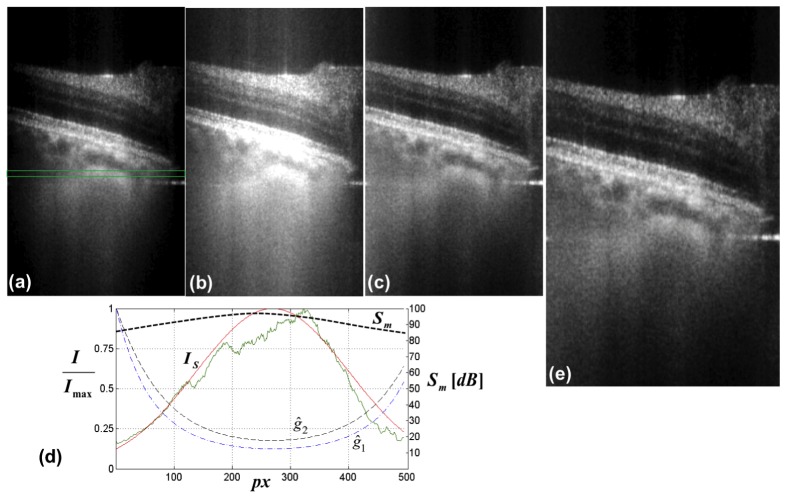
Fig. 7.
Demonstration of the effect of Gaussian weighting on the lateral signal degradation. (a) original retinal tomogram acquired at the periphery of the ONH. The image brightness (B) and contrast (C) was adjusted for optimal examination at the tomogram center. (b) the same tomogram, but B&C adjusted to visualize structures at the periphery. (c) tomogram after lateral Gaussian weighting with curve . (d) normalized lateral signal decay (green curve) as a function of sensor pixels, obtained by averaging over 100 successive sagittal tomograms within the indicated green box in (a). The red curve is the respective Gaussian fit (Sect. 2.3). The normalized black and blue dashed curves and are obtained after inverting the Gaussian fit according to Eq. (6) with d = 0 and d = 5 respectively. is the measured lateral sensitivity decay across the sensor pixels. (e) tomogram after Gaussian weighting with curve .
Fig. 2.
Principle of LPSI signal processing as explained in the text. Numbers 1-5 correspond to the steps described in the enumeration above.
2.3 Mitigation of lateral signal roll-off by Gaussian weighting
The illumination beam of LPSI exhibits a lateral intensity decay following a Gaussian distribution. Accordingly, the interferometric images after LPSI signal processing are suffering from lateral sensitivity decay towards the edges of the line focus. This is due to the fact that in the shot noise limit, the detection sensitivity scales linearly with the optical power at the sample. Even though the signal-to-noise ratio (SNR) might be larger than 1 and structural details may be visible at the edges of the tomogram, it is impossible to properly balance the contrast of the extremely bright central part and the weaker periphery of the intensity tomograms even with logarithmic intensity scale. We thus perform an inverse Gaussian weighting of the linearly scaled intensity tomograms across the lateral coordinate to compensate for the signal imbalance. The Gaussian intensity distribution is directly extracted from a 3D stack of intensity tomograms along the lateral (parallel) coordinate across the line focus by averaging over 200 successive tomograms in scanning direction, and over 30 pixels in depth. The depth location of the averaging window is chosen within choroidal structures, as this yields optimal results concerning the signal contrast balancing across the tomograms. Note, that this has to be done only once for all images. Subsequently, the average lateral signal distribution is fitted by a Gaussian function following
| (5) |
where and c are amplitude, centroid location, and peak width of the Gaussian shape. The additive constant allows for attenuating the effect of the Gaussian weighting if the ambient noise at the edge of the tomogram exceeds a predefined threshold. The function is an array with its number of elements equal to the number of lateral pixels .
Finally, the original tomograms are multiplied by the normalized and inverted Gaussian fit:
| (6) |
where is the maximum value of the function .
2.4 Label-free optical angiography (OA) based on the calculation of speckle variance
Label-free OA based on non-invasive OCT imaging is an attractive method for obtaining 3D microvascular structure of the human retina. In contrast to standard fluorescein angiography (FA) and indocyanine green angiography (ICGA), OA provides full 3D information of the vasculature network without the need of invasive dye administration. OA based on speckle-variance (SV) is straight forwardly applied to swept source OCT variants. It contrasts microvasculature by calculating the interframe speckle variance of the OCT intensity images [41]. It is a particular advantage of LPSI that sets it also apart from full field OCT modalities that signal fluctuations can be assessed between successively recorded tomograms with high sensitivity. In LPSI, a set of frames (B-scan images) is acquired subsequently in time while keeping the lateral scanning position constant. This process is repeated for each scanning point along y. A SV image is created by evaluating the average over squared linearly-scaled intensity differences across the number of B-scans recorded at the same spatial location y according to
| (7) |
where the index runs over the set of B-scans , with being the depth, tangential and sagittal coordinate [42]. The method is further refined by rejecting squared difference tomograms that exceed a predefined threshold for the integrated difference values as outlined in [42]. The SV images exhibit high values for structures with strong speckle fluctuations such as moving red blood cells, and are vanishing for static tissue structures, thereby generating the vascular contrast.
Clearly, the acquisition time for OA based on SV OCT is increased by the amount of B-scan images taken at the same spatial location. Thence, it is necessary to increase the respective acquisition rate in order to keep the effect of motion artifacts minor and the discomfort for the patient minimal. State-of-the-art OA systems, which are based on commercially available swept-source technology are operating at 100kA-scans/s [43]. OA performed at acquisition speeds of 1.6 MA-scans/s were reported [26], however, the required Fourier domain mode locked (FDML) swept-source laser technology for retinal imaging is complex and not yet commercially available. The advantage of OA based on LPSI is to enable full 3D imaging of the retinal microvasculature network at acquisition speeds exceeding 600 kA-scans/s with commercially available and economic technology.
3. Results and discussion
3.1 Sensitivity advantage of LPSI for retinal imaging
In general, the maximum permissible exposure (MPE) for retinal imaging with laser radiation is higher, if a spatially extended source rather than a collimated beam is entering the pupil of the eye. Figure 3 shows a schematic of both situations.
Fig. 3.
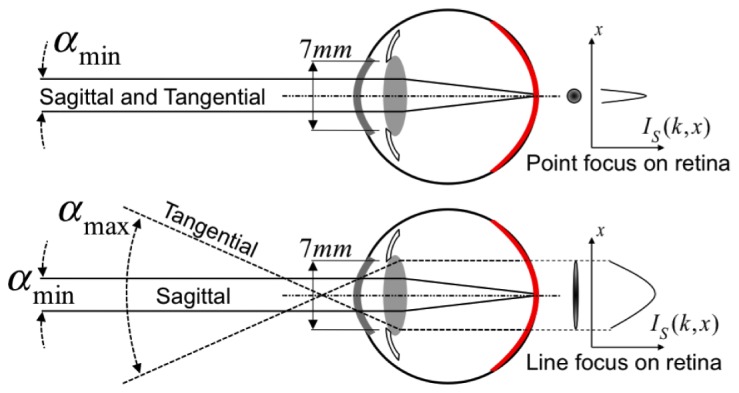
Schematic beam geometry for calculating maximum retinal exposures in point focus illumination (top) and anamorphic line focus illumination (bottom). Definition of sagittal and tangential plane as explained in the text. is the respective sample illumination intensity in tangential - direction.
The following calculations are based on the latest available international standard for safety of laser products IEC 60825-1 [27]. The MPE for ocular exposure with a static beam with a central wavelength of is determined by
| (8) |
where is a wavelength-dependent factor ( for ), and is a factor depending on the angular extent of the employed light source. Assuming a collimated beam, is determined by the minimal angular extent and equals 1. The maximal power illuminating the eye (MPΦ) is then obtained by multiplying the MPE with the full pupil area of radius 7mm, i.e., 0.385cm2. With a retinal exposure time of , the MPΦ equals 0.74 mW. In contrast, LPSI exhibits an anamorphic optical scheme introduced by an achromatic cylindrical lens at the entrance of the interferometer. The pupil of the eye is then illuminated by a line focused in the tangential plane, while being collimated in the orthogonal sagittal plane (Fig. 3, bottom). Consequently, the tangential extent of the beam entering the pupil of the eye can be treated as an extended source with angular subtend if the actual angular subtend . The sagittal extent must be considered as a collimated beam with minimal angular subtend . In the special case of a non-circular extended source, is proportional to the arithmetic mean of horizontal and vertical angular subtend of the probe beam according to [27]:
| (9) |
Thence, the MPΦ for homogeneous line focus illumination is increased to 25.06 mW by a factor of 33.85 as compared to point illumination. The laser safety standards assume for Gaussian intensity distribution of the extended source an angular subtend given by its - width. In our experiments, we employ a fiber collimator leading to a collimated beam with -diameter of 2.6 mm, resulting in an angular extent of 43 mrad in front of the cornea. This leads to a MPΦ of 10.98 mW, thus LPSI exhibits a 15-fold intrinsic sensitivity advantage with respect to point scanning modalities. Note, that this advantage increases with increasing according to Eq. (9), but is ultimately limited by .
In principle, the MPE for a scanning beam with small angular extent can be treated as an extended source as well [20, 27]. This however necessitates employing additional safety mechanisms like beam shutter systems with fast response time in case of scanner failure. The MPE for point scanning OCT systems is therefore usually calculated for the static beam case.
3.2 Retinal imaging at 600 kHz
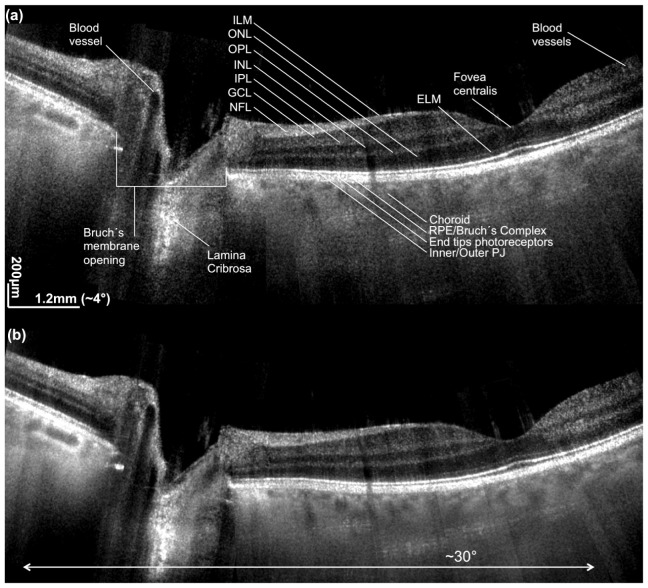
We first demonstrate the performance of LPSI for in vivo structural retinal imaging. The subject was a healthy volunteer. The location of the measurements was controlled with a fixation target presented to the measured eye via dichroic beam splitter. All presented images in this section were acquired at an acquisition speed of 600kA-scans/s and an optical power of 4.6 mW at the cornea (Config. A1). Figure 4 shows a representative 2D wide-field image obtained after stitching 7 successive overlapping tomograms. The lateral FOV is close to 30°. The tomograms were acquired at 2mm intervals with sufficient overlap to allow proper stitching. The stitching allows to better evaluate and compare the performance of the system for the various regions of the retina. The retinal imaging performance in Fig. 4(a) is obtained without any averaging. The detection sensitivity and resolution are high enough to visualize the external limiting membrane (ELM), small blood vessels in the region around the fovea centralis, and to contrast the various layers of the inner retina. We labeled the different retinal layers and anatomical details for better appreciation. Despite the loss of confocality in one lateral dimension and the shorter center wavelength of 840nm as compared to systems operated in the 1060nm wavelength range, the signal intensity from the choroid below the highly scattering RPE is remarkably strong maintaining structural details even in the non-averaged tomograms. Also the depth range as well as the depth sampling is sufficient for supporting both the axial resolution as well as the visualization of all retinal structures including the choroid and even at the optic nerve head. Figure 4(b) shows the same stitch obtained after averaging over 4 successive tomograms for speckle and noise reduction. Due to the speckle averaging effect, Fig. 4(b) exhibits further contrast improvement of choroidal structure and allows better delineation of inner retinal layers. All tomograms were acquired by placing the structural components and complex conjugate artifacts across the zero path length delay. In both wide-field images, the CC artifact was completely removed. The DC term is successfully removed in nearly all of the images, however, the suppression was not complete in regions around the fovea centralis. This is attributed to the corneal reflex that leads to strong fluctuations of the non-interferometric background. Furthermore, we can appreciate the effect of the inverse Gaussian weighting method, since the signal intensity has a smooth continuation across the stitch locations.
Fig. 4.
Stitched widefield 2D retinal images of macula and optic nerve head (ONH). The total field of view is approx. 30°. (a) is obtained without averaging, (b) is obtained by averaging 4 successive tomograms in scanning direction. ILM is internal limiting membrane, ONL is outer nuclear layer, OPL is outer plexiform layer, INL is inner nuclear layer, IPL is inner plexiform layer, GCL is ganglion cell layer, NFL is nerve fiber layer, ELM is external limiting membrane, RPE is retinal pigment epithelium, PJ is photoreceptor junction.
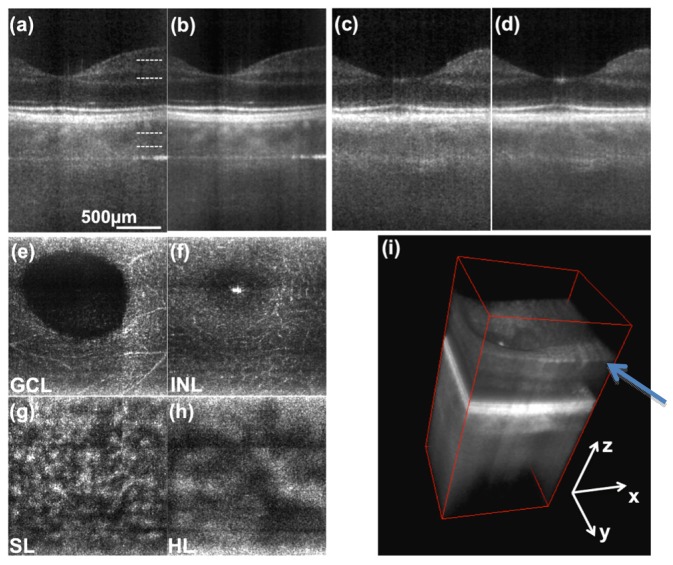
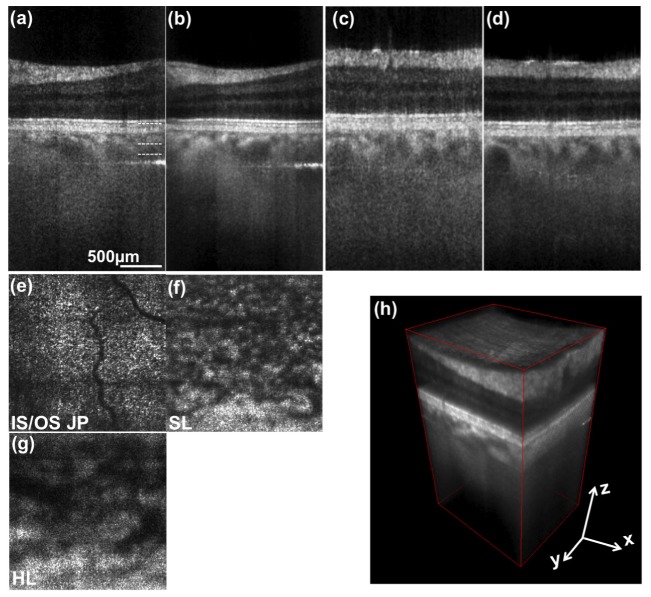
In Figs. 5 and 6 we present 3D retinal images in the parafoveal region and at an eccentricity of about 7deg towards the optic nerve head (ONH), respectively. One full 3D stack was acquired in 0.83 s. Figures 5, 6(a) represent tomograms in parallel direction without averaging, Figs. 5, 6(b) are obtained after averaging 4 successive tomograms. Figures 5, 6(c) and 6(d) are the respective single frame and averaged tomograms in scanning direction. Axial motion artifacts between successive scanning points were removed by correlation-based axial registration. The enface images in Figs. 5(a)-5(d) and Figs. 6(a)-6(c) are obtained by maximum intensity projections of 5 successive depth locations from the 3D stack which are indicated in Fig. 5(a) and Fig. 6(a) respectively. Figures 5(e) and 5(f) demonstrate the visualization of small vessels contained within the GCL and INL. Figures 5(g), 5(h) and Figs. 6(f), 6(g) show the vascular network of the choroid, being the Sattler’s and Haller’s layer respectively. The projection in Fig. 6(e) was made at the IS/OS junction of the photoreceptors. The diffraction limited resolution of configuration A1 is at the border of resolving the cone mosaic at this eccentricity. The cone spacing at this location is about 8µm that needs to be compared to the lateral spot size of 10µm.
Fig. 5.
3D retinal images of parafoveal region. (a) single frame tomogram in transversal (parallel) direction. (b) averaging 4 successive tomograms in scanning (sagittal) direction. (c) and (d) tomograms along the sagittal coordinate. (e), (f), (g) and (h) are enface projections at depth locations indicated in (a). (i) 3D rendering of same data. The arrow points to visible nerve fiber bundles. (GCL- ganglion cell layer, INL - inner nuclear layer, SL - Sattler’s layer, HL - Haller’s layer).
Fig. 6.
3D retinal images obtained at an eccentricity of 7° towards the ONH. (a) represents a depth resolved tomogram in transversal direction. No averaging was employed. (b) is obtained after averaging 4 successive tomograms in scanning (sagittal) direction. (c) and (d) are respective tomograms with the abscissa being the sagittal coordinate. (e), (f) and (g) are enface projections at depth locations indicated in (a). (h) 3D rendering of same data. Abbreviations are explained in Fig. 4 and 5.
3.3 Effect of inverse Gaussian weighting
The feasibility of the inverse Gaussian weighting scheme introduced in Sec. 2.3 is demonstrated in Fig. 7 . A tomogram obtained after LPSI processing exhibits a strong lateral signal decay as can be seen in Fig. 7(a). The lateral signal decay as a function of the lateral parallel coordinate is extracted at the location indicted by the green box in Fig. 7(a) and plotted in Fig. 7(d) (green line). The red line represents the corresponding Gaussian fit according to Eq. (5). Additionally we plotted the measured lateral sensitivity curve across the pixels of the linear CMOS sensor, which indicates, that the dark regions in the left and right corner of the tomogram may contain useful and diagnostically relevant structural information. However, it is hard to adjust the brightness level and contrast of the corresponding image, since either the central part of the tomogram is strongly saturated (Fig. 7(b)) or the level of brightness at the periphery of the tomogram is too low (Fig. 7(a)). After applying the Gaussian weighting (dashed blue curve in Fig. 7(d)) according to Eq. (6) , we compensate for the lateral signal decay. Note, that this procedure does not change the local SNR as both the signal and the noise are multiplied by the same factor. The strong boost of signal at the edges elevates therefore the noise floor, which reduces the subjective contrast and the visual impression in Fig. 7 (c). It is thus beneficial to dampen the Gaussian weighting by adding a constant damping factor to the Gaussian fit . Figure 7(e) represents the result after applying the weighting function (dashed black line in Fig. 7(d)) with . The value for the damping factor is chosen such that the noise level at the edges stays 4 dB above the respective value at the center and the image brightness at the rim of the tomograms can be adjusted to fit the examiners visual perception.
3.4 Retinal imaging at up to 1 MHz
This section is dedicated to demonstrate in vivo retinal imaging at acquisition speeds of up to 1 million A-scans/s. The multiplexing of detection channels by illuminating the linear CMOS pixel array in parallel mitigates the necessity of employing ultra-fast laser sources, scanners and high-speed data acquisition systems. As denoted in Table 1, current LPSI enables volume rates of 2 Hz with dense lateral sampling. In contrast to conventional point scanning techniques, which are reliant on complex, ultra-fast technology, this is achieved by employing mechanical scanners driven at a moderate speed of 2 Hz, cost effective linear CMOS or CCD pixel arrays and commercially available swept source technology. In Fig. 8 we compare single retinal tomograms imaged at the parafoveal region acquired at 600 kA-scans/s (Config. A2 in Fig. 8(a)), 800kA-scans/s (Config. A3 in Fig. 8(b)) and 1000kA-scans/s (Config. A4 in Fig. 8(c)). In case of configuration A3 and A4, we triggered the acousto-optical tunable filter (AOTF) of the employed swept source at a rate up to two times faster than the specified full-spectrum tuning rate (100 Hz) of the filter. Since the response time of the AOTF is slower, the covered spectral bandwidth is reduced. The reduced spectral bandwidth is however reproducible, although some of the recorded spectral intensities appear reduced in output power. This causes a slight fluctuation in signal intensity, which then results in an incomplete suppression of the non-interferometric background. Alternatively, we removed 3 of the central horizontal pixel lines in the final structural tomograms to suppress the remaining DC term. The narrowed spectrum leads to a slightly reduced axial resolution of approx. 13 which can be seen in Figs. 8(b) and 8(c). Albeit the reduced sensitivity in case of the tomograms acquired at 1MA-scans/s, parts of the choroidal vasculature can even be visualized without any additional averaging.
Fig. 8.
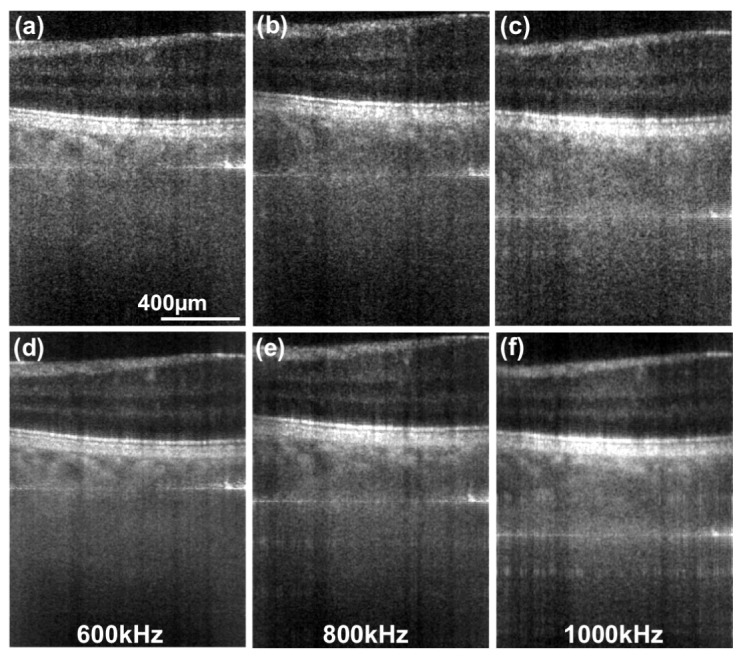
Retinal tomograms acquired at 7° eccentricity from the fovea centralis towards the ONH. (a) was acquired at 600, (b) at 800 and (c) at 1000 equivalent kA-scans/s. The horizontal lines in the tomograms are the remaining DC terms. (d)-(f) were obtained after averaging 4 successive tomograms.
3.5 High resolution retinal imaging
We pointed out, that the lateral resolution of Config. A is not sufficient to resolve single photoreceptor cells. The diameter of cone receptors is of the order of 1.5 at the fovea centralis and increases to approx. 8 towards the periphery [44,45]. Therefore we imaged an area of 1x0.5 mm at an eccentricity of 7deg towards the optic nerve head with Config. B. The lateral resolution of Config. B is 4.5 in parallel and 6.5 in scanning direction. Additionally we decreased the sampling interval of the mechanical scanner from to . The enface projection in Fig. 9(a) is taken at the depth location indicated in the tomogram depicted in Fig. 9(b). In contrast to the images presented in Fig. 6, we start to observe the characteristic cone mosaic in the region magnified and plotted below Fig. 9(a). Still the resolution needs to be improved for a clearer visualization of the cone mosaic. This might be an indicator, that the actual lateral resolution differs from the theoretical diffraction limited value due to aberrations caused by the optics of the eye and/or slightly imperfect adjustment of the imaging system.
Fig. 9.
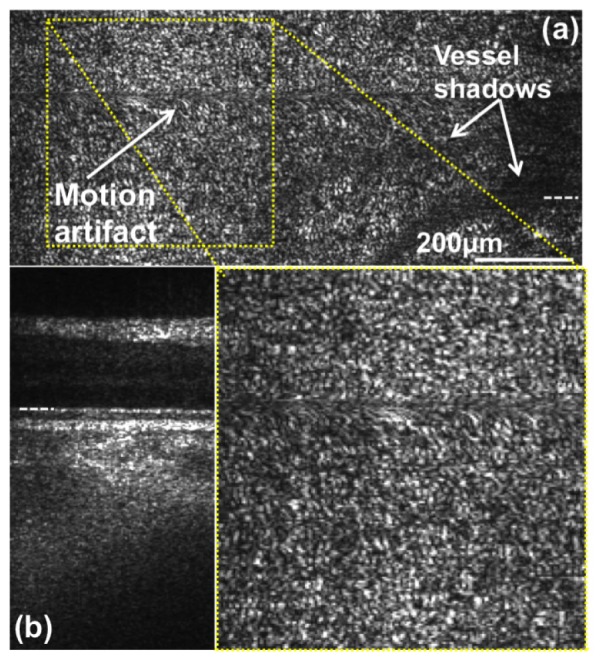
High resolution retinal imaging at 600kHz. The image was acquired at an eccentricity of 7° from the fovea centralis towards the ONH. (a) enface projection at the depth position indicated with a white dashed line in (b). (b) linearly-scaled retinal tomogram taken at the indicated position (white dashed line on right side) in (a) obtained by averaging over 4 successive sagittal frames.
3.6 High speed label-free optical angiography (OA)
In this section we feature optical angiography images based on SV-OCT acquired with LPSI. To the best of our knowledge this is the first demonstration of lable-free OA based on a parallel OCT modality. The subject was again a healthy volunteer. The data was recorded with the system setting of Config. A1. One acquisition is based on a 3D stack with 500 parallel, 250 spectral pixels and 1500 pixels consisting of 500 lateral scanning points with tomograms (B-scan images) acquired at the same lateral position. One single 3D stack corresponds to a lateral FOV of approx. 5-6° and is acquired in just 2.5 s. The high-speed acquisition of LPSI enables minimizing the effect of axial motion artifacts that would lead to a reduction of vascular contrast. Performing axial registration further minimized remaining axial motion between the B-scan images used to obtain the interframe SV. After calculating the SV image based on Eq. (7), single enface projections are obtained by maximum intensity projection over a depth range indicated in Fig. 10(a) . We adjusted the location of the area around the fovea centralis by utilizing the fixation target and acquired 3 individual volumes across the fovea centralis horizontally displaced by approx. 3. The final stitched FOV of the presented OA is 8-9° in tangential and 5-6° in sagittal direction.
Fig. 10.
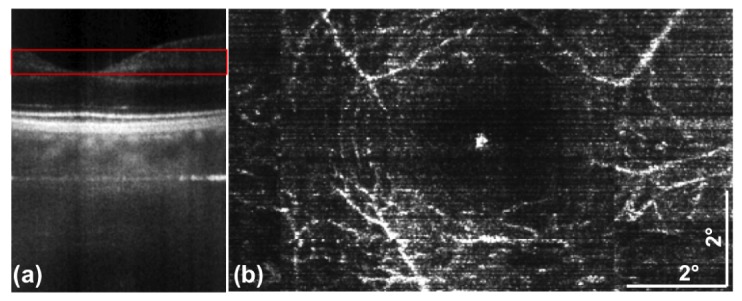
Non-invasive, high speed optical angiography of the retinal vasculature network based on speckle variance (Sect. 2.4). (a) tomogram showing the fovea centralis and indicating the depth position (red box) used to obtain the enface- projection of (b). (b) enface OA image obtained after calculating the speckle variance image. The enface image was obtained by maximum intensity projection over a depth range indicated in (a).
3.7 Motion artifacts
Axial and lateral eye motion during the OCT acquisition process may cause distortions, blurring and artificial shifts of structure within the tomograms and/or the whole volume stack. Axial motion is caused by moving red blood cells with axial velocities ranging from a few tenth of micrometer per second to centimeters per second depending on the vessel type and diameter, fundus pulsation in the order of ten micrometers per second, and finally the most critical being involuntary motion of the eye and head during assessment. The latter vary strongly across individuals and can easily reach several millimeters per second. The strongest lateral motion artifacts are eye saccades that reach 360°/sec [46] and involuntary eye and head motion during measurement. In swept source OCT (SS OCT) the spectral points are acquired sequentially in time to obtain an interferometric image. However, the effect of motion manifests differently when comparing high-speed point-scanning SS OCT with LPSI at equivalent A-scan rates. In point scanning SS OCT, the full spectrum for a single OCT depth-scan is swept in in order to achieve an A-scan rate of higher than 500 kHz. In the LPSI case, a full B-scan image is recorded in parallel, however with a relatively long sweeping duration of . As a consequence, single A-scans in LPSI may exhibit stronger influence of axial and lateral eye motion during acquisition as compared to point scanning modalities. In order to describe the effect of axial motion artifacts to swept source OCT modalities as LPSI let us assume a single reflecting interface that is moving axially at constant velocity during acquisition. The linear spectral sweep is characterized by the wavenumber sweep range , the sweep period , and the resulting sweeping speed , as . We further assume that the full-width at half maximum of the spectral sweep is , leading to an axial resolution of . The interference signal can then be written as being proportional to
| (10) |
where is the path length difference between reference arm and sample interface distance at , , and is an arbitrary constant phase offset. Since the wavenumber dependence shifted to a dependence on sweep time , we perform the Fourier transform over to obtain the A-scan as a function of depth . We basically observe two effects on the OCT signal associated to the moving interface [47]: first of all, the interface appears shifted by , and secondly, the associated signal peak experiences a broadening by a factor due to the quadratic dependence on , with . Note that the displacement has two components, one being the expected linear shift during time period , , and the second being due to the offset in wavenumber space. In fact , since usually . In Table 2 we plot the values for the displacement components and and the broadening factor for the present system parameters and typically encountered axial velocities during retinal assessment.
Table 2. Axial motion caused signal distortions.
| f [kHz] | T [ms] | δk [m−1 s−1] | v [mm/s] | Δzv [µm] | ΔzD [µm] | ζ |
|---|---|---|---|---|---|---|
| 600 | 1.66 | 2.65E + 08 | 0.1 | 0.2 | 2.7 | 1.00 |
| 1 | 1.7 | 27.4 | 1.11 | |||
| 10 | 16.6 | 273.9 | 4.90 | |||
| 800 | 1.25 | 3.52E + 08 | 0.1 | 0.1 | 2.1 | 1.00 |
| 1 | 1.3 | 20.6 | 1.06 | |||
| 10 | 12.5 | 206.3 | 3.74 | |||
| 1000 | 1 | 4.40E + 08 | 0.1 | 0.1 | 1.7 | 1.00 |
| 1 | 1.0 | 16.5 | 1.04 | |||
| 10 | 10.0 | 165.0 | 3.06 |
In Figs. 11(d) and 11(e) we demonstrate the effect of axial blurring caused by blood flow within vessels with a large axial velocity component. According to Table 2, axial blood flow may lead to a 15-20-fold overestimation of particle displacement and broadening of the axial PSF by a factor of 5 in case of 600 kHz acquisition rate. Even at higher acquisition rates this effect might strongly influence the proper localization of flow components. The examples presented in Figs. 11(a)-11(d) demonstrate how axial and tangential motion affect the resolution of the LPSI tomograms. The motion itself emanated from involuntary eye movement during fixation and fatigue during the measurement session. Figure 11(a) exhibits large lateral and axial motion components, which can be estimated by comparison to the subsequent tomogram in Fig. 11(b). Figure 11(d) on the other hand shows a tomogram exhibiting only a minor structural shift as compared to the preceding tomogram in Fig. 11(c), resulting in reduced blurring of the morphologic structure.
Fig. 11.
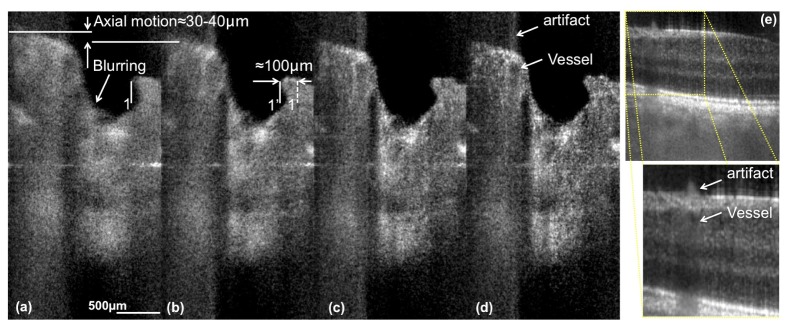
Demonstration of the effect of axial motion artifacts. (a)-(d) are tomograms acquired around the ONH with Config. A1. The blurring emanates from eye motion during acquisition of the spectrum. (e) shows a section acquired at approx. 4° eccentricity from the fovea towards the ONH. The artifact highlighted in the magnified image of (e) and in (e) is a consequence of the blurring induced by the axial blood flow component in the vessel below. The distance between location 1 and 1’ indicated in (b) corresponds to the estimated lateral motion between the tomogram in (a) and the successive tomogram in (b). The axial displacement between tomograms in (a) and (b) might be overestimated, since the sample motion introduces a Doppler frequency causing an additional artificial shift of the sample structure.
The lateral displacement between the successive tomograms presented in Figs. 11(a) and 11(b) is approx. , corresponding to a lateral velocity in the order of . Following again the theory [47], this yields a lateral broadening factor of approx. 7 if we assume a lateral resolution of in our system. However, a statistical analysis of our assessed 3D data revealed, that only 1-2% of the total amount of tomograms acquired at 600 kHz are impaired by substantial broadening of the axial and lateral PSF. Within the acquisition duration of a complete 3D stack (0.83 s), the broadening might either emanate from transversal high-speed saccades with an occurrence frequency of 0.5-2 Hz and speeds of 30-360°/s [48], or transversal drifts with an order of magnitude lower speeds [49]. According to Table 2, slower axial and rotational motion of the eye that is superimposed to the transversal saccades and drifts [50] does not significantly contribute to broadening of the PSF. We further observed, that the occurrence of blurring is further decreased to less than 1% in case of acquisition at 1 MHz. Still, the fact that structures at motion such as red blood cells experience signal blurring and displacement causes a reduction in vascular contrast for SV OCT angiography.
4. Conclusion
In this paper, we demonstrated 3D in vivo retinal imaging with line-field parallel swept source interferometric imaging. We have shown that the concept of parallel line-field illumination and detection enables 2D and 3D in vivo imaging at high speed with commercially available and cost-effective technology. We presented a 2D wide-field stitch covering a FOV of approx. 30° showing parts of the macula and optic nerve head. Furthermore, we have shown 2D and 3D retinal images acquired at the fovea centralis and at an eccentricity of 7° towards the ONH at acquisition speeds of up to 1MA-scans/s. The presented results manifest the theoretical sensitivity advantage of parallel OCT modalities. To the best of our knowledge, the system achieved the highest sensitivity of reported line field OCT modalities to date. LPSI enables competitive imaging results as compared to respective point scanning modalities. In fact, it is currently the fastest OCT device applied to retinal imaging and operating at a central wavelength window around 800 nm with a detection sensitivity of higher than 93.5 dB. Frequently reported challenges with spectral and spatial crosstalk in full-field OCT [29] and line-field spectrometer based OCT [31,32] emanating from multiple scattered light within the tissue seem to be reduced in the case of LPSI. We thoroughly discussed the influence of rapid eye motion and blood flow on the broadening of the axial and lateral point spread function. The high acquisition speed enables further comprehensive imaging of small tissue structures in-vivo.
We further demonstrated non-invasive optical angiography with LPSI to assess the retinal microvasculature structure in vivo. Albeit the fact that we have shown only preliminary results, we were able to validate the feasibility of utilizing the speckle variance method in combination with parallel line-field OCT intensity images. OA with LPSI is an attractive method for future applications in retinal diagnosis, since our system provides high imaging speed and sensitivity together with economic and commercially available technology.
Finally, we proposed a processing method to mitigate the effect of the lateral Gaussian signal decay and verified it empirically.
A remaining challenge for future research is the persisting lateral Gaussian sensitivity decay, and the need for technological improvements regarding sensor technology with respect to frame rate and dynamic range, -and available swept source development with high output-power at medium speed. Improvement of the B-scan imaging speed would further reduce the influence of rapid eye motion on the axial and lateral resolution to a minimum. Nevertheless, the presented results demonstrate a remarkable potential of LPSI for retinal structural with the capability of functional imaging. We hope that this paper initiates technological innovations in the field of sensor and swept source development, which would enable the demonstration of the full capability and diagnostic value of LPSI. The biggest asset of LPSI at it’s current status is the combination of high-speed capability with moderate technological requirements as compared to point scanning OCT modalities. Since the fundamental physical and eye safety limits are not yet reached in LPSI, additional technological improvements might even lead to a paradigm change in retinal diagnostic OCT imaging.
Acknowledgment
The financial support by the Austrian Federal Ministry of Economy, Family and Youth and the Austrian National Foundation of Research, Technology and Development and Carl Zeiss Meditec Inc., Dublin, USA is gratefully acknowledged. We further thank Matthias A. Salas for scientific discussion regarding high-resolution retinal imaging.
References and links
- 1.Swanson E. A., Izatt J. A., Hee M. R., Huang D., Lin C. P., Schuman J. S., Puliafito C. A., Fujimoto J. G., “In vivo retinal imaging by optical coherence tomography,” Opt. Lett. 18(21), 1864–1866 (1993). 10.1364/OL.18.001864 [DOI] [PubMed] [Google Scholar]
- 2.Fercher A. F., Hitzenberger C. K., Drexler W., Kamp G., Sattmann H., “In vivo Optical Coherence Tomography,” Am. J. Ophthalmol. 116(1), 113–114 (1993). 10.1016/S0002-9394(14)71762-3 [DOI] [PubMed] [Google Scholar]
- 3.Drexler W., Liu M., Kumar A., Kamali T., Unterhuber A., Leitgeb R. A., “Optical coherence tomography today: speed, contrast, and multimodality,” J. Biomed. Opt. 19(7), 071412 (2014). 10.1117/1.JBO.19.7.071412 [DOI] [PubMed] [Google Scholar]
- 4.Choma M., Sarunic M., Yang C., Izatt J., “Sensitivity advantage of swept source and Fourier domain optical coherence tomography,” Opt. Express 11(18), 2183–2189 (2003). 10.1364/OE.11.002183 [DOI] [PubMed] [Google Scholar]
- 5.Leitgeb R., Hitzenberger C., Fercher A., “Performance of fourier domain vs. time domain optical coherence tomography,” Opt. Express 11(8), 889–894 (2003). 10.1364/OE.11.000889 [DOI] [PubMed] [Google Scholar]
- 6.de Boer J. F., Cense B., Park B. H., Pierce M. C., Tearney G. J., Bouma B. E., “Improved signal-to-noise ratio in spectral-domain compared with time-domain optical coherence tomography,” Opt. Lett. 28(21), 2067–2069 (2003). 10.1364/OL.28.002067 [DOI] [PubMed] [Google Scholar]
- 7.Drexler W., Morgner U., Ghanta R. K., Kärtner F. X., Schuman J. S., Fujimoto J. G., “Ultrahigh-resolution ophthalmic optical coherence tomography,” Nat. Med. 7(4), 502–507 (2001). 10.1038/86589 [DOI] [PMC free article] [PubMed] [Google Scholar]
- 8.Wojtkowski M., Srinivasan V., Ko T., Fujimoto J., Kowalczyk A., Duker J., “Ultrahigh-resolution, high-speed, Fourier domain optical coherence tomography and methods for dispersion compensation,” Opt. Express 12(11), 2404–2422 (2004). 10.1364/OPEX.12.002404 [DOI] [PubMed] [Google Scholar]
- 9.Leitgeb R., Drexler W., Unterhuber A., Hermann B., Bajraszewski T., Le T., Stingl A., Fercher A., “Ultrahigh resolution Fourier domain optical coherence tomography,” Opt. Express 12(10), 2156–2165 (2004). 10.1364/OPEX.12.002156 [DOI] [PubMed] [Google Scholar]
- 10.Nassif N., Cense B., Park B., Pierce M., Yun S., Bouma B., Tearney G., Chen T., de Boer J., “In vivo high-resolution video-rate spectral-domain optical coherence tomography of the human retina and optic nerve,” Opt. Express 12(3), 367–376 (2004). 10.1364/OPEX.12.000367 [DOI] [PubMed] [Google Scholar]
- 11.Pircher M., Zawadzki R. J., “Combining adaptive optics with optical coherence tomography: unveiling the cellular structure of the human retina in vivo,” Expert Rev. Ophthalmol. 2(6), 1019–1035 (2007). 10.1586/17469899.2.6.1019 [DOI] [Google Scholar]
- 12.Hermann B., Fernández E. J., Unterhuber A., Sattmann H., Fercher A. F., Drexler W., Prieto P. M., Artal P., “Adaptive-optics ultrahigh-resolution optical coherence tomography,” Opt. Lett. 29(18), 2142–2144 (2004). 10.1364/OL.29.002142 [DOI] [PubMed] [Google Scholar]
- 13.Potsaid B., Gorczynska I., Srinivasan V. J., Chen Y., Jiang J., Cable A., Fujimoto J. G., “Ultrahigh speed Spectral / Fourier domain OCT ophthalmic imaging at 70,000 to 312,500 axial scans per second,” Opt. Express 16(19), 15149–15169 (2008). 10.1364/OE.16.015149 [DOI] [PMC free article] [PubMed] [Google Scholar]
- 14.An L., Li P., Shen T. T., Wang R., “High speed spectral domain optical coherence tomography for retinal imaging at 500,000 A‑lines per second,” Biomed. Opt. Express 2(10), 2770–2783 (2011). 10.1364/BOE.2.002770 [DOI] [PMC free article] [PubMed] [Google Scholar]
- 15.Kocaoglu O. P., Turner T. L., Liu Z., Miller D. T., “Adaptive optics optical coherence tomography at 1 MHz,” Biomed. Opt. Express 5(12), 4186–4200 (2014). 10.1364/BOE.5.004186 [DOI] [PMC free article] [PubMed] [Google Scholar]
- 16.Grulkowski I., Liu J. J., Potsaid B., Jayaraman V., Lu C. D., Jiang J., Cable A. E., Duker J. S., Fujimoto J. G., “Retinal, anterior segment and full eye imaging using ultrahigh speed swept source OCT with vertical-cavity surface emitting lasers,” Biomed. Opt. Express 3(11), 2733–2751 (2012). 10.1364/BOE.3.002733 [DOI] [PMC free article] [PubMed] [Google Scholar]
- 17.Huber R., Wojtkowski M., Fujimoto J. G., “Fourier Domain Mode Locking (FDML): A new laser operating regime and applications for optical coherence tomography,” Opt. Express 14(8), 3225–3237 (2006). 10.1364/OE.14.003225 [DOI] [PubMed] [Google Scholar]
- 18.Huber R., Adler D. C., Srinivasan V. J., Fujimoto J. G., “Fourier domain mode locking at 1050 nm for ultra-high-speed optical coherence tomography of the human retina at 236,000 axial scans per second,” Opt. Lett. 32(14), 2049–2051 (2007). 10.1364/OL.32.002049 [DOI] [PubMed] [Google Scholar]
- 19.Wieser W., Biedermann B. R., Klein T., Eigenwillig C. M., Huber R., “Multi-Megahertz OCT: High quality 3D imaging at 20 million A-scans and 4.5 GVoxels per second,” Opt. Express 18(14), 14685–14704 (2010). 10.1364/OE.18.014685 [DOI] [PubMed] [Google Scholar]
- 20.Klein T., Wieser W., Reznicek L., Neubauer A., Kampik A., Huber R., “Multi-MHz retinal OCT,” Biomed. Opt. Express 4(10), 1890–1908 (2013). 10.1364/BOE.4.001890 [DOI] [PMC free article] [PubMed] [Google Scholar]
- 21.Klein T., Wieser W., Eigenwillig C. M., Biedermann B. R., Huber R., “Megahertz OCT for ultrawide-field retinal imaging with a 1050 nm Fourier domain mode-locked laser,” Opt. Express 19(4), 3044–3062 (2011). 10.1364/OE.19.003044 [DOI] [PubMed] [Google Scholar]
- 22.Wang R. K., Jacques S. L., Ma Z., Hurst S., Hanson S. R., Gruber A., “Three dimensional optical angiography,” Opt. Express 15(7), 4083–4097 (2007). 10.1364/OE.15.004083 [DOI] [PubMed] [Google Scholar]
- 23.Makita S., Hong Y., Yamanari M., Yatagai T., Yasuno Y., “Optical coherence angiography,” Opt. Express 14(17), 7821–7840 (2006). 10.1364/OE.14.007821 [DOI] [PubMed] [Google Scholar]
- 24.Mariampillai A., Standish B. A., Moriyama E. H., Khurana M., Munce N. R., Leung M. K., Jiang J., Cable A., Wilson B. C., Vitkin I. A., Yang V. X., “Speckle variance detection of microvasculature using swept-source optical coherence tomography,” Opt. Lett. 33(13), 1530–1532 (2008). 10.1364/OL.33.001530 [DOI] [PubMed] [Google Scholar]
- 25.Bachmann A. H., Villiger M. L., Blatter C., Lasser T., Leitgeb R. A., “Resonant Doppler flow imaging and optical vivisection of retinal blood vessels,” Opt. Express 15(2), 408–422 (2007). 10.1364/OE.15.000408 [DOI] [PubMed] [Google Scholar]
- 26.Blatter C., Klein T., Grajciar B., Schmoll T., Wieser W., Andre R., Huber R., Leitgeb R. A., “Ultrahigh-speed non-invasive widefield angiography,” J. Biomed. Opt. 17(7), 070505 (2012). 10.1117/1.JBO.17.7.070505 [DOI] [PubMed] [Google Scholar]
- 27.IEC 60825–1 ed3.0, “Safety of laser products – Part 1: Equipment classification and requirements,” (2014).
- 28.ANSI, “American National Standard for safe use of lasers (ANSI 136.1),” ANSI 136.1–2007 (The Laser Institute of America, 2007). [Google Scholar]
- 29.Bonin T., Franke G., Hagen-Eggert M., Koch P., Hüttmann G., “In vivo Fourier-domain full-field OCT of the human retina with 1.5 million A-lines/s,” Opt. Lett. 35(20), 3432–3434 (2010). 10.1364/OL.35.003432 [DOI] [PubMed] [Google Scholar]
- 30.Zuluaga A. F., Richards-Kortum R., “Spatially resolved spectral interferometry for determination of subsurface structure,” Opt. Lett. 24(8), 519–521 (1999). 10.1364/OL.24.000519 [DOI] [PubMed] [Google Scholar]
- 31.Grajciar B., Pircher M., Fercher A., Leitgeb R., “Parallel Fourier domain optical coherence tomography for in vivo measurement of the human eye,” Opt. Express 13(4), 1131–1137 (2005). 10.1364/OPEX.13.001131 [DOI] [PubMed] [Google Scholar]
- 32.Nakamura Y., Makita S., Yamanari M., Itoh M., Yatagai T., Yasuno Y., “High-speed three-dimensional human retinal imaging by line-field spectral domain optical coherence tomography,” Opt. Express 15(12), 7103–7116 (2007). 10.1364/OE.15.007103 [DOI] [PubMed] [Google Scholar]
- 33.Mujat M., Iftimia N. V., Ferguson R. D., Hammer D. X., “Swept-source parallel OCT, ” Proc. SPIE 7168, Optical Coherence Tomography and Coherence Domain Optical Methods in Biomedicine XIII, 71681E (2009). [Google Scholar]
- 34.Wojtkowski M., Kowalczyk A., Leitgeb R., Fercher A. F., “Full range complex spectral optical coherence tomography technique in eye imaging,” Opt. Lett. 27(16), 1415–1417 (2002). 10.1364/OL.27.001415 [DOI] [PubMed] [Google Scholar]
- 35.Kim D. Y., Werner J. S., Zawadzki R. J., “Comparison of phase-shifting techniques for in vivo full-range, high-speed Fourier-domain optical coherence tomography,” J. Biomed. Opt. 15(5), 056011 (2010). 10.1117/1.3494556 [DOI] [PMC free article] [PubMed] [Google Scholar]
- 36.Leitgeb R. A., Hitzenberger C. K., Fercher A. F., Bajraszewski T., “Phase-shifting algorithm to achieve high-speed long-depth-range probing by frequency-domain optical coherence tomography,” Opt. Lett. 28(22), 2201–2203 (2003). 10.1364/OL.28.002201 [DOI] [PubMed] [Google Scholar]
- 37.Yasuno Y., Makita S., Endo T., Aoki G., Itoh M., Yatagai T., “Simultaneous B-M-mode scanning method for real-time full-range Fourier domain optical coherence tomography,” Appl. Opt. 45(8), 1861–1865 (2006). 10.1364/AO.45.001861 [DOI] [PubMed] [Google Scholar]
- 38.Hillmann D., Franke G., Hinkel L., Bonin T., Koch P., Hüttmann G., “Off-axis full-field swept-source optical coherence tomography using holographic refocusing,” Proc. SPIE 8571, Optical Coherence Tomography and Coherence Domain Optical Methods in Biomedicine XVII, 857104 (2013). [Google Scholar]
- 39.Leith E., Upatnieks J., “Wavefront Reconstruction with Diffused Illumination and Three-Dimensional Objects,” J. Opt. Soc. Am. 54(11), 1295–1301 (1964). 10.1364/JOSA.54.001295 [DOI] [Google Scholar]
- 40.Fechtig D., Schmoll T., Grajciar B., Drexler W., Leitgeb R., “Line-field parallel swept source interferometric imaging at up to 1 MHz,” Opt. Lett. 39(18), 5333–5336 (2014). 10.1364/OL.39.005333 [DOI] [PubMed] [Google Scholar]
- 41.Mahmud M. S., Cadotte D. W., Vuong B., Sun C., Luk T. W. H., Mariampillai A., Yang V. X., “Review of speckle and phase variance optical coherence tomography to visualize microvascular networks,” J. Biomed. Opt. 18(5), 050901 (2013). 10.1117/1.JBO.18.5.050901 [DOI] [PubMed] [Google Scholar]
- 42.Blatter C., Weingast J., Alex A., Grajciar B., Wieser W., Drexler W., Huber R., Leitgeb R. A., “In situ structural and microangiographic assessment of human skin lesions with high-speed OCT,” Biomed. Opt. Express 3(10), 2636–2646 (2012). 10.1364/BOE.3.002636 [DOI] [PMC free article] [PubMed] [Google Scholar]
- 43.Jia Y., Tan O., Tokayer J., Potsaid B., Wang Y., Liu J. J., Kraus M. F., Subhash H., Fujimoto J. G., Hornegger J., Huang D., “Split-spectrum amplitude-decorrelation angiography with optical coherence tomography,” Opt. Express 20(4), 4710–4725 (2012). 10.1364/OE.20.004710 [DOI] [PMC free article] [PubMed] [Google Scholar]
- 44.Hirsch J., Curcio C. A., “The spatial resolution capacity of human foveal retina,” Vision Res. 29(9), 1095–1101 (1989). 10.1016/0042-6989(89)90058-8 [DOI] [PubMed] [Google Scholar]
- 45.Curcio C. A., Sloan K. R., Kalina R. E., Hendrickson A. E., “Human photoreceptor topography,” J. Comp. Neurol. 292(4), 497–523 (1990). 10.1002/cne.902920402 [DOI] [PubMed] [Google Scholar]
- 46.Povazay B., Hofer B., Torti C., Hermann B., Tumlinson A. R., Esmaeelpour M., Egan C. A., Bird A. C., Drexler W., “Impact of enhanced resolution, speed and penetration on three-dimensional retinal optical coherence tomography,” Opt. Express 17(5), 4134–4150 (2009). 10.1364/OE.17.004134 [DOI] [PubMed] [Google Scholar]
- 47.Yun S. H., Tearney G., de Boer J., Bouma B., “Motion artifacts in optical coherence tomography with frequency-domain ranging,” Opt. Express 12(13), 2977–2998 (2004). 10.1364/OPEX.12.002977 [DOI] [PMC free article] [PubMed] [Google Scholar]
- 48.Fricker S. J., “Dynamic measurements of horizontal eye motion. I. Acceleration and velocity matrices,” Invest. Ophthalmol. 10(9), 724–732 (1971). [PubMed] [Google Scholar]
- 49.Engbert R., Kliegl R., “Microsaccades uncover the orientation of covert attention,” Vision Res. 43(9), 1035–1045 (2003). 10.1016/S0042-6989(03)00084-1 [DOI] [PubMed] [Google Scholar]
- 50.Harwood M. R., Mezey L. E., Harris C. M., “The spectral main sequence of human saccades,” J. Neurosci. 19(20), 9098–9106 (1999). [DOI] [PMC free article] [PubMed] [Google Scholar]


