Abstract
Combining diffuse optical tomography methods with Raman spectroscopy of tissue provides the ability for in vivo measurements of chemical and molecular characteristics, which have the potential for being useful in diagnostic imaging. In this study a system for Raman tomography was developed and tested. A third generation microCT coupled system was developed to combine 10 detection fibers and 5 excitation fibers with laser line filtering and a Cytop reference signal. Phantom measurements of hydroxyapatite concentrations from 50 to 300 mg/ml had a linear response. Fiber placement and experiment design was optimized using cadaver animals with live animal measurements acquired to validate the systems capabilities. Promising results from the initial animal experiments presented here, pave the way for a study of longitudinal measurements during fracture healing and the scaling of the Raman tomography system towards human measurements.
OCIS codes: (110.6955) Tomographic imaging, (170.0110) Imaging systems, (170.5660) Raman spectroscopy
1. Introduction
Raman spectroscopy provides highly specific chemical composition and molecular structure information on a sample. Raman spectroscopy of biological tissues is widely studied because the Raman spectrum of tissue is sensitive to compositional alterations caused by aging and disease. Early uses of Raman spectroscopy and imaging have been conducted on excised tissue samples in order to obtain high-quality spectra [1]. As an optical spectroscopy method, Raman spectroscopy is amenable to fiber optic instrumentation, which enables non-invasive in vivo Raman measurements. Spatially-offset Raman spectroscopy (SORS), involving collection of back-scattered Raman photons laterally offset from the excitation source, was first demonstrated in 2005 as a technique for probing subsurfaces [2]. Transmission Raman, involving collection of Raman photons through a sample, was later developed for non-invasive forensic and pharmaceutical analyses [3, 4]. Since those first reports in SORS and transmission Raman, we have seen advances in fiber optic probe design, Raman-scattered photon transport theory, data preprocessing and tissue phantom models [5–10]. There is potential of transcutaneous Raman spectroscopy, either in a SORS or transmission approach, for clinical applications in bone disease and breast cancer [11–15].
Our research in animal models and human patients has shown potential of non-invasive Raman spectroscopy to monitor alterations in bone composition associated with disease or fracture healing [13, 16]. There are two embodiments in our translational research. The first embodiment is using SORS to obtain Raman spectra in a defined anatomic location such as the proximal tibia, wound bed or articular surface [6, 13, 17]. Another approach is detection of diffusely propagated photons in a 360◦ plane around the excitation source, otherwise known as Raman tomography. Since our first reports in 2008 [18, 19], a research focus in our laboratories has been development of Raman tomography for in vivo Raman imaging of bone in humans or animal models. Since 2010, both in a rat model and human cadaveric specimens, we have reported measurement of diffusely propagated photons collected from multiple collection angles [16, 20, 21]. Extension of these principles toward subsurface measurements in polymers was later reported in 2014 [22].
We adapted principles and analysis tools from diffuse optical tomography for Raman tomography. A robust method for diffuse optical tomography, including Raman, is to utilize multiple combined source-detector measurements through tissue with model based reconstruction of the parameter distribution. Optical tomography methods use transmission measurements of emitted signals to determine a map of the interior optical properties of the imaged object, and this approach can be utilized in combination with co-localized images of the structures from x-ray or microCT imaging. Image-guided optical tomography requires modeling of scattering, absorption and transmission interactions and how they affect the measured signal [23], using photon pathways modeled with the diffusion approximation to the radiation transport equation. The combination of image-defined structures with Raman tomography can be integrated using open access software NIRFAST (www.nirfast.org). NIRFAST is an open-source and publically available software tool for modeling near-infrared light transport in tissue [23, 24]. The combined data set requires a truly optimized hardware interface in order to provide a stable and reliable Raman signal estimate.
Previous experiments acquiring transcutaneous Raman spectroscopy of bone consisted of illumination and detection patterns over large areas and measured predominately back-scattered photons [25, 26]. The first Raman tomography measurements were reported in 2008, where Raman measurements were acquired in a rectangular array 180 degrees separated from the illumination location, showed potential for in vivo tomographic studies [18, 19]. Two interfaces were designed for Raman tomography in rats, where the Raman signal was collected from multiple angles around an illumination source. However, these previous interfaces did not address a major concern in Raman spectroscopic tomography coupled to microCT (or x-ray), which was to ensure accurate measurement of the source and detector fiber placement in a way that does not interfere with the microCT image. Multiple optical fibers are required to interface with the tissue to allow the acquisition of multiple illumination and collection patterns. Multiple illumination and collection patterns are needed to collect high signal to noise data in the plane of collection to enable 3D reconstruction with high repeatability. These requirements need to be balanced with constraints on length of acquisition the overall size and cost of the system. The focus in this work is around the development of instrumentation which would yield reliable and repeatable localized Raman signals from microCT-imaged bones in vivo.
The iterative process of instrument design and building relies upon the feedback obtained during experimentation. In the duration of previous in vivo rat measurements, we found design and ergonomic factors which affected instrument performance. Thus, we completely redesigned and built the specimen illumination apparatus, patient interface and collection fibers. In this manuscript, we describe the design, build and performance of a third-generation Raman tomography instrument for in vivo bone measurements.
2. Materials and methods
2.1 Raman spectrograph
The Raman instrument used in these experiments was a commercially-available component consisting of a Raman spectrograph operating at λ = 785 nm (RNX1, Kaiser Optical Systems Inc., Ann Arbor, MI, USA). Raman scattered photons were collected using a spectrograph equipped with a 100μm slit. A low frequency holographic grating produced dispersed light over the wavenumber region between 100cm−1 and 1800cm−1. The detector was a 1024 x 256 pixel back-illuminated deep-depletion charge coupled device (Andor Classic, Andor Technologies, Belfast, United Kingdom) cooled to −75°C. Custom-designed and built optical fiber probes, described below, were coupled to the spectrograph using standard connectors.
2.2 Specimen illumination design
A custom-designed system was built to incorporate an internal Raman intensity standard and automated laser switching between illumination fibers. The illumination component, shown in Fig. 1(a) , consists of a polymer fiber coupled, through telescoping optics, to a fiber switch unit. Laser light from the RXN1 instrument was directly coupled, by FC connector, into a 2 meter polyperfluoro-butenylvinylether (Cytop) optical fiber. (Chromis Fiberoptics, Warren, NJ, USA) Fig. 1(b) shows a Raman spectrum of the Cytop polymer with filtering and without filtering. Laser light from the polymer cable was collimated, filtered with an 842 nm short pass filter (Semrock Inc., Rochester, NY, USA) and injected into the input channel on a 1x6 optical fiber switch (Leoni, Nuremburg, Germany) using telescoping optics. Leoni manufactured the optical fiber switch, with crosstalk characteristics near the noise floor of detection and channel-to-channel intensity variation was below 6%. Illumination fibers were coupled into the switch system with a converging lens. Illumination fibers consisted of a 100µm core, 125μm fiber diameter after cladding, and a total diameter of 1.23mm with the inclusion of the stainless steel ferrule. In-house software was written in Matlab (2013b, The MathWorks, Natick, MA, USA) to control the switch. The laser intensity varied between 35 and 75mW at the tip of the illumination fiber, depending on alignment.
Fig. 1.
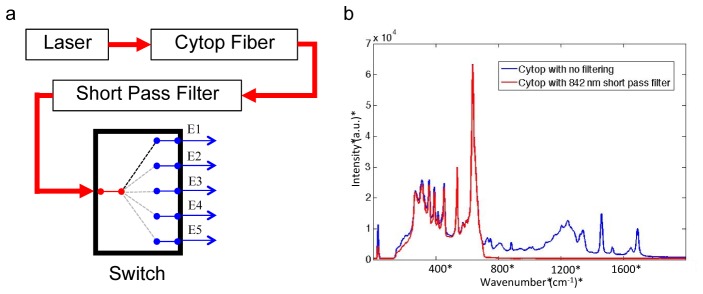
Panel a shows a diagram of the optical set up for illumination channels with the relative locations of filters and Leoni optical fiber switch. Briefly, laser light (λ = 785 nm) was delivered into a fluorocarbon polymer (Cytop) fiber and passed through a short-pass filter into telescoping optics and coupled into the Leoni switch. A custom Matlab script was written to automatically illuminate individual excitation optical fibers E1-E5. Panel b shows the Raman spectrum of Cytop polymer with no short pass filter in the optical train (upper spectrum) and with an 842 nm short pass filter (bottom spectrum).
2.3 Collection fiber bundle
Figure 2 shows details of the collection fiber bundle. A collection fiber bundle was designed in-house and custom built with the goals of reducing fiber silicon signal and improving reproducibility in fiber placement (FiberTech Optica Inc., Kitchener, Ontario, Canada). The collection bundle had 50 total fibers consisting of 10 collection branches and 5 optical fibers within each collection branch. Low OH fibers were used to decrease fluorescence and Raman signal generated within the fibers [27]. Individual 100μm core optical fibers were 125μm after cladding and coating and had a numerical aperture of 0.22. Five individual fibers were placed in a bundle and those bundled fibers had a diameter of 0.33mm. The fiber bundle was encapsulated with a stainless steel ferrule to increase the sturdiness of the fiber tip and for a total diameter of 1.27mm. Even low OH silicon fibers generate Raman signals and fluorescence. Minimization of endogenous fiber signal enables higher Raman signal to background for the Raman bands of interest. Our approach was to use an optical fiber at the tip of each fiber bundle. A 785nm long pass filter was micro-milled and fit to the tip of the bundle ferrule, shown in Fig. 2(b). A photograph of the bundle tip is shown in Fig. 2(c) to show the 5 fibers.
Fig. 2.

Panel a is an illustration of the collection fibers, with filtering affixed to the tip of the fiber generated in SolidWorks. A photograph in panel b was taken of two fibers showing the reflection of the laser filter at the fiber edge. Panel c is a direct view of an illuminated fiber bundle showing the placement of the 5 fibers inside the bundle.
2.4 Probe-to-tissue interface
The probe-to-tissue interface was completely redesigned to accommodate additional fibers, improve fiber positioning and compatibility with the microCT instrument. The redesign also addressed requirements to design a holder that was efficient, compact and versatile. Figure 3 shows the CAD schematics of the fiber holder created in Solidworks (Dassault Systemes Solidworks Corp. Waltham, MA, USA). The holder was built with 3D print technology and parts were printed on an Objet250 (Stratasys Ltd., Eden Prairie, Minnesota).
Fig. 3.
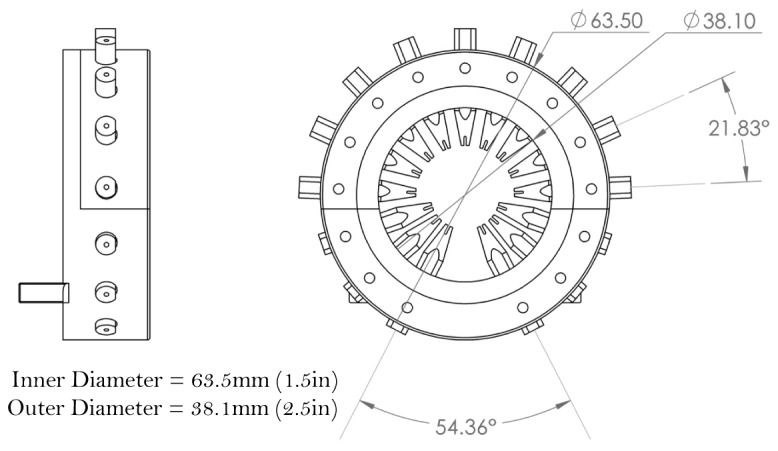
CAD diagram of the redesigned fiber holder generated with smaller angular separation between fiber guides and a smaller OD. These features enabled 15 fibers, an improvement over the 12 fibers used in an older model. The fiber holder is easily affixed to a patient bed, and the materials and dimensions are compatible with microCT instrument.
This approach enabled fabrication of smaller-sized features that were not possible using a traditional machining approach. Fiber guides were created for 15 fibers, 10 collection fibers and 5 excitation fibers, which was an improvement over the 12 total fibers in previous holders. The connecting apparatus which affixed the two pieces of the holder was also redesigned to allow for greater stability and easier fitting with a split where the top 9 fibers and holder can quickly be placed or removed, and the connecting apparatus was held in place by 4 nylon set screws.
2.5 Raman data preprocessing and image formation
Calibration of the instrument was performed by collecting spectra of NIST-traceable white light and neon emission lamp to calibrate the wavenumber axis and correct for wavelength-dependent variations in CCD efficiency. Raman spectra of Teflon or acetaminophen were acquired to correct the Raman shift for laser wavelength [28]. White light measurements from each collection fiber bundle were used to calculate which detector pixels corresponded to the collection fiber bundle. Correction of tissue autofluorescence signal was performed using a polynomial subtraction method adapted from a report by Zhao et al [29]. In tissue-simulating phantoms and rat specimens, Raman bands corresponding to bone hydroxyapatite mineral at ~958 cm−1 and Cytop polymer at ~692 cm−1 were identified. Data points for tomographic reconstruction were determined by peak maxima values, integrated band area values or ratios (either intensity or area) of two Raman peaks of interest. Tissue phantom data were analyzed by calculating the intensity ratio of hydroxyapatite band to Cytop band for each collection fiber bundle and plotting the intensity ratio against the concentration of the hydroxyapatite inclusion or inclusion diameter.
Raman and microCT data were used to generate a tomographic reconstruction. Tomographic reconstructions required the generation of a volume mesh representing soft tissue and bone tissue regions with differing optical properties. DICOM images from microCT scans were segmented into regions for animal experiments. Segmentations were passed through NIRFAST software for generation of finite element meshes. Placement of source and detectors on the surface of the mesh, is guided by the presence of the fiber guides in the DICOM images and the inclusion of the displacement and compression of skin tissue which occurs during experimentation, which is important to include due to the applied pressure affecting tissue optical properties [30].
Images of the tomographic reconstructions were generated by iterative solving of the diffusion approximation in NIRFAST, with the driving mechanism being the minimization of the difference between the experimental measurements and the modeled data. Images represented the location and intensity of generated Raman photons, known as Raman yield. Tomographic reconstructions of the Raman yield were performed with both diffuse and a priori techniques [23]. A priori, or hard prior reconstruction techniques include region location within the tissue volume with the mesh node information and forces homogeneous recovered signals. The final image of the reconstruction algorithm was used to determine the contrast to background ratio (CBR), corresponding to the recovered hydroxyapatite to Cytop ratio for the bone region divided by the soft tissue region.
2.6 Validation studies in tissue phantoms
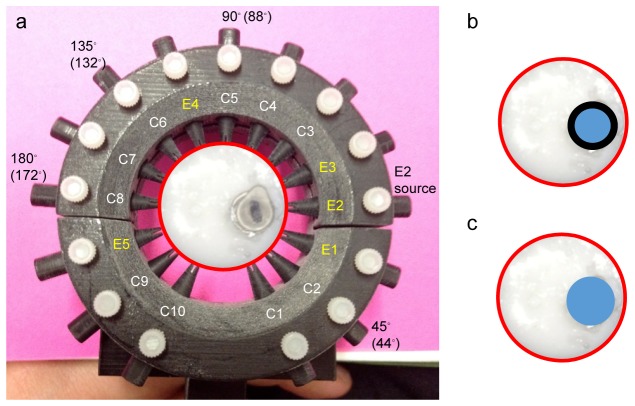
Validation studies were performed in tissue-simulating phantoms. We examined the effect of varying hydroxyapatite concentration for a defined “bone” tissue volume on normalized Raman hydroxyapatite signal. Cylindrical tissue phantoms were prepared to model the optical properties and approximate geometry of rat tibia bone and overlying soft tissue. Phantoms were made with total 25mm diameter to model the rat soft tissue dimensions at the tibia mid-diaphysis with an 8.5mm diameter “bone” inclusion at the imaging plane. Gelatin phantoms were prepared using recipes previously described [7]. Briefly, the outer “soft tissue” phantom consisted of 10% (w/v) gelatin (Accumedia Manufacturers Inc., Lansing, MI, USA) with 10% (v/v) Liposyn II (Hospira Inc, Lake Forest, IL, USA). The gelatin solution was poured into a petri dish and allowed to cool. Once solidified, a 25 mm diameter and 18 mm high cylinder was cut from the bulk and a small hole was cut from off-center using a pipette tip. This hole was the site for the inner “bone” inclusion. The inner “bone” phantom was prepared by adding hydroxyapatite (HAp, SigmaAldrich, St. Louis, MO, USA) to 1 ml of a gelatin + 10% Liposyn II solution and poured into a 1.0 ml centrifuge tube. The tube was gently stirred to ensure minimal settling of HAp during solidification. The inner “bone” inclusion was ~8.5 mm diameter. In total, 7 “bone” inclusions were prepared at HAp concentrations of 50, 100, 150, 200, 225, 250 and 300 mg/ml. A control “bone” inclusion, composed of 0 mg/ml HAp + gelatin + 10% Liposyn II, was also prepared. For reference, the physiologic HAp concentration in bone is approximately 220 mg/ml [31]. The “bone” inclusions were examined as followed: once inside the centrifuge tube (Fig. 4(b) ) and in duplicate after it had been removed from the tube (Fig. 4(c)).
Fig. 4.
Photograph (panel a) of an example tissue phantom in the fiber holder. During experiments, the “bone” inclusion was removed from the centrifuge tube and inserted into the outer “soft tissue” phantom. The illumination pattern is shown on the interior of the fiber holder, using E1-E5 to denote excitation fibers and C1-C10 to denote collection fibers. E2 was the excitation fiber used. Raman data were collected from all 10 collection fibers. Approximate degrees of separation for C2, C5, C6 and C8 are shown exterior to the fiber holder. Data from these collection fibers are presented in Figs. 7 and 8. Panel b is a cartoon of the bone inclusion inside the phantom while inside the polymer centrifuge tube, representing a 2-layer inclusion. Panel c is a cartoon of the bone inclusion inside the phantom after it has been removed from the polymer centrifuge tube, representing a single layer inclusion.
Phantoms were stored in an airtight container at 4◦C when not in use and measured within a week of preparation. For Raman measurements, the phantom was placed into the patient interface, shown in Fig. 4 and excitation fiber 2 was used to illuminate the phantom. We used the excitation/collection fiber pattern that was optimized for in vivo use, denoted in Fig. 4. The optimized fiber pattern was determined using a cadaver animal, where the possible illumination patterns were tested to ensure sufficient excitation light delivery to the region of interest while still generating a full tomographic data set. Results were analyzed to determine greatest Raman signal from the bone and highest level of consistency in producing data above the noise floor. Additionally, this illumination pattern was chosen as the grouping of excitation fibers near the bone generates the greatest fluence while having sufficient number of detection fibers near.
Raman signal was collected for 600 seconds to obtain a good signal-to-noise spectrum that did not require post-processing smoothing correction. In order to ensure consistent fiber alignment during this study, the fibers were not moved in between measurements. Only the “bone” inclusion was removed after the measurement while keeping the outer “soft tissue” phantom in place. Another “bone” inclusion, at a different HAp concentration was then inserted into the inclusion site and a Raman spectrum was collected. The “bone” inclusions were examined in random order.
2.7 Validation studies in cadaveric and live rat specimens
The second series of validation studies was performed in cadaveric (n = 2) and live (n = 1) rats. The illumination/collection pattern, interface setup time and signal collection parameters were optimized in cadaveric rat specimens. Parameters were adjusted to have the highest signal to noise ratio while remaining within the time restraints of animal experimentation. The live rat was obtained from another study which was approved by the University of Michigan University Committee on the Care and Use of Animals. Skeletally mature 6 month old male Sprague-Dawley rats were sacrificed as part of another study. Frozen cadaveric rats were brought to room temperature and the right tibia was prepared for examination by the Raman system and microCT. Fur was removed from the right tibia using either an electric razor or a depilatory. A thin layer of glycerol was applied to the skin to facilitate fiber coupling to the tissue. Fibers were placed in the fiber guides until the fiber made close contact with the skin and the guide was tightened in place with a set screw.
The ability to reproduce measured signals accurately without physically moving of fibers was tested with a cadaveric rat specimen. Spectra were acquired for 180, 300 and 600 seconds to determine an optimal measurement time. After polynomial fitting to remove background signal, the Cytop and hydroxyapatite signals were calculated and the average of signal intensity for 10 detection fibers when illuminated closest to the bone site was taken as the data point, shown in Fig. 5 .
Fig. 5.
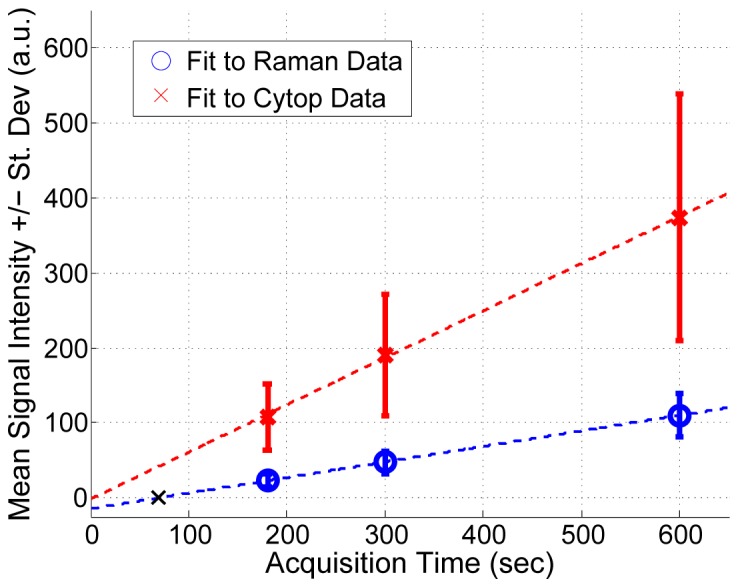
Multiple Raman measurements were collected from the same animal without changing the location of the optical fibers to determine the linearity of Cytop and Raman signals with integration time. As expected, Cytop and Raman signals scale linearly with time. This study suggests that a minimal integration time of 69 seconds, indicated by a black X, in the “Fit to Raman Data” trend line would provide Raman signal above the noise floor.
The pattern of excitation and collection fibers around the imaging place was also iteratively moved to optimize collection of transcutaneous bone signal. The optimized pattern, also used for tissue phantom and live rat measurements, is shown in Fig. 4. The patient interface in use on a live, anesthetized, rat is shown in Fig. 6a and a cross section view from the microCT scan in Fig. 6(b) shows moderate tissue indentation at sites where the fiber guides are in contact with the tissue.
Fig. 6.
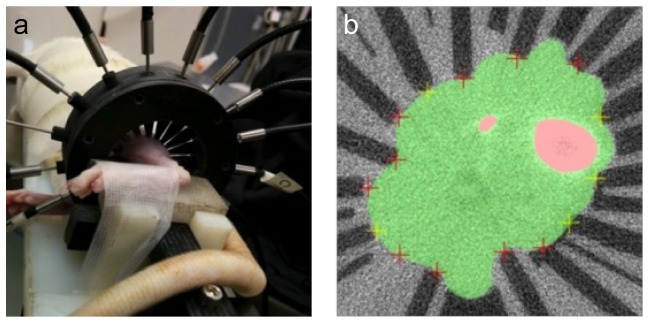
Panel a shows a rat tibia in the fiber holder with fibers placed around the leg. Panel b shows a microCT image showing the fiber guides on the surface and the deformation caused by placement on the exterior of the leg. Areas in pink are the tibia and fibula and the area colored in green represents soft tissue consisting of muscle, tendon and skin.
In another study, repeatability tests were performed by collecting Raman data from a rat specimen for two consecutive days. Tomographic reconstructions were performed and the normalized bone Raman parameter for the bone region to the background was determined for diffuse and hard prior reconstructions.
3. Results
3.1 Assessing Cytop as a reference intensity standard
Earlier studies had described the use of a fluoropolymer fiber as a reference intensity standard [32]. However, we found significant overlapping Cytop signal in the bone matrix region (1200-1800 cm−1). Cytop signal could not be removed using software subtraction routines without affecting the shape of important bone collagen band envelopes. As shown in Fig. 1(b), inclusion of an 842 nm short pass filter into the illumination system removed bands in the 1200-1800 cm−1 spectral region. As shown in Fig. 5, Cytop signal scaled linearly with acquisition time. Linear fitting of these data points generated a R2 value of 1 for the Raman data and 0.9992 for the Cytop data. The location of the x-intercept on the Raman line, marked with a black X in Fig. 5, indicates the minimum exposure time necessary for a signal above the noise floor, which is equivalent to 69 seconds. However, experimental times longer than 69 seconds would be required to obtain significant Raman signal. These data suggest that Cytop polymer fibers are suitable for a reference standard in fiber-optic Raman measurements.
3.2 Tissue Phantom Validation Studies
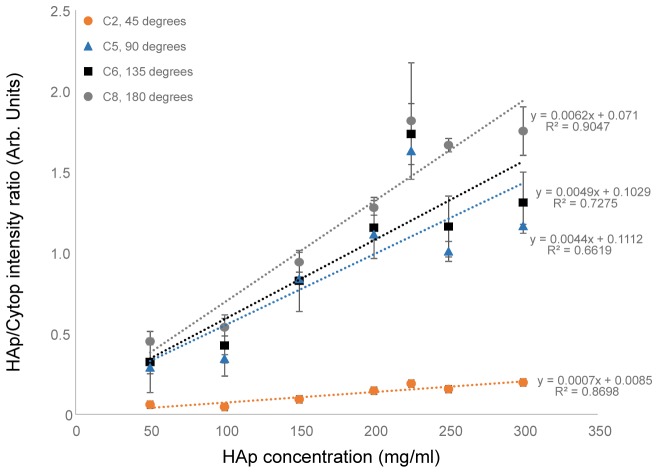
Data from tissue phantom and rat specimens demonstrate feasibility of transcutaneous bone measurements. In general, we found that the third-generation instrument generated high quality spectroscopic and imaging data, with improved ergonomics and compatibility with microCT. Initial tissue phantom data shows good linearity of HAp signal and suggests that, while most of the sampling occurs at the “bone” surface, there is some subsurface sampling. The sensitivity of the system was determined through phantoms with decreasing contrast to background values. Tomographic measurements allowed for simultaneous measurement of the reference Cytop polymer and HAp Raman signals. The baselined intensity value for all source detector pairs was calculated from the spectrum. Normalized HAp Raman data for source-detector separations at approximately 45, 90, 135 and 180 degrees were plotted against HAp concentration, shown in Fig. 7 .
Fig. 7.
Raman spectra of tissue phantoms were used to determine noise floor and attenuation region for the measurement of hydroxyapatite (HAp) with the current system. These measurements were performed with the bare bone inclusion after it was removed from the plastic centrifuge tube. Raman HAp signal normalized to Cytop Raman signal is shown against the concentration of HAp in the “bone” inclusion. Collection signal from collection fibers corresponding to approximately 45◦, 90◦, 135◦ and 180◦ are presented.
The data show that the normalized HAp Raman signal increased with concentration and generally followed a linear relationship for all source-detector pairs. The data from this phantom test supports our hypothesis that the instrumentation provides suitable contrast, at all degrees of collection, for physiologically-relevant HAp concentrations. These results suggest, at physiological levels of HAp, most of the Raman photons are being generated at the surface of the inclusion and little light is propagated through the inclusion.
Even though phantom data indicate minimal photon propagation through the inclusion, our tests suggest that subsurface sampling of the inclusion does occur. Measurements of the 2-layer bone inclusion, with the bone phantom + the plastic centrifuge tube, shown in Fig. 4(b), demonstrated recovery of both tube material and HAp signal. Figure 8(a) shows averaged Raman spectra of tissue phantoms with the bone inclusion inside the centrifuge tube material. As expected, the spectra show contributions from Cytop and the centrifuge tube material (denoted by a * in the figure). However, we were also able to recover subsurface hydroxyapatite signal. Figure 8(b) shows the normalized HAp signal as a function of HAp concentration. The R2 values of trend lines were >0.9 for 45, 90 and 135 degrees, indicating a linear response. We observed similar trends of increased spread in the data at high HAp concentrations and less variability in signal recovered from fibers closer to the illumination source.
Fig. 8.
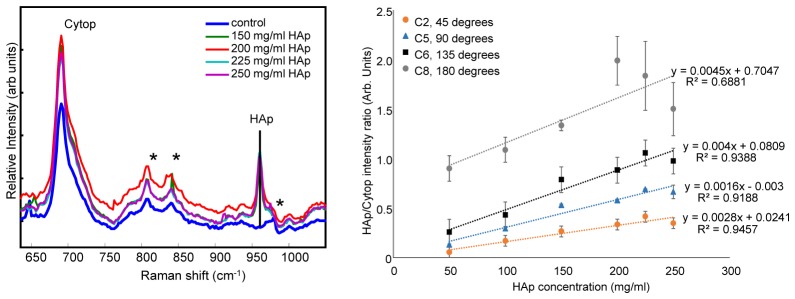
Raman spectra of tissue phantoms were used to determine noise floor and attenuation region for the measurement of HAp with the current system. These measurements were performed with the 2-layer bone inclusion, which was the “bone” phantom inside its plastic centrifuge tube. Panel a shows Raman HAp signal normalized to Cytop Raman signal is shown against the concentration of HAp in the “bone” inclusion. The spectra show signatures from Cytop, centrifuge material (denoted with an *) and HAp. The control inclusion does not have any signatures from HAp. Panel b shows normalized HAp signal from collection fibers corresponding to approximately 45◦, 90◦, 135◦ and 180◦. The data shows trends of increased Raman signal collected at 180◦ and increased spread at higher HAp concentrations.
3.3 Rat specimen validation studies
An in vivo animal protocol was developed for sequential acquisition of Raman and microCT data sets. Based on the advice of our animal handling experts, we established a maximum experiment time of 50 minutes. The Raman and microCT measurements together take 40 minutes, leaving only 10 minutes to place the tibia into the holder and set up the fiber system. A streamlined workflow enabled rapid (7 minutes) Raman probe setup in a cadaveric rat and we tested this workflow on a live anesthetized rat. The described optimized workflow is also used in our ongoing in vivo longitudinal study of a rat fracture healing model. We observed that live rats generally tolerated the Raman/microCT procedure well. There were temporary indentations on the skin caused by contact of the fiber guides, which persisted less than an hour after the procedure. The indentations did not penetrate the skin or restrict the animal’s movement.
Optical measurements were acquired on two consecutive days for the in vivo study and a comparison of the reconstruction results was done to determine the effect of day-to-day variations. Reconstructions completed with diffuse parameters led to a mean normalized CBR value of 2.4 ± 0.3 over the two days. Inclusion of hard priors in the reconstruction led to a mean CBR value of 9.6 ± 6.3. The contrast to background ratio for each day of measurements is presented in Table 1 .
Table 1. Contrast to background values for diffuse Raman reconstructions from data acquired on a live rat indicating the day-to-day variation in recovered bone to cytop signal within the bone region compared to the soft tissue region as defined in the microCT images used for image segmentation.
| Experiment Date | Diffuse | Hard |
|---|---|---|
| January 29 | 2.6 | 14.1 |
| January 30 | 2.2 | 5.2 |
4. Discussion
The third-generation system makes important improvements to earlier prototypes that enable quantitative Raman tomography and improved image reconstruction. Importantly, tomographic reconstructions were completed using a full 360 degrees of data collection rather than a SORS-type backscatter measurement on the same surface of the leg [18, 19, 25, 26]. We have demonstrated feasibility of transcutaneous Raman tomography.
The Raman tomography instrumentation used in our previous studies had major instrumentation limitations that our new design addresses. We discuss four improvements to the instrument; the removal of metal from the holder, the inclusion of increased locations for illumination fibers through a fiber switch, an internal reference in Cytop, and laser line filtering with submillimeter filters at the tip of collection fibers.
A major limitation in previous prototypes was the use of metal rings to hold the specimen rigid and align the fibers with the surface [21]. However, the metal holder made coupling to microCT impractical. We have addressed this concern by fabricating the new holder entirely from polymers which allows for the collection of microCT scans without removing the fiber holder. The second instrumentation limitation in previous design was the use of a single fiber as the excitation source. This limitation in probe design required the single fiber to be manually moved from position to position around the ring which increased fiber placement errors and prolonged the experiment time. To address this second major issue, the new design uses 5 excitation fibers and a fiber switch, eliminating the need to manually switch excitation fiber positions.
We have also included improvements to the laser delivery system. Inclusion of a filtered Cytop fiber section, for measurement of a reference standard signal, corrects for coupling variations. This approach is similar to the Born technique used in other diffuse tomography studies [33]. Integration of a fiber switch into the illumination pathway allows for a reduction in the fiber coupling error while selectively illuminating one fiber for excitation. To our knowledge, this is the first report of incorporating of a laser line filter at the tip of the collection bundles with a submillimeter diameter. While other groups have reported laser line filtering, the diameter of the filter was limited to commercially available sizes. Our micro-milling approach now enables laser line filtering for micrometer diameter probes. The technological features in the described system can be extended to other fiber-optic Raman probes.
Phantom measurements enabled us to characterize the instrument response to bone-like mineral levels. The geometry of a cylindrical tissue phantom approximates the plane in which the Raman tomography measurements were made on rat tibiae. We showed evidence that subsurface sampling of a bone inclusion is possible using our instrumentation. This observation may have important implications for non-invasive measurement of cancellous bone, where more rapid bone remodeling events occur than in cortical bone. Further tests in rat bone tissue are underway to confirm these tissue phantom results. Similar tissue phantoms can be made to model potential clinical conditions including generalized bone mineral loss or localized bone erosion. Anthromorphic phantoms described by Esmonde-White et al and Michaelsen et al would enable a multivariate model to simultaneously measure a defined bone volume and hydroxyapatite levels [7, 34].
Our in vivo animal protocol allowed us to complete our measurements in the recommended time. We confirmed no permanent damage to the rats. Day-to-day variations in the contrast to background is most likely affected by subjective variables such as user experience. These may manifest in placement of the fiber pattern and location with respect to the bone. We also found the amount of pressure applied to the surface by the fibers and fiber guides can affect the efficiency in which light couples into the tissue. For hard prior reconstructions small changes in the amount of signal caused by any of these parameters can lead to large variations in the reconstructed values.
Non-invasive Raman measurement of bone in an in vivo setting has important implications for the future musculoskeletal diagnostics. While we report the Raman tomography instrument using phantoms or rat specimens, the probe-to-tissue interface can be scaled to accommodate human-sized anatomic sites such as the distal radius and fingers. Extension to multiplane tomography in the clinic can be achieved through the addition of multiple fiber holders and detectors, with the eventual goal of a custom-designed interface for human use. Our experimental approach and instrumentation was designed with an eventual goal of in vivo human use. An important consideration is laser safety. Preclinical animal studies do not define maximum laser exposure limits. Nonetheless, we anticipated translational studies in humans using comparable technology. As such, our rat measurements used the American National Standards Institute (ANSI) guideline, Z136.1-2007 of maximum permissible exposure (MPE) for continuous illumination (t = 10 sec-30000 sec) in humans. In human tissue, the ANSI guideline for MPE is 0.3W/cm2 in the wavelength range 750-1050 nm and we used a similar MPE for our rat measurements [13]. Even though higher laser intensities can be used for diagnostic purposes, we believe adoption of this conservative guideline has facilitated favorable review of our approved human clinical study protocols (n = 2) by the University of Michigan Institutional Review Board.
We foresee two possible areas of clinical applications for the Raman tomography technology in bone diseases. The first clinical application area is transcutaneous measurements of bone demineralization at the distal radius which may be indicative of osteoporosis or other metabolic bone diseases. The second potential clinical application area is transcutaneous Raman measurements of periarticular bone erosions at the fingers which may be encountered in rheumatoid arthritis.
Acknowledgments
This work has been sponsored by NIH research grant R01AR056646 (MDM, BWP). KEW acknowledges training grant T32AR007080 from NIH/ National Institute of Arthritis and Musculoskeletal and Skin Diseases. We thank Dr. William Lloyd for his assistance during the Raman tomography experiments. We thank Kathleen Sweet, Dr. Dana Begun and Dr. Steven Goldstein at the University of Michigan Orthopaedic Research Laboratory for procurement of rat specimens, assistance with animal handling and collecting microCT images. We thank Christian Ortiz at the Thayer School of Engineering for assistance with CAD and 3D print technology guidance.
References and links
- 1.Morris M. D., Mandair G. S., “Raman Assessment of Bone Quality,” Clin. Orthop. Relat. Res. 469(8), 2160–2169 (2011). 10.1007/s11999-010-1692-y [DOI] [PMC free article] [PubMed] [Google Scholar]
- 2.Matousek P., Clark I. P., Draper E. R. C., Morris M. D., Goodship A. E., Everall N., Towrie M., Finney W. F., Parker A. W., “Subsurface probing in diffusely scattering media using spatially offset Raman spectroscopy,” Appl. Spectrosc. 59(4), 393–400 (2005). 10.1366/0003702053641450 [DOI] [PubMed] [Google Scholar]
- 3.Stone N., Matousek P., “Advanced transmission Raman spectroscopy: a promising tool for breast disease diagnosis,” Cancer Res. 68(11), 4424–4430 (2008). 10.1158/0008-5472.CAN-07-6557 [DOI] [PubMed] [Google Scholar]
- 4.Matousek P., Parker A. W., “Non‐invasive probing of pharmaceutical capsules using transmission Raman spectroscopy,” J. Raman Spectros. 38(5), 563–567 (2007). 10.1002/jrs.1688 [DOI] [Google Scholar]
- 5.Sato H., Shinzawa H., Komachi Y., “Fiber-optic Raman probes for biomedical and pharmaceutical applications,” in Emerging Raman Applications and Techniques in Biomedical and Pharmaceutical Fields (Springer, 2010), pp. 25–45. [Google Scholar]
- 6.Esmonde-White K. A., Esmonde-White F. W. L., Morris M. D., Roessler B. J., “Fiber-optic Raman spectroscopy of joint tissues,” Analyst (Lond.) 136(8), 1675–1685 (2011). 10.1039/c0an00824a [DOI] [PMC free article] [PubMed] [Google Scholar]
- 7.Esmonde-White F. W. L., Esmonde-White K. A., Kole M. R., Goldstein S. A., Roessler B. J., Morris M. D., “Biomedical tissue phantoms with controlled geometric and optical properties for Raman spectroscopy and tomography,” Analyst (Lond.) 136(21), 4437–4446 (2011). 10.1039/c1an15429j [DOI] [PMC free article] [PubMed] [Google Scholar]
- 8.Reddy R. K., Bhargava R., “Chemometric methods for biomedical Raman spectroscopy and imaging,” in Emerging Raman Applications and Techniques in Biomedical and Pharmaceutical Fields (Springer, 2010), pp. 179–213. [Google Scholar]
- 9.Buckley K., Kerns J. G., Parker A. W., Goodship A. E., Matousek P., “Decomposition of in vivo spatially offset Raman spectroscopy data using multivariate analysis techniques,” J. Raman Spectros. 45(2), 188–192 (2014). 10.1002/jrs.4434 [DOI] [Google Scholar]
- 10.Everall N., Priestnall I., Dallin P., Andrews J., Lewis I., Davis K., Owen H., George M. W., “Measurement of spatial resolution and sensitivity in transmission and backscattering Raman spectroscopy of opaque samples: impact on pharmaceutical quality control and Raman tomography,” Appl. Spectrosc. 64(5), 476–484 (2010). 10.1366/000370210791211646 [DOI] [PubMed] [Google Scholar]
- 11.Keller M. D., Majumder S. K., Mahadevan-Jansen A., “Spatially offset Raman spectroscopy of layered soft tissues,” Opt. Lett. 34(7), 926–928 (2009). 10.1364/OL.34.000926 [DOI] [PubMed] [Google Scholar]
- 12.Stone N., Baker R., Rogers K., Parker A. W., Matousek P., “Subsurface probing of calcifications with spatially offset Raman spectroscopy (SORS): future possibilities for the diagnosis of breast cancer,” Analyst (Lond.) 132(9), 899–905 (2007). 10.1039/b705029a [DOI] [PubMed] [Google Scholar]
- 13.Esmonde-White F. W. L., Morris M. D., “Validating in vivo Raman spectroscopy of bone in human subjects,” in SPIE BiOS, (International Society for Optics and Photonics, 2013), 85656K. [Google Scholar]
- 14.Takahata M., Maher J. R., Juneja S. C., Inzana J., Xing L., Schwarz E. M., Berger A. J., Awad H. A., “Mechanisms of bone fragility in a mouse model of glucocorticoid-treated rheumatoid arthritis: Implications for insufficiency fracture risk,” Arthritis Rheum. 64(11), 3649–3659 (2012). 10.1002/art.34639 [DOI] [PMC free article] [PubMed] [Google Scholar]
- 15.Stone N., Faulds K., Graham D., Matousek P., “Prospects of deep Raman spectroscopy for noninvasive detection of conjugated surface enhanced resonance Raman scattering nanoparticles buried within 25 mm of mammalian tissue,” Anal. Chem. 82(10), 3969–3973 (2010). 10.1021/ac100039c [DOI] [PubMed] [Google Scholar]
- 16.Okagbare P. I., Esmonde-White F. W. L., Goldstein S. A., Morris M. D., “Development of non-invasive Raman spectroscopy for in vivo evaluation of bone graft osseointegration in a rat model,” Analyst (Lond.) 135(12), 3142–3146 (2010). 10.1039/c0an00566e [DOI] [PMC free article] [PubMed] [Google Scholar]
- 17.Esmonde-White K. A., Esmonde-White F. W. L., Holmes C. M., Morris M. D., Roessler B. J., “Alterations to Bone Mineral Composition as an Early Indication of Osteomyelitis in the Diabetic Foot,” Diabetes Care 36(11), 3652–3654 (2013). 10.2337/dc13-0510 [DOI] [PMC free article] [PubMed] [Google Scholar]
- 18.Srinivasan S., Schulmerich M., Cole J. H., Dooley K. A., Kreider J. M., Pogue B. W., Morris M. D., Goldstein S. A., “Image-guided Raman spectroscopic recovery of canine cortical bone contrast in situ,” Opt. Express 16(16), 12190–12200 (2008). 10.1364/OE.16.012190 [DOI] [PMC free article] [PubMed] [Google Scholar]
- 19.Schulmerich M. V., Cole J. H., Dooley K. A., Morris M. D., Kreider J. M., Goldstein S. A., Srinivasan S., Pogue B. W., “Noninvasive Raman tomographic imaging of canine bone tissue,” J. Biomed. Opt. 13(2), 020506 (2008). 10.1117/1.2904940 [DOI] [PMC free article] [PubMed] [Google Scholar]
- 20.Esmonde-White F. W. L., Esmonde-White K. A., Morris M. D., “Exposed and transcutaneous measurement of musculoskeletal tissues using fiber optic coupled Raman spectroscopy,” in BiOS, (International Society for Optics and Photonics, 2010), 75484D. [Google Scholar]
- 21.Demers J.-L., Pogue B., Leblond F., Esmonde-White F., Okagbare P., Morris M., “Acquisition and reconstruction of Raman and fluorescence signals for rat leg imaging,” in SPIE BiOS, (International Society for Optics and Photonics, 2011), 789211. [Google Scholar]
- 22.Sil S., Umapathy S., “Raman spectroscopy explores molecular structural signatures of hidden materials in depth: Universal Multiple Angle Raman Spectroscopy,” Sci. Rep. 4, 5308 (2014). 10.1038/srep05308 [DOI] [PMC free article] [PubMed] [Google Scholar]
- 23.Dehghani H., Eames M. E., Yalavarthy P. K., Davis S. C., Srinivasan S., Carpenter C. M., Pogue B. W., Paulsen K. D., “Near infrared optical tomography using NIRFAST: Algorithm for numerical model and image reconstruction,” Commun. Numer. Methods Eng. 25(6), 711–732 (2009). 10.1002/cnm.1162 [DOI] [PMC free article] [PubMed] [Google Scholar]
- 24.Jermyn M., Ghadyani H., Mastanduno M. A., Turner W., Davis S. C., Dehghani H., Pogue B. W., “Fast segmentation and high-quality three-dimensional volume mesh creation from medical images for diffuse optical tomography,” J. Biomed. Opt. 18(8), 086007 (2013). 10.1117/1.JBO.18.8.086007 [DOI] [PMC free article] [PubMed] [Google Scholar]
- 25.Schulmerich M. V., Dooley K. A., Morris M. D., Vanasse T. M., Goldstein S. A., “Transcutaneous fiber optic Raman spectroscopy of bone using annular illumination and a circular array of collection fibers,” J. Biomed. Opt. 11(6), 060502 (2006). 10.1117/1.2400233 [DOI] [PubMed] [Google Scholar]
- 26.Schulmerich M. V., Cole J. H., Kreider J. M., Esmonde-White F., Dooley K. A., Goldstein S. A., Morris M. D., “Transcutaneous Raman spectroscopy of murine bone in vivo,” Appl. Spectrosc. 63(3), 286–295 (2009). 10.1366/000370209787599013 [DOI] [PMC free article] [PubMed] [Google Scholar]
- 27.Shim M. G., Wilson B. C., Marple E., Wach M., “Study of fiber-optic probes for in vivo medical Raman spectroscopy,” Appl. Spectrosc. 53(6), 619–627 (1999). 10.1366/0003702991947225 [DOI] [Google Scholar]
- 28.Esmonde-White F. W. L., Esmonde-White K. A., Morris M. D., “Minor Distortions with Major Consequences: Correcting Distortions in Imaging Spectrographs,” Appl. Spectrosc. 65(1), 85–98 (2011). 10.1366/10-06040 [DOI] [PMC free article] [PubMed] [Google Scholar]
- 29.Zhao J., Lui H., McLean D. I., Zeng H., “Automated autofluorescence background subtraction algorithm for biomedical Raman spectroscopy,” Appl. Spectrosc. 61(11), 1225–1232 (2007). 10.1366/000370207782597003 [DOI] [PubMed] [Google Scholar]
- 30.Lim L., Nichols B., Rajaram N., Tunnell J. W., “Probe pressure effects on human skin diffuse reflectance and fluorescence spectroscopy measurements,” J. Biomed. Opt. 16(1), 011012 (2011). 10.1117/1.3525288 [DOI] [PMC free article] [PubMed] [Google Scholar]
- 31.Kalender W. A., Felsenberg D., Genant H. K., Fischer M., Dequeker J., Reeve J., “The European Spine Phantom--a tool for standardization and quality control in spinal bone mineral measurements by DXA and QCT,” Eur. J. Radiol. 20(2), 83–92 (1995). 10.1016/0720-048X(95)00631-Y [DOI] [PubMed] [Google Scholar]
- 32.Ookagbare P. I., Morris M. D., “Fluorocarbon fiber-optic Raman probe for non-invasive Raman spectroscopy,” Appl. Spectrosc. 66(6), 728–730 (2012). 10.1366/12-06592 [DOI] [PMC free article] [PubMed] [Google Scholar]
- 33.Soubret A., Ripoll J., Ntziachristos V., “Accuracy of fluorescent tomography in the presence of heterogeneities: study of the normalized Born ratio,” IEEE Trans. Med. Imaging 24(10), 1377–1386 (2005). 10.1109/TMI.2005.857213 [DOI] [PubMed] [Google Scholar]
- 34.Michaelsen K. E., Krishnaswamy V., Shenoy A., Jordan E., Pogue B. W., Paulsen K. D., “Anthropomorphic breast phantoms with physiological water, lipid, and hemoglobin content for near-infrared spectral tomography,” J. Biomed. Opt. 19(2), 026012 (2014). 10.1117/1.JBO.19.2.026012 [DOI] [PMC free article] [PubMed] [Google Scholar]


