ABSTRACT
The purpose of this study was to describe the magnetic resonance imaging (MRI) and computed tomography (CT) findings for solitary fibrous tumors (SFTs) in the extremities in correlation with histopathological findings. Between 2006 and 2013, 6 consecutive patients with SFT in an extremity were studied with MRI (6 patients) and CT (4 patients). Diffusion-weighted images were also performed in 3 patients and dynamic contrast-enhanced CT in 2 patients. All 6 tumors were diagnosed after surgical excision, and the pre-surgical imaging findings were correlated with the histopathological findings. As a result, all 6 patients were female, and each had a clearly palpable, well-circumscribed, round or oval mass adjacent to fascia in an extremity, of less than 10 cm maximum diameter in 5 patients. On MRI, the tumors were iso-intense with muscle on T1-weighted image, and appeared heterogeneous and high-intensity on T2-weighted image. After injection of a contrast agent, the tumors demonstrated strong enhancement. A vascular pedicle was detected in 4 patients with tumors having a maximum diameter more than 5 cm. Diffusion-weighted images demonstrated high signal intensities, and apparent diffusion coefficient values were iso to high compared to muscle (from 1.41–2.10×10⁻³ mm2/s). All the tumors were benign histopathologically and clinically. In 1 patient, the imaging appearance revealed underlying histopathological components, including fibrous-rich, cellular-rich, and myxoid change areas. In conclusion, a SFT in an extremity comprises a well-circumscribed mass adjacent to fascia having a fibrous-dominant area, strong contrast enhancement, and a vascular pedicle.
Key Words: solitary fibrous tumor, extremity, magnetic resonance imaging, diffusion-weighted image, computed tomography
INTRODUCTION
Solitary fibrous tumors (SFTs), which were first described by Klemperer and Rabin in 1931, are a rare group of spindle cell neoplasms of mesenchymal origin.1) SFTs were reported with no gender predilection, and principally affect people in the 5th to 7th decade, but have been reported in all age groups.2-5) They are classified as intermediate malignancies by the WHO classification system, and rarely metastasize.
Although SFTs most commonly occur in the pleura, they have been diagnosed in numerous extrathoracic sites since the 1990s by the use of immunohistochemical studies, such as immunostaining for CD34 molecule.2-16) SFTs in the extremities, which arise most commonly in the thigh, are also rare; therefore, few case reports or case series have been reported previously.2-4, 6-8)
Histopathologically, SFTs are composed of patternless distributions of closely packed spindle cells separated by varying degrees of fibrosis and prominent vascularity comprising numerous small- and medium-sized vessels (so-called "staghorn-shaped").3, 5) Tumors contain fibrous tissue-dominant and cellular-dominant areas. An area of myxoid change is sometimes detected. In addition, most tumors previously diagnosed as hemangiopericytoma are now classified into cellular variants of SFTs.5) Their complicated histopathological heterogeneity makes radiographic images intricate.
In this report, we present the cross-sectional imaging appearance of 6 patients of SFT in an extremity; all underwent magnetic resonance imaging (MRI), and 4 were also assessed by computed tomography (CT). In addition, we compared these radiographic images with the histopathological findings.
MATERIALS AND METHODS
Patients
Between January 2006 and July 2013, 6 consecutive patients presented to our hospital with a solitary fibrous tumor in an extremity. All were female; the median age (range) was 43 (13–78) years.
Imaging and diagnostic studies
All underwent MRI (1.5T or 3T) preoperatively, and excised tumors were diagnosed as a SFT by histopathological and immunohistological study results, including CD34 positivity. In 4 patients, CT was also performed preoperatively, and 2 of those patients underwent dynamic contrast-enhanced CT. MRI studies included axial T1-weighted image (T1WI) and T2-weighted image (T2WI). In 5 patients (all except patient 4), post-contrast fat-suppressed T1WIs in axial, coronal, and sagittal planes were obtained. In addition, a diffusion-weighted image (DWI; b=0, 1000 s/mm2) was obtained in 3 patients (patients 2, 3, and 4). The mean apparent diffusion coefficient (ADC) value of the tumor was obtained as follows: the region of interest encompassing the entire area of the soft tissue mass on a section of maximum area was drawn freehand on the ADC map. We also defined a "vascular pedicle" as large feeding vessels that could be detected in the tumor interstitium and tumor pedicle.4, 5)
These 6 cases were reviewed to consensus by 2 radiologists with 9 and 3 years of experience of interpreting musculoskeletal images.
Our institutional review board approved this retrospective study and waived the requirement for obtaining informed consent from the patients.
RESULTS
Clinical findings and imaging features of these 6 patients are summarized in Table 1 and described in further detail below. None of the 6 patients had an associated paraneoplastic syndrome, such as hypoglycemia, hypertrophic pulmonary osteoarthropathy, or arthralgia. No metastasis was found on initial examinations. All patients underwent surgical excision of the tumors. Neither recurrence nor metastasis was detected during a mean (range) follow-up period of 39.5 (3–72) months after surgery.
Table 1.
Clinical features and imaging findings for six patients of solitary fibrous tumor in an extremity
| Patient | Age/ sex |
Location/ Size (cm) |
Shape/ Margin |
CT findings | MRI findings | Vascular pedicle | ADC value (mm2/s) |
|---|---|---|---|---|---|---|---|
| 1 | 78/F | Right shoulder 9.2×6.3×15.0 | Lobulated Well-circumscribed |
NECT; iso- to low-density DCT; strong enhancement in solid part and nonenhancement in myxoid part, significant tumor vessels |
T1; iso-intensity T2; heterogeneous, low to high intensity Gd; strong enhancement in solid part and nonenhancement in myxoid part |
Yes | NA |
| 2 | 36/F | Right thigh 6.2×3.3×3.0 | Ovary Well-circumscribed |
NECT; low density DCT; strong enhancement from arterial phase |
T1; iso-intensity T2; heterogeneous, high signal area with reticular low signal area Gd; strong enhancement containing reticular low enhancing area |
Yes | 2.10×10⁻³ |
| 3 | 43/F | Right thigh 5.5×3.9×6.1 | Ovary Well-circumscribed |
NECT; iso-density | T1; iso-intensity T2; heterogeneous, low to high intensity Gd; homogeneous, strong enhancement |
Yes | 1.41×10⁻³ |
| 4 | 47/F | Left thigh 3.0×1.6×3.3 | Ovary Well-circumscribed |
NA | T1; iso-intensity T2; homogeneous, high intensity |
No | 1.96×10⁻³ |
| 5 | 13/F | Left upper arm 1.6×1.6×1.6 | Round Well-circumscribed |
NA | T1; iso-intensity T2; heterogeneous, low to moderate intensity Gd; heterogeneous, strong enhancement |
No | NA |
| 6 | 43/F | Left shoulder 3.8×2.5×5.0 | Ovary Well-circumscribed |
NECT; iso-density | T1; iso-intensity T2; heterogeneous, high intensity Gd; homogeneous, strong enhancement |
Yes | NA |
CT: computed tomography, MRI: magnetic resonance imaging, ADC: apparent diffusion coefficient, NECT: non-enhanced CT, DCT: dynamic CT
T1: T1-weighted image, T2: T2-weighted image, Gd: Gadolinium-enhanced fat-suppressed T1-weigthed image, NA: none available
Patient 1
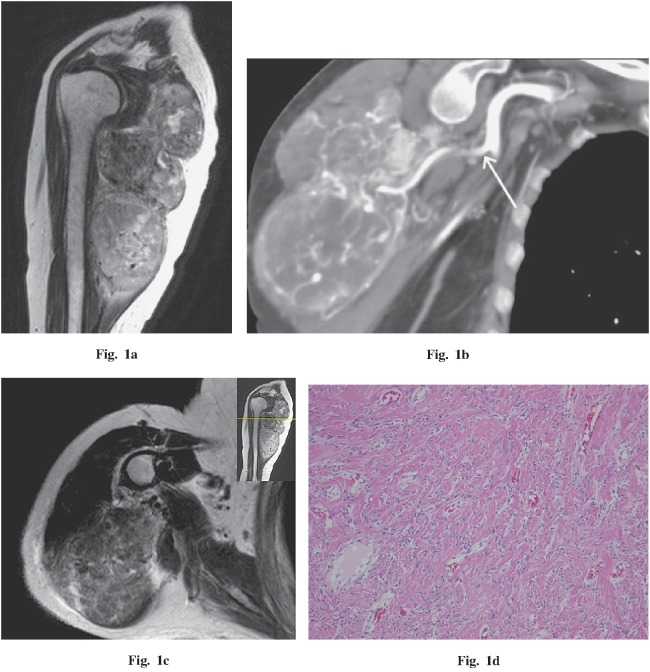
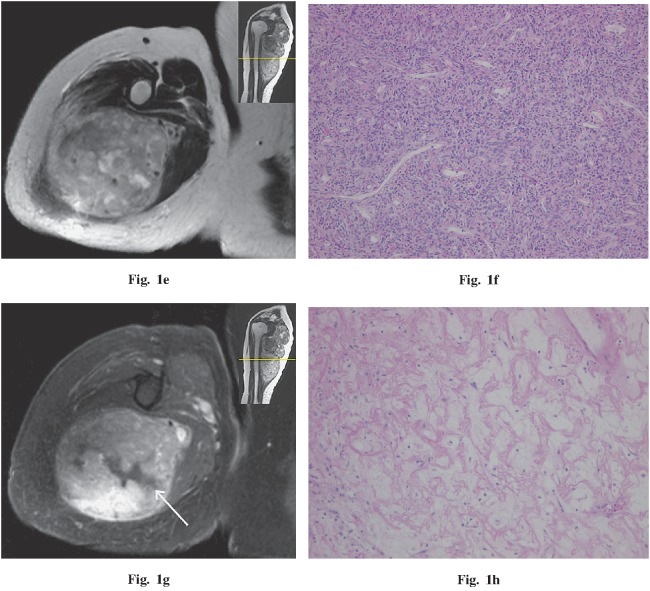
A 78-year-old woman presented with a 10-year history of palpable mass in the right shoulder. The mass had enlarged during the previous year and had been painful for three months. Imaging findings demonstrated a 9.2 × 6.3 × 15.0 cm, well-circumscribed, lobulated mass compressing the triceps brachii and deltoid muscles (Fig. 1a). The mass was of low- to iso-density with muscle on non-enhanced CT, had heterogeneous marked enhancement during the arterial phase of dynamic CT, and had more homogeneous enhancement in the venous phase. A vascular pedicle and tumor vessels also had developed (Fig. 1b). On MRI, the mass was iso-intense with muscle on T1WI. On T2WI, the proximal area of the tumor was mostly low intensity with a circumscribed area of high intensity, and the distal area of the tumor was of moderate to high intensity. On gadolinium administration, the mass had heterogeneous strong enhancement, similar to results of the contrast-enhanced CT. On histopathological examination, a mostly fibrous area corresponded to the low T2 signal area (Fig. 1c, d). In contrast, a predominantly cellular area corresponded to a moderate to high T2 signal area (Fig. 1e, f). Due to prominent vascularity with numerous small- and medium-sized vessels, both areas were markedly enhanced on dynamic contrast-enhanced CT and contrast-enhanced MRI. In addition, an area of myxoid change corresponded to a high T2 signal with no enhancement (Fig. 1g, h). No malignant features were seen on histopathological examinations.
Fig. 1.
A 78-year-old woman with a palpable and painful mass in the right shoulder. a Sagittal T2-weighted image demonstrates a low- to high-intensity, well-circumscribed, lobulated mass compressing the triceps brachii and deltoid muscles. A flow void was detected in the mass. b Coronal oblique CT (arterial phase) demonstrates a vascular pedicle (white arrow) and numerous tumor vessels. c, d Comparing the axial T2-weighted image and histopathology demonstrates that the fibrous area corresponds to the area iso-intense to muscle. e, f Comparing the axial T2-weighted image and histopathology demonstrates that the cellular area corresponds to the moderate to high signal area. g, h Comparing the axial T1 fat-saturated post-gadolinium MR image and histopathology demonstrates that the area of myxoid change corresponds to the area without gadolinium enhancement (g; white arrow). Hematoxylin and eosin stains, 100× magnification.
Patient 2
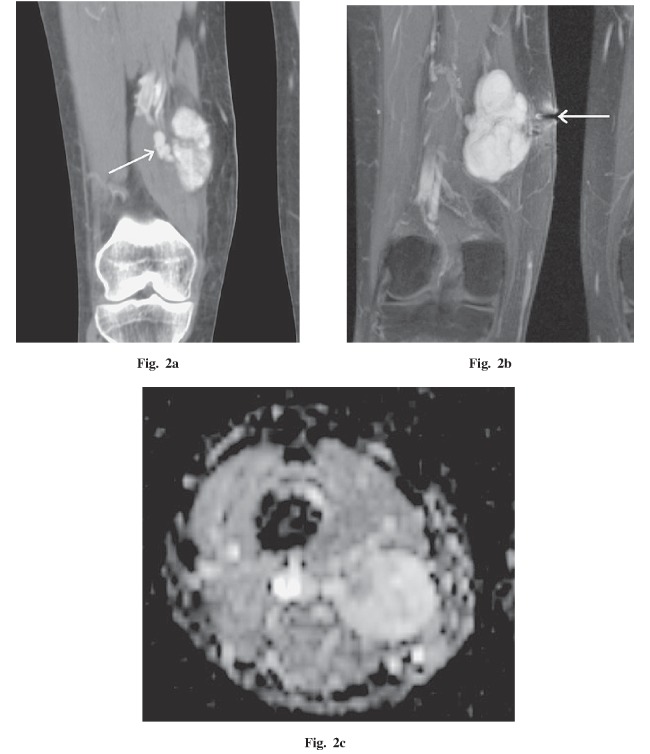
A 36-year-old woman presented with a 3-month history of a palpable, enlarging mass in the right thigh. Imaging findings demonstrated a 6.2 × 3.3 × 3.0 cm, well-circumscribed, oval mass between the medial great and sartorius muscles. The mass appeared less dense than muscle on non-enhanced CT, had heterogeneous marked enhancement during the arterial phase of dynamic CT, and had more homogeneous enhancement in the venous phase. A vascular pedicle was recognized (Fig. 2a). On MRI, the mass was also iso-intense with muscle on T1WI, and mostly high intensity with reticular low intensity on T2WI. After gadolinium administration, the mass was strongly enhanced, but contained reticular low-enhancing areas (Fig. 2b). On DWI (b=1000), this lesion was of high intensity and the ADC map revealed the heterogeneous, high value compared to muscle (Fig. 2c). Therefore, a T2 shine-through effect was suspected. The mean ADC value of this lesion was 2.10 × 10⁻³ mm2 / second. On histopathological examination, the reticular low-intensity area on T2WI corresponded to a fibrous structure; however, the T2 high-intensity area contained fibrous tissues, spindle cells, and myxoid change heterogeneity and we could not identify each component clearly on imaging. No malignant feature was found.
Fig. 2.
A 36-year-old woman with a palpable mass in the right thigh. a Coronal oblique CT (arterial phase) demonstrates a well-circumscribed, markedly enhancing mass between the medial great and sartorius muscles. A vascular pedicle is visible (white arrow). b Coronal T1 fat-saturated post-gadolinium MR image demonstrates strong enhancement, but contains a reticular, low-enhancing area. A biopsy scar is visible outside the tumor (white arrow). c The apparent diffusion coefficient (ADC) map demonstrates a heterogeneous, high value, with a mean of 2.10×10⁻³ mm2 / second.
Patient 3
A 43-year-old woman presented with a 4-year history of a palpable mass in the right thigh. This tumor was followed as a schwannoma at the referring hospital, but pain had developed during the previous year. Imaging findings demonstrated a 5.5 × 3.9 × 6.1 cm, well-circumscribed, oval mass compressing the medial great, sartorius, and adductor longus muscles (Fig. 3a). On non-enhanced CT, the mass was iso-dense with muscle. On MRI, the mass had iso-intensity on T1WI and heterogeneous low to high intensity on T2WI. After gadolinium administration, the mass was strongly enhanced with a vascular pedicle. On DWI (b=1000), this lesion had high intensity and the ADC map revealed it had the same value as muscle (Fig. 3b). The mean ADC value of this lesion was 1.41 × 10⁻³ mm2 / second. By histopathological examination, fibrous tissues, spindle cells, and myxoid change were mixed heterogeneously without a dominant component. No malignant feature was found.
Fig. 3.
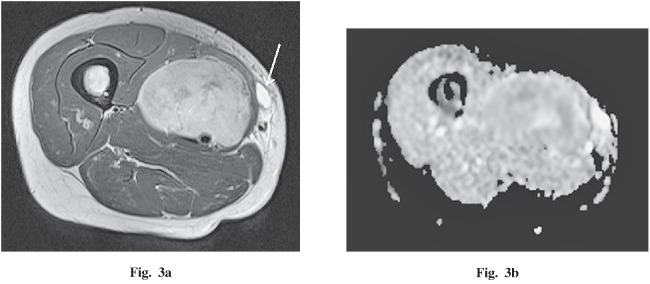
A 43-year-old woman with a palpable and painful mass in the right thigh. a An axial T2-weighted image demonstrates a low- to high-intensity, well-circumscribed, oval mass compressing the medial great, sartorius and adductor longus muscles. A biopsy scar is visible inside the tumor (white arrow). b The apparent diffusion coefficient (ADC) map demonstrates a value similar to muscle, with a mean of 1.41×10⁻³ mm2 / second.
Patient 4
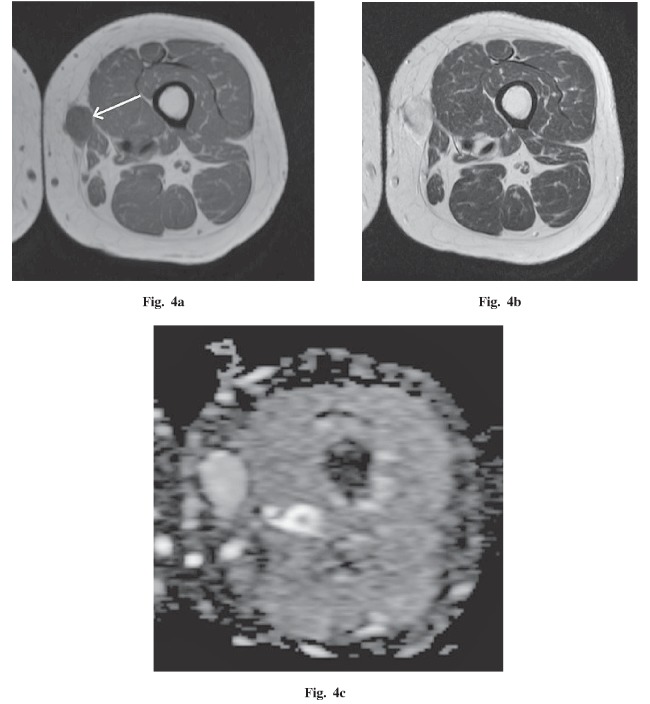
A 47-year-old woman presented with a 2-month history of a palpable, enlarging mass in the left thigh. Imaging findings demonstrated a 3.0 × 1.6 × 3.3 cm, well-circumscribed, oval mass within the subcutaneous tissues adjacent to the medial great and gracilis muscles (Fig. 4a, b). On MRI, the mass was iso-intense with muscle on T1WI, and had homogeneous marked high intensity on T2WI. A vascular pedicle was not visible. On DWI (b=1000), this lesion had high intensity and the ADC map revealed a homogeneous high value compared to muscle (Fig. 4c). The mean ADC value of this lesion was 1.96 × 10⁻³ mm2 / second. By histopathological examination, the tumor was a heterogeneous mix of all components with none dominant. No malignant feature was found.
Fig. 4.
A 47-year-old woman with a palpable mass in the left thigh. a An axial T1-weighted image demonstrates an iso-intense, well-circumscribed, oval mass within the subcutaneous tissues adjacent to the medial great and gracilis muscles (white arrow). b An axial T2-weighted image demonstrates the markedly high intensity of this lesion. c The apparent diffusion coefficient (ADC) map demonstrates a homogeneous, high value compared to muscle, with a mean of 1.96×10⁻³ mm2 / second.
Patient 5
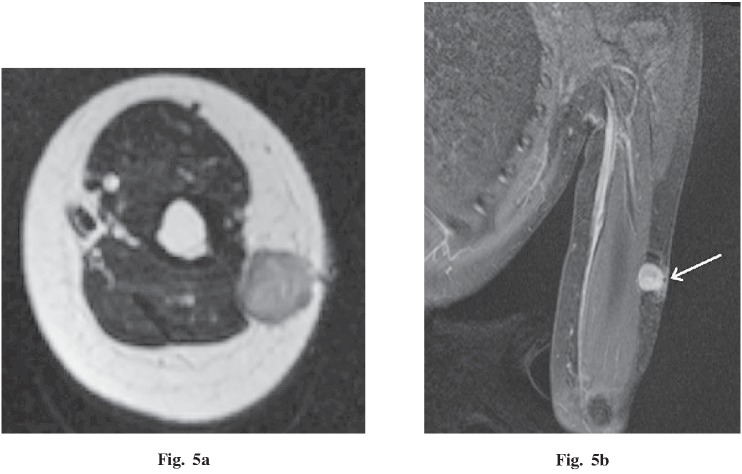
A 13-year-old female presented with a 4-month history of a palpable, enlarging mass in the left upper arm. Imaging findings demonstrated a 1.6 × 1.6 × 1.6 cm, well-circumscribed, round mass within the subcutaneous tissues adjacent to the triceps brachii muscle (Fig. 5a). On MRI, the mass was homogeneously iso-intense with muscle on T1WI, and had low to moderate intensity on T2WI. After gadolinium administration, the mass had heterogeneous, strong enhancement (Fig. 5b). A vascular pedicle was not visible. By histopathological examination, the low-intensity area on T2WI corresponded to a mostly fibrous area and the moderately intense area corresponded to a mostly cellular area. No malignant feature was found.
Fig. 5.
A 13-year-old female with a palpable mass in the left upper arm. a An axial T2-weighted image demonstrates an iso- to moderate-intensity, well-circumscribed, round mass within the subcutaneous tissues adjacent to the triceps brachii muscle. b Coronal T1 fat-saturated post-gadolinium MR image demonstrates the strong enhancement of this lesion. A biopsy scar is visible outside the tumor (white arrow).
Patient 6
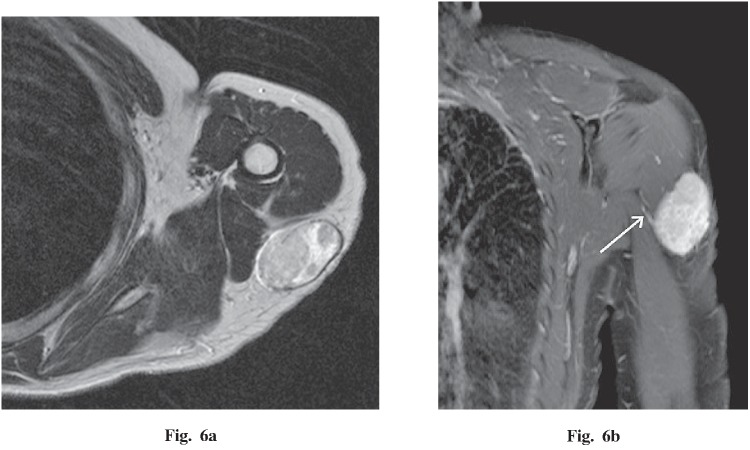
A 43-year-old woman presented with a 1-year history of a palpable mass in the left shoulder. Imaging findings demonstrated a 3.8 × 2.5 × 5.0 cm, well-circumscribed, oval mass within the subcutaneous tissues adjacent to the deltoid and triceps brachii muscles (Fig. 6a). On non-enhanced CT, the mass was iso-dense with muscle. On MRI, the mass had iso-intensity on T1WI and heterogeneous, high intensity on T2WI. After gadolinium administration, the mass was strongly enhanced with a small vascular pedicle (Fig. 6b). By histopathological examination, the tumor was a heterogeneous mixture without a dominant component. No malignant feature was found.
Fig. 6.
A 43-year-old woman with a palpable mass in the left shoulder. a An axial T2-weighted image demonstrates a heterogeneous, high-intensity, well-circumscribed, oval mass within the subcutaneous tissues adjacent to the deltoid and triceps brachii muscles. b Coronal T1 fat-saturated post-gadolinium MR image demonstrates strong enhancement and a small vascular pedicle (white arrow).
DISCUSSION
The 6 SFT patients in this report were all female, and each had a well-circumscribed, round or oval mass adjacent to fascia in an extremity. On MRI, the tumors were iso-intense with muscle on T1WI and had heterogeneous, high intensity on T2WI. Some patients had low-intensity areas on T2WI, which indicated fibrous tissue-dominant areas. After administration of contrast media, the tumors were heterogeneously or homogeneously, strongly enhanced. In addition, in 2 patients, dynamic contrast-enhanced CT demonstrated heterogeneous, marked enhancement in the arterial phase, and more homogeneous enhancement in the venous phase. A vascular pedicle was detected in 4 patients with the maximum tumor diameter more than 5 cm. On DWI, 3 patients had high signal intensity, and similar or higher values compared to muscle on the ADC map. These 6 tumors were benign histopathologically and clinically.
Pleural SFTs are more common, but intra- and extrathoracic SFTs are the same tumor histopathologically. Pleural SFTs tend to be small because of early diagnosis by chest X-ray, whereas SFTs in the soft tissue are relatively large. Most of these 6 tumors were small masses, with a diameter of less than 10 cm, and were palpable. They were smaller than the SFTs of previous reports.4, 6, 7) This may be because SFTs in the extremities tend to be palpable even if the size is small; previous reports included SFTs in the extremities and also in the pelvis, retroperitoneum, or buttocks, which are less palpable when the tumor size is small, becoming palpable and symptomatic only after enlarging. Concurrent paraneoplastic syndromes, such as hypoglycemia, hypertrophic pulmonary osteoarthropathy, or arthralgia, have been reported; however, none was present in any of the current 6 patients.2, 5)
On MRI, SFTs usually appear homogenously iso-intense with muscle on T1WI and contain various signals on T2WI, from low to high intensity, reflecting the underlying histopathology.2, 5, 6) A low T2 signal indicates an area of dense fibrous tissue, whereas moderate to high T2 signals indicate higher cellularity with less fibrosis. In addition, myxoid change produces markedly high intensity on T2WI and loss of enhancement after injection of the contrast agent.5) Findings in these 6 cases mostly corresponded to those of previous reports; however, only the tumor of patient 1 was clearly identifiable with imaging about various tumor components. The other 5 tumors also contained various tissues, identified histopathologically, but not discerned clearly with imaging because each area was too small to identify.
It has been reported that the focal or diffuse moderate to strong enhancement of SFTs on contrast-enhanced MRI and CT is due to the corresponding hemangiopericytoma-like vessels seen on histopathological examination.2, 5, 7) All 5 of the current cases who underwent contrast-enhanced MRI (including the 2 who also had dynamic contrast-enhanced CT) had tumors with heterogeneous or homogeneous strong enhancement. In addition, in previously reported studies, vascular-rich areas had early enhancement and fibrous-rich areas had slow, progressive enhancement, which corresponded to findings in our 2 patients who underwent dynamic contrast-enhanced CT.5, 7) Wignall et al. reported that 35% of soft tissue SFTs had vascular pedicles and that this finding is helpful to narrow the differential diagnosis.4) In the present report, a vascular pedicle was detected in 4 cases, but was not found in association with the smaller tumors. Unfortunately, characteristic findings, such as identification of tumor components and a vascular pedicle, tended not to be demonstrated for the smaller tumors.
There are few previous reports regarding DWI and ADC values of SFTs.12-17) To our knowledge, there has been only one such previous report regarding an SFT in a limb—a malignant hemangiopericytoma.17) In the current study, the tumors of patients 2, 3, and 4 had high intensity on DWI and similar or higher values on the ADC map, compared to muscle. The findings suggest a T2 shine-through effect, which means high signal on DWI images that is not due to restricted diffusion, but rather to high T2 signal. The ADC values of these 3 cases were relatively high, but differed fairly widely (from 1.41–2.10 × 10⁻³ mm2 / second). In addition, the tumors of patients 2 and 3 were heterogeneous on the ADC map and had partially similar values to muscle. These areas were of low intensity on T2WI, which indicated they were fibrous-rich areas. In a past report, Inaoka et al. compared the ADC map with the histopathological findings of a thoracic SFT, and reported that the area of low ADC values (1.12–1.19 × 10⁻³ mm2 / second) corresponded to an area of histopathological malignancy.12) In most previous reports regarding soft tissue tumors, however, ADC values and malignancy did not always correlate because of the presence of myxoid change, as detected by histopathology.18-21) Myxoid change in soft tissue SFTs, if not detected at imaging, may make the ADC value higher. In fact, the tumor of current patient 2 had abundant myxoid change areas not detected on imaging. Furthermore, SFTs have numerous dilated vessels, which can also make ADC values higher. The 3 patients in the current study who underwent DWI analysis had benign tumors; therefore, we cannot comment on using the ADC value to evaluate the malignant potential. Thus, the significance of the ADC value of SFTs in the extremities is uncertain, and the accumulation of the further data is necessary.
CONCLUSION
We have presented 6 cases of SFTs in the extremities. An SFT in an extremity is often detected as a nonspecific palpable mass. SFT should be included in the differential diagnosis of a well-circumscribed mass adjacent to the fascia, with presence of a fibrous-dominant area, strong contrast enhancement, and a vascular pedicle. The usefulness of the ADC map for SFTs in the extremities is currently restricted, and accumulation of further data is necessary.
CONFLICT OF INTEREST
The authors have no conflict of interest.
REFERENCE
- 1).Klemperer P, Rabin C. Primary neoplasms of the pleura: a report of five cases. Arch Pathol, 1931: 385–412. [DOI] [PubMed]
- 2).Ginat DT, Bokhari A, Bhatt S, Dogra V. Imaging features of solitary fibrous tumors. AJR Am J Roentgenol, 2011; 196: 487–495. [DOI] [PubMed]
- 3).Gold JS, Antonescu CR, Hajdu C, Ferrone CR, Hussain M, Lewis JJ, Brennan MF, Coit DG. Clinicopathologic correlates of solitary fibrous tumors. Cancer, 2002; 94: 1057–1068. [PubMed]
- 4).Wignall OJ, Moskovic EC, Thway K, Thomas JM. Solitary fibrous tumors of the soft tissues: review of the imaging and clinical features with histopathologic correlation. AJR Am J Roentgenol, 2010; 195: W55–62. [DOI] [PubMed]
- 5).Musyoki FN, Nahal A, Powell TI. Solitary fibrous tumor: an update on the spectrum of extrapleural manifestations. Skeletal Radiol, 2012; 41: 5–13. [DOI] [PubMed]
- 6).Garcia-Bennett J, Olive CS, Rivas A, Dominguez-Oronoz R, Huguet P. Soft tissue solitary fibrous tumor. Imaging findings in a series of nine cases. Skeletal Radiol, 2012; 41: 1427–1433. [DOI] [PubMed]
- 7).Papathanassiou ZG, Alberghini M, Picci P, Staals E, Gambarotti M, Garaci FG, Vanel D. Solitary fibrous tumors of the soft tissues: imaging features with histopathologic correlations. Clin Sarcoma Res, 2013; 3: 1. [DOI] [PMC free article] [PubMed]
- 8).Rakheja D, Wilson KS, Meehan JJ, Schultz RA, Maale GE, Timmons CF. Extrapleural benign solitary fibrous tumor in the shoulder of a 9-year-old girl: case report and review of the literature. Pediatr Dev Pathol, 2004; 7: 653–660. [DOI] [PubMed]
- 9).Cox DP, Daniels T, Jordan RC. Solitary fibrous tumor of the head and neck. Oral Surg Oral Med Oral Pathol Oral Radiol Endod, 2010; 110: 79–84. [DOI] [PubMed]
- 10).Rosenkrantz AB, Hindman N, Melamed J. Imaging appearance of solitary fibrous tumor of the abdominopelvic cavity. J Comput Assist Tomogr, 2010; 34: 201–205. [DOI] [PubMed]
- 11).Shanbhogue AK, Prasad SR, Takahashi N, Vikram R, Zaheer A, Sandrasegaran K. Somatic and visceral solitary fibrous tumors in the abdomen and pelvis: cross-sectional imaging spectrum. Radiographics, 2011; 31: 393–408. [DOI] [PubMed]
- 12).Inaoka T, Takahashi K, Miyokawa N, Ohsaki Y, Aburano T. Solitary fibrous tumor of the pleura: apparent diffusion coefficient (ADC) value and ADC map to predict malignant transformation. J Magn Reson Imaging, 2007; 26: 155–158. [DOI] [PubMed]
- 13).El-Khouli RH, Geschwind JF, Bluemke DA, Kamel IR. Solitary fibrous tumor of the liver: magnetic resonance imaging evaluation and treatment with transarterial chemoembolization. J Comput Assist Tomogr, 2008; 32: 769–771. [DOI] [PubMed]
- 14).Kandpal H, Sharma R, Gupta SD, Kumar A. Solitary fibrous tumour of the liver: a rare imaging diagnosis using MRI and diffusion-weighted imaging. Br J Radiol, 2008; 81: e282–286. [DOI] [PubMed]
- 15).Clarencon F, Bonneville F, Rousseau A, Galanaud D, Kujas M, Naggara O, Cornu P, Chiras J. Intracranial solitary fibrous tumor: imaging findings. Eur J Radiol, 2011; 80: 387–394. [DOI] [PubMed]
- 16).Yang BT, Wang YZ, Dong JY, Wang XY, Wang ZC. MRI study of solitary fibrous tumor in the orbit. AJR Am J Roentgenol, 2012; 199: W506–511. [DOI] [PubMed]
- 17).Razek A, Nada N, Ghaniem M, Elkhamary S. Assessment of soft tissue tumours of the extremities with diffusion echoplanar MR imaging. Radiol Med, 2012; 117: 96–101. [DOI] [PubMed]
- 18).Einarsdottir H, Karlsson M, Wejde J, Bauer HC. Diffusion-weighted MRI of soft tissue tumours. Eur Radiol, 2004; 14: 959–963. [DOI] [PubMed]
- 19).Maeda M, Matsumine A, Kato H, Kusuzaki K, Maier SE, Uchida A, Takeda K. Soft-tissue tumors evaluated by line-scan diffusion-weighted imaging: influence of myxoid matrix on the apparent diffusion coefficient. J Magn Reson Imaging, 2007; 25: 1199–1204. [DOI] [PubMed]
- 20).Nagata S, Nishimura H, Uchida M, Sakoda J, Tonan T, Hiraoka K, Nagata K, Akiba J, Abe T, Hayabuchi N. Diffusion-weighted imaging of soft tissue tumors: usefulness of the apparent diffusion coefficient for differential diagnosis. Radiat Med, 2008; 26: 287–295. [DOI] [PubMed]
- 21).van Rijswijk CS, Kunz P, Hogendoorn PC, Taminiau AH, Doornbos J, Bloem JL. Diffusion-weighted MRI in the characterization of soft-tissue tumors. J Magn Reson Imaging, 2002; 15: 302–307. [DOI] [PubMed]


