Abstract
Perilipin-1 is a lipid droplet coat protein predominantly expressed in adipocytes, where it inhibits basal and facilitates stimulated lipolysis. Loss-of-function mutations in PLIN1 were recently reported in patients with a novel subtype of familial partial lipodystrophy, designated as FPLD4. We now report the identification and characterization of a novel heterozygous frameshift mutation affecting the carboxy-terminus (439fs) of perilipin-1 in two unrelated families. The mutation co-segregated with a similar phenotype including partial lipodystrophy, severe insulin resistance and type 2 diabetes, extreme hypertriglyceridaemia and non-alcoholic fatty liver disease in both families. Poor metabolic control despite maximal medical therapy prompted two patients to undergo bariatric surgery, with remarkably beneficial consequences. Functional studies indicated that expression levels of the mutant protein were lower than wild type protein and in stably tranfected pre-adipocytes the mutant protein was associated with smaller lipid droplets. Interestingly, unlike the previously reported 398 and 404 frameshift mutants, this variant binds and stabilizes ABHD5 expression, but still fails to inhibit basal lipolysis as effectively as wild type perilipin-1. Collectively, these findings highlight the physiological need for exquisite regulation of neutral lipid storage within adipocyte lipid droplets, as well as the possible metabolic benefits of bariatric surgery in this serious disease.
Introduction
Adipocytes within white adipose tissue are uniquely adapted to storing large quantities of triglyceride in a single unilocular lipid droplet, providing a highly economical mechanism for surplus energy storage. Perilipin-1 is the most abundant phosphoprotein in adipocytes, where it constitutively associates with the phospholipid surface monolayer of the lipid droplet [1]. Here it regulates lipases, particularly adipose tissue triglyceride lipase (ATGL) and hormone sensitive lipase (HSL). ATGL and HSL catalyze the sequential hydrolysis of tri- and then diacylglycerol, releasing fatty acids and monoacylglycerol which undergoes a final hydrolytic cleavage step by monoacylglycerol lipase (MGL) [2]. Precise regulation of this process is a major factor in determining the efficacy of adipose tissue as a lipid buffer in the fed state and then subsequently as a source of lipid fuel in the fasting state or during exercise.
The importance of perilipin-1 function in human metabolism was very recently highlighted by the discovery of two heterozygous PLIN1 frameshift mutations affecting the C-terminus of the protein in patients with FPLD4 [3]. Both mutations co-segregated with partial lipodystrophy, severe insulin resistance, hepatic steatosis and severe dyslipidaemia in three French families. Molecular characterization of these mutations demonstrated the inability of both mutants to inhibit basal lipolysis. In each case this was attributable to the failure of the proteins to effectively prevent ABHD5 (αβ-hydrolase domain containing 5), a co-activator of ATGL, from activating ATGL and thus increasing basal lipolysis [4]. Here we report the identification, clinical characterization and functional analysis of a third PLIN1 heterozygous mutation.
Experimental procedures
Genetic analysis
The study was conducted in accordance with the principles of the Declaration of Helsinki and was approved by the UK National Health Service Research Ethics Committee. Each participant, or a parent in the case of minors, provided written informed consent; minors provided oral consent.
Genomic DNA was isolated from peripheral-blood leukocytes. After excluding mutations in the coding regions and splice junctions of LMNA and PPARG, the coding regions and splice junctions of PLIN1 were amplified by PCR and sequenced as described previously [3].
Clinical and biochemical studies
Blood samples for biochemical assays were taken after an overnight fast. Patients underwent skin fold measurements using calipers; results were expressed as the mean of two independent measurements and compared to previously reported reference ranges [5]. Dual energy X-ray absorptiometry (DEXA) (Lunar Prodigy DXA scanner, software version 12.20) was used to evaluate body composition.
Cloning strategy
Site-directed mutagenesis was performed on pCR-BluntII-TOPO PLIN1 WT [3] using QuikChange II XL Site-Directed Mutagenesis Kit (Agilent Technologies) to generate the PLIN1 p.Pro439ValfsX125 (from here onwards referred to as PLIN1 439fs) mutant using the following set of primers 5′-CGGAGCGCAGAGCGTCGGGCGCCGTCCGCCGG-3′ and 5′-CCGGCGGACGGCGCCCGACGCTCTGCGCTCCG-3′. For the generation of stable cell lines, a N-terminally Myc-tagged PLIN1 439fs mutant sequence was subcloned using SalI restriction enzyme sites into the retroviral expression vector pBABEpuro (Clontech) harboring a puromycin resistance cassette. For transient transfections the same sequence was subcloned into pc-NA3.1 vector using EcoRV-XbaI restriction sites. For bimolecular fluorescence complementation (BiFC) assays, pcDNA 3.1 mycPLIN1-439fs-Yc was cloned in frame with the C-terminal Yc fragment in previously generated pc-NA3.1-Yc using EcoRV-BlpI [4]. The following constructs pc-NA3.1-Yc, pc-NA3.1-Yn, pcDNA3.1 –Yn-hABHD5, pc-NA3.1-hATGL(S47A)-Yc and pc-NA3.1-MycPLIN1-398fs-Yc were previously generated as described in [3, 4].
Cell culture
Stable cell lines were generated and maintained as described in [3]. In order to study the effects of PLIN1 439fs in the presence of WT perilipin-1, a previously described 3T3-L1 pre-adipocyte stable cell line expressing pLXSN-Flag-PLIN1-WT [3] was subjected to a second round of retrovirus transduction with pBABEpuro-myc-PLIN1-WT or mutants.
qRT-PCR
mRNA was harvested and extracted using a RNeasy Mini Kit (QIAGEN). cDNA synthesis was performed using the Superscript II reverse transcriptase enzyme (Invitrogen). Quantitative real time-PCR was performed using an ABI TaqMan master mix according to the manufacturer’s protocols. The following primer sets were used: hPLIN1 (forward, 5′-CCCCCTGAAAAGATTGCTTCT-3′; reverse, 5′-GGAACGCTGATGCTGTTTCTG-3′; probe, 5′FAM-CATCTCCACCCGCCTCCGCA TAMRA-3′), PPIA (forward, 5′TTCCTCCTTTCACAGAATTATTCCA-3′; (reverse, 5′-CCGCCAGTGCCATTATGG-3′; probe, 5′FAM-6ATTCATGTGCCAGGGTGGTGACTTTACAC-TAMRA-3′). Results were analysed on an ABI PRISM 7900HT (Applied Biosystems) and normalized to housekeeping gene (Cyclophilin A) expression levels.
Western Blotting
For patient adipose tissue protein expression analysis, tissue was homogenized in liquid nitrogen and directly lysed in RIPA buffer (SIGMA) containing protease and phosphatase inhibitors (Roche). Protein was quantified using Bio-Rad DC protein quantification kit and 10 μg of protein lysate was diluted in NuPAGE 4xLDS sample buffer (Invitrogen) containing 0.05% β-mercaptoethanol and subjected to SDS-PAGE, following transfer onto a nitrocellulose membrane. Following transfer, membranes were washed in Tris-buffered saline containing 0.1% TWEEN-20 (TBS-T; Sigma-Aldrich), then blocked for 1 hour at room temperature (RT) in 3% bovine serum albumin (BSA) or 5% powdered skimmed milk diluted in TBS-T. Membranes were further incubated with appropriate primary antibody diluted in blocking buffer for 16 hours at 4°C. The following antibodies were used: Perilipin-1 N-terminal antibody (GP29, Progen), Perilipin-1 C-terminal antibody (Abcam), Perilipin-2 (GP40, Progen) Myc (Milipore), Flag (Sigma), ABHD5 (Abnova), Calnexin (Abcam) or β-actin (Abcam). For cellular protein extracts 50 μg of lysate was subjected to SDS-PAGE.
Estimation of protein degradation
3T3-L1 pre-adipocytes stably expressing either WT or 439fs perilipin-1 were grown until confluency and treated with either DMSO as a control or 100 μg/ml cycloheximide, 10 μM MG132 and 25 mM NH4Cl for indicated times before lysis.
Microscopy studies
For microscopy studies, cells were seeded into 12-well plates containing slides previously rinsed in 70% ethanol. Cells were harvested by rinsing 3 times in PBS and fixing with 4% formaldehyde diluted in PBS for 15 minutes (min) at RT. Membrane permeabilisation was achieved with 0.5% Saponin for 10 min, followed by blocking in 3% BSA, 0.05% Tween-20 PBS for 1 hour. Afterwards cells were incubated with primary antibody diluted in blocking buffer for 16 hours at 4°C. Then cells were washed 3 times in 0.1% BSA PBS and incubated with fluorescent probe conjugated secondary antibody for 1 hour at RT wrapped in foil. Where necessary, cells were stained for neutral lipid, by rinsing 3 more times with 0.1% BSA-PBS and adding LipidTox Deep Red reagent (Invitrogen) diluted in PBS [1:1000] for 20 min at RT. Afterwards cells were rinsed in PBS and slides mounted using ProLong Gold antifade mounting reagent with DAPI (Invitrogen) for nuclear staining.
Lipid droplet volume measurements
3T3-L1 pre-adipocytes were treated with 400 μM oleic acid (Sigma) for 48 hours and harvested for microscopy studies as described above. LipidTox Deep Red was used to stain neutral lipids within lipid droplets, and anti-Myc primary antibody [1:500] dilution in 3% BSA, followed by goat anti-mouse Alexa-Fluor-488 fluorescent secondary antibody was used for perilipin-1 staining. Cell imaging was performed on a Zeiss LSM 510 Meta confocal microscope using the Zen software package (Carl Zeiss Microimaging GmbH). On average 10 Z-stack images were taken per sample using the 63× objective and lipid droplet volume was measured using Volocity 5 software (Perkin Elmer).
Lipolysis
Lipolysis experiments were performed as described in [4] in the presence of 6 μM Triascin C in order to prevent fatty acid re-esterification. Lipolysis was expressed as a ratio of the amount of radioactivity released into the medium over the total amount of incorporated radioactivity.
Bimolecular Fluorescence complementation (BiFC)
BiFc experiments and signal quantification were performed in cos 7 cells as described in [4, 6]. In cells expressing perilipin-1 (WT or mutants), ATGL(S47A)-Yc and ABHD5-Yn, total YFP signal was normalised to control cells only expressing ATGL(S47A)-Yc and ABHD5-Yn. All components were normalized for equal protein expression in these experiments.
Statistical analysis
Quantitative data are presented as mean ± SEM. One-way or two-way analysis of variance with post hoc Bonferroni analyses were performed on data at a minimum P<0.05.
Results
Case studies
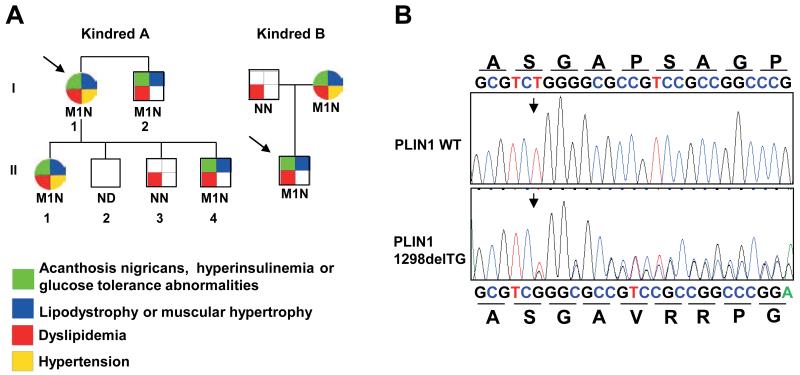
Proband A, a 41-year old Caucasian woman (Figure 1A, I.1), was referred to specialist physicians in Sydney in 1998 with a ten year history of type 2 diabetes, complicated by diabetic retinopathy, extreme hypertriglyceridaemia leading to recurrent pancreatitis, non-alcoholic fatty liver disease (NAFLD; visualized on ultrasound and CT (computerized tomography)) and hypertension. She also had new-onset exercise intolerance (exertional dyspnea without chest pain) and muscle cramping. Her diabetes was suboptimally controlled despite high dose insulin therapy (>500 units daily). Insulin resistance was confirmed by a hyperinsulinaemic-euglycaemic clamp (glucose infusion rate 10.6 μm/min/kg fat free mass). The patient had no history of polycystic ovarian syndrome (PCOS) and no difficulty conceiving as is apparent from 4 successful pregnancies. Her first pregnancy was uncomplicated but her second child was delivered early because of large size for gestational age. The diagnosis of diabetes was made after her third pregnancy.
Figure 1. A heterozygous PLIN1 439fs mutation co-segregates with insulin-resistant diabetes, dyslipidemia and partial lipodystrophy.
A) Family pedigrees of probands A and B showing co-segregation of p.Pro439ValfsX125 with insulin resistance, dyslipidemia, lipodystrophy and, to a lesser extent, hypertension. M1 denotes PLIN1 p.Pro439ValfsX125 mutation, N- wild type and ND- not determined. Probands are denoted by an arrow. B) Sequence chromatogram confirming deletion of a TG base pair within exon nine (nucleotide 1298) and the predicted consequences of this mutation on the amino acid sequence of perilipin-1.
Her BMI was 31.2 kg/m2 and waist circumference 93 cm. Lipoatrophy was most notable in the femorogluteal depot and lower limbs, with abdominal fat largely preserved (Supplementary figure 1). Skin-fold measurements (Supplementary figure 2) confirmed excess subcutaneous truncal fat and reduced peripheral fat. In addition, DEXA scan (dual energy X-ray absorptiometry) confirmed disproportionate fat loss on the limbs (Table 1). Her cardiovascular and respiratory examinations were normal. There were no dysmorphic features.
Table 1. Clinical and biochemical characterization of probands and relatives with the PLIN1 439fs mutation.
| Proband A | I.2 | II.1 | II.4 | Proband B | Mother | Reference Range | |
|---|---|---|---|---|---|---|---|
| PLIN1 mutation | 439fs | 439fs | 439fs | 439fs | 439fs | 439fs | |
| Age (years) | 56 | 55 | 38 | 18 | 15 | 48 | |
| Gender | Female | Male | Female | Male | Male | Female | |
| BMI (kg/m2) | 31.2 | 25.4 | 30.4 | 29.1 | 25.1 | 21.8 | |
| Fat distribution | Limb and femorogluteal lipodystrophy | Limb and femorogluteal lipodystrophy | Limb and femorogluteal lipodystrophy | Limb and femorogluteal lipodystrophy | Limb and femorogluteal lipodystrophy | Limb and femorogluteal lipodystrophy | |
| Polycystic ovary syndrome | - | NA | + | NA | NA | + | |
| Fatty Liver | + | ND | + | ND | + | + | |
| Pancreatitis | + | - | - | - | - | + | |
| Cardiomyopathy | + | - | - | - | - | + | |
| DEXA FMR | 1998- 1.4; 2005- 1.9; 2010- 1.9 | 2.2 | ND | ND | ND | ND | Lipodystrophy if FMR>1.2 |
| Total Cholesterol (mmol/L) | 10.5 | 4.6 | 5.5 | 4.1 | 4.4 | 3.0 | <5.2 |
| Triglyceride (mmol/L) | 56.1 | 2 | 6.1 | 2.3 | 26.3 | 2.2 | <1.7 |
| HbA1c (mmol/mol) (%) | 63 (7.9%) | 79 (9.4%) | 59 (7.5%) | 51 (6.8%) | 32 (5.1%) | 97 (11.0%) | <53.0 (7.0%) |
| Glucose (mmol/L) | 11.3 | 6.4 | ND | 4.8 | 5.1 | 14.4 | <6.1 |
| Insulin (pmol/L) | ND | 17 | ND | ND | 285 | 169 | <60 |
| Leptin (ng/mL) | 2.9 | 2.8 | 3.8 | ND | 2.1 | 3.6 | 3.7-11.1 |
BMI, body mass index; NA, not applicable; ND, not determined; DEXA, dual X–ray absorptiometry; FMR ,Fat Mass Ratio (% fat trunk to % fat lower limb ratio);
Biochemical investigations revealed severe hypertriglyceridaemia and suboptimal glycemic control (Table 1). Her lipoprotein-a level was elevated at 680 mg/L (<300) and leptin level was low (Table 1). An echocardiogram revealed a reduced ejection fraction of 30% and a coronary angiogram showed an occluded right coronary artery. Nerve conduction studies and electromyography were reported as normal, with only occasional small atrophic fibres. A deltoid muscle biopsy was normal.
The patient’s eldest daughter, now aged 38 (Figure 1A, II.1), was diagnosed with PCOS, dyslipidaemia, fatty liver disease (ultrasound), hypertension and type 2 diabetes at age 24 years. She was initially managed with metformin, but required >500 units/day of insulin during the later stages of her first pregnancy, during which she weighed up to 120kg (BMI 40.1 kg/m2). She has had four pregnancies, all of which were complicated by hypertension, necessitating hospital admission in two pregnancies. All four children are well and have not been tested for diabetes.
The proband’s oldest son (Figure 1A, II.2) has a lipodystrophic phenotype and a BMI of 29.1 kg/m2 but has not been genetically tested or assessed for diabetes or dyslipidaemia. Her middle son (Figure 1A, II.3), aged 33, is centrally obese with a BMI of 39 kg/m2, diabetes and mild hypertriglyceridemia. Her youngest son, aged 18 years (Figure 1A, II.4), has type 2 diabetes, managed with oral medication, and a BMI of 29.1 kg/m2. The proband’s brother, aged 55 (BMI of 25.3 kg/m2, Figure 1A, I.2), also has diabetes, a fat mass ratio (FMR) of 2.2 and skinfold measurements consistent with a lipodystrophic phenotype (Figure 1A).
In 2005, proband A underwent Roux-en-Y gastric bypass surgery in an effort to improve her glycaemic control and hypertriglyceridemia. This resulted in a 20 kg weight loss, substantial reduction in insulin requirements (from 500- to 100 units/day), improved lipid profile and reversal of cardiomyopathy on echoardiography. The patient’s daughter also underwent Roux-en-Y bypass surgery, resulting in a 55 kg loss of weight (BMI then 22.4 kg/m2), cessation of insulin, a subsequent twin birth and two further successful uncomplicated pregnancies. In the past 2 years, the proband has been diagnosed with a popliteal artery aneurysm, requiring surgical repair and vascular stenting. Her diabetes is currently treated with a lower dose of insulin and a very low fat diet. Hypertriglyceridaemia is controlled with gemfibrozil and maxepa. Her echocardiogram is now within normal limits, with an ejection fraction increasing from 30% to 59%.
Proband B, an unrelated 15 year-old boy of Caucasian origin, presented with acanthosis nigricans, hepatomegaly and NAFLD (Figure 1A). His BMI was 25.1 kg/m2 (SDS 1.51) with central adiposity (waist to height ratio 0.54, normal <0.5) and a striking paucity of limb fat. Biochemical investigations showed severe hypertriglyceridaemia with normal total cholesterol and low HDL cholesterol levels (0.4 mmol/L). An oral glucose tolerance test confirmed the presence of extreme insulin resistance. He had impaired glucose tolerance with a 2 hour glucose level of 10.7 mmol/L and an astonishing peak insulin level of 12 396 pmol/L. His leptin level was low (Table 1). Liver biopsy confirmed significant hepatic steatosis.
The patient’s mother had been diagnosed with PCOS, treated with metformin since age 25 years, and required in vitro fertilisation for her first pregnancy at age 28 years. She was subsequently diagnosed with type 2 diabetes requiring >200 units of insulin daily during pregnancy. She continued to have poor glycaemic control, microalbuminuria and NAFLD complicated by cirrhosis (on liver biopsy). Lipoatrophy was first recognised clinically in her early 40s affecting her limbs and buttocks, with mild central adiposity and prominent deltoid, gluteal and calf muscles. She had coarse facial features and androgenic alopecia. She was lean (BMI 21.8 kg/m2) and her leptin level was low (Table 1). His father was obese (BMI 37 kg/m2) with associated dyslipidaemia, but did not have features of severe insulin resistance (Figure 1A).
Identification of a novel PLIN1 p439fs mutation
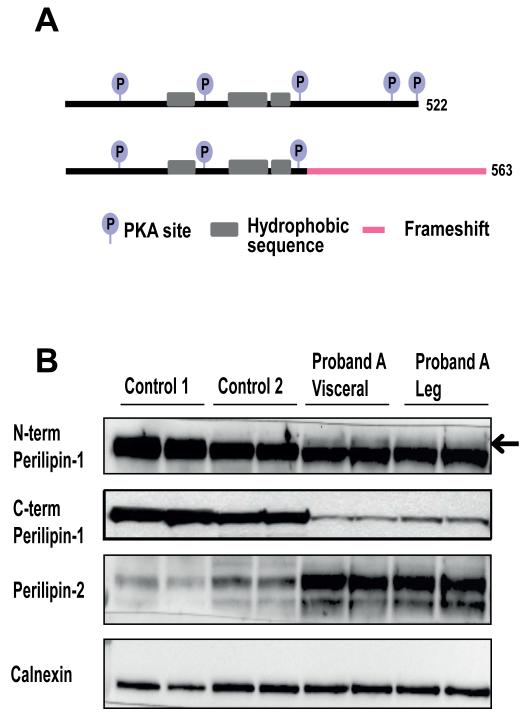
Both probands were wild type for PPARG and LMNA gene sequencing. Candidate gene sequencing of all exons and splicing regions of the PLIN1 gene revealed a heterozygous deletion of two adjacent nucleotides (thymidine and guanine) within exon 9 (c.1298_1299delTG), resulting in a translational frameshift (Figure 1B). The mutation is predicted to lead to the incorporation of 125 aberrant amino acids from amino acid position 439 onwards, thus producing an elongated protein (563 amino acids rather than 522) (Figure 2A). The same mutation was present in both probands, although they are not known to be related. The mutation co-segregated with partial lipodystrophy, severe insulin resistance, severe dyslipidaemia and NAFLD in both kindreds (Figure 1A). Gestational hypertension was prominent in affected women.
Figure 2. Predicted consequences of the perilipin-1 439fs mutant and documentation of its expression in adipose tissue.
A) A schematic representation of the expected effects of the perilipin-1 439fs mutation on the protein domain organisation. B) Immunoblots showing perilipin-1 and 2 expression in adipose tissue samples from proband A (these include a visceral fat and subcutaneous leg fat sample) compared with expression in subcutaneous abdominal fat samples from two control samples. The N-terminal perilipin-1 antibody (GP29) detects both mutant (arrow) and wild type perilipin-1, whereas the C-terminal antibody only detects wild type perilipin-1. Calnexin was used as a loading control.
Detection of the PLIN1 p439fs mutant protein in patient adipose tissue
In order to determine whether the frameshift perilipin-1 mutant protein is expressed in vivo, samples of both visceral abdominal and subcutaneous adipose tissue were obtained from Proband A (at the time of a medically indicated surgical procedure) and subjected to SDS-PAGE alongside subcutaneous fat samples from gender matched controls (Figure 2B). Both the wild type (WT) and 439fs copy of perilipin-1 are detectable with an N-terminal epitope targeted antibody, however the higher molecular weight band corresponding to the 439fs protein was not detected by an antibody which targets a C-terminal epitope. Notably, the levels of WT and particularly the 439fs protein were reduced in the patient compared to controls.
In addition, in both murine and cell models, a decrease in perilipin-1 expression levels in adipocytes is typically associated with up-regulation of perilipin-2 expression [7]. In accordance with this, our patient manifested an increase in perilipin-2 expression in both visceral and subcutaneous adipose tissue when compared to controls (Figure 2B).
Functional characterization of the PLIN1 p439fs mutation
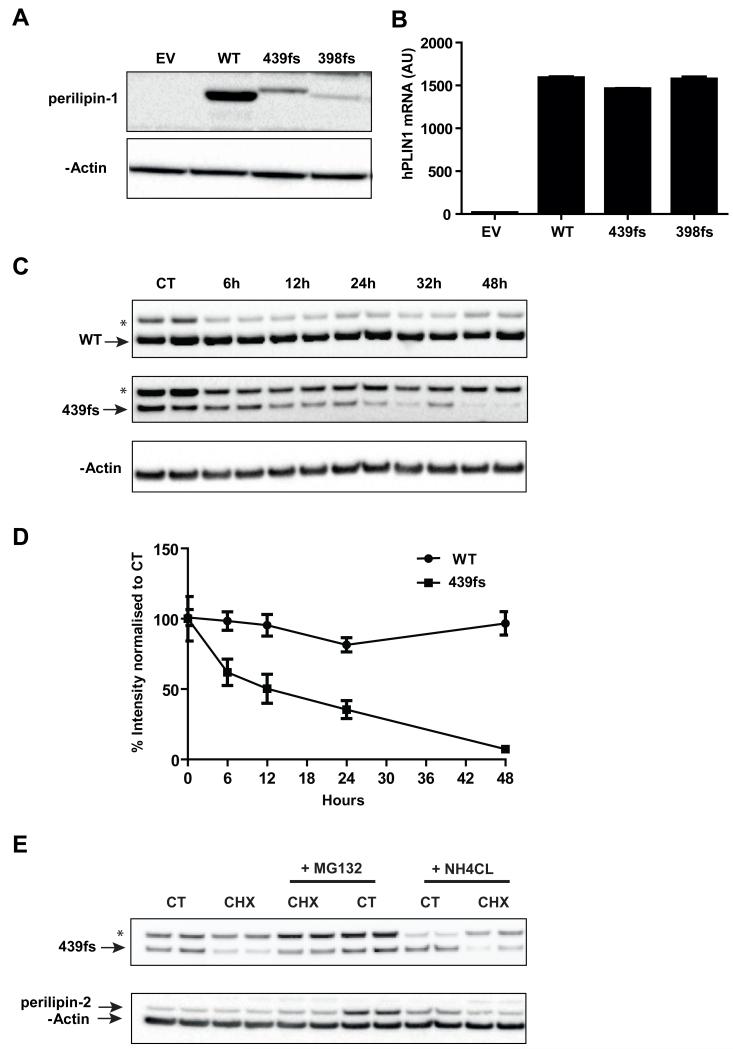
In order to functionally characterize the effects of the PLIN1 439fs mutation, 3T3-L1 pre-adipocytes were stably transfected with retroviral vectors expressing pBABEpuro PLIN1 WT or the PLIN1 398-or PLIN1 439 frameshift mutants, all bearing a N-terminal Myc tag. 3T3-L1 pre-adipocytes do not express endogenous perilipin-1, enabling us to directly compare their function in the absence of the potentially confounding influence of endogenous perilipin-1. The PLIN1 398 frameshift mutation was characterized in previous work and served as a ‘negative’ control in these studies [3]. All of the above mutant proteins are predicted to have a disordered C-terminus following the frameshift. In keeping with the patient biopsy findings, expression levels of the 439fs mutant were lower than those of the WT protein despite equivalent mRNA expression levels (Figure 3A,B). Expression of the 398fs mutant was even lower than that of the 439fs. In the presence of cycloheximide, the half-life of the 439fs protein was reduced compared to WT perilipin which is known to be particularly stable when associated with lipid droplets (Figure 3C,D)[8-10]. The fact that co-incubating the stable cell lines exposed to cycloheximide with a proteosomal inhibitor (MG132) modestly increased 439fs expression whereas the addition of a lysosomal inhibitor (NH4CL) had no discernible affect (Figure 3E), suggests that the 439fs perilipin-1 mutant is probably degraded via the proteasome. We also noted that the addition of MG132 increased endogenous perilipin-2 expression, which has been previously shown to be degraded via the proteosome (Figure 3E), providing useful corroborative evidence for the efficacy and specificity of MG132 as a proteosomal inhibitor in these cells.
Figure 3. Expression of the perilipin-1 439fs mutation in stably transduced 3T3-L1 pre-adipocyte cell lines.
3T3-L1 pre-adipocytes stably expressing either empty vector (EV) or N-terminally Myc tagged perilipin-1 wild type (WT), perilipin-1 439fs (439fs) and 398fs (398fs) mutants were generated as described in the materials and methods. A) Immunoblot analysis of perilipin-1 expression using an anti-Myc antibody, β-actin was used as a loading control. B) mRNA levels of hPLIN1 normalized to mCyclophilinA expression. C, D) Stably transfected 3T3-L1 pre-adipocytes expressing WT and 439fs perilipin-1 were grown to confluency and treated with 100 μg/ml cycloheximide (CHX) for the indicated times. Control (CT) cells were not treated with CHX. Cells were lysed and perilipin-1 expression levels were detected by immunoblotting with anti-Myc antibody and β-actin to assess loading. C) A representative image is shown. D) Quantification of perilipin-1 WT and 439fs expression levels from 3 independent experiments. Data represented as mean ±SEM. E) Stably transfected 3T3-L1 pre-adipocytes expressing WT and 439fs perilipin-1 were grown to confluency and treated with 100 μg/ml cycloheximide (CHX) and/or 10 μM MG132, or 25mM NH4Cl for 24 hours. Control (CT) cells were not exposed to CHX. Cells were lysed and perilipin-1 and 2 expression levels detected by immunoblotting, β-actin was used to assess loading. A representative image is shown. *Non-specific band; arrow denotes corresponding band.
The perilipin-1 439fs mutant is associated with smaller lipid droplets
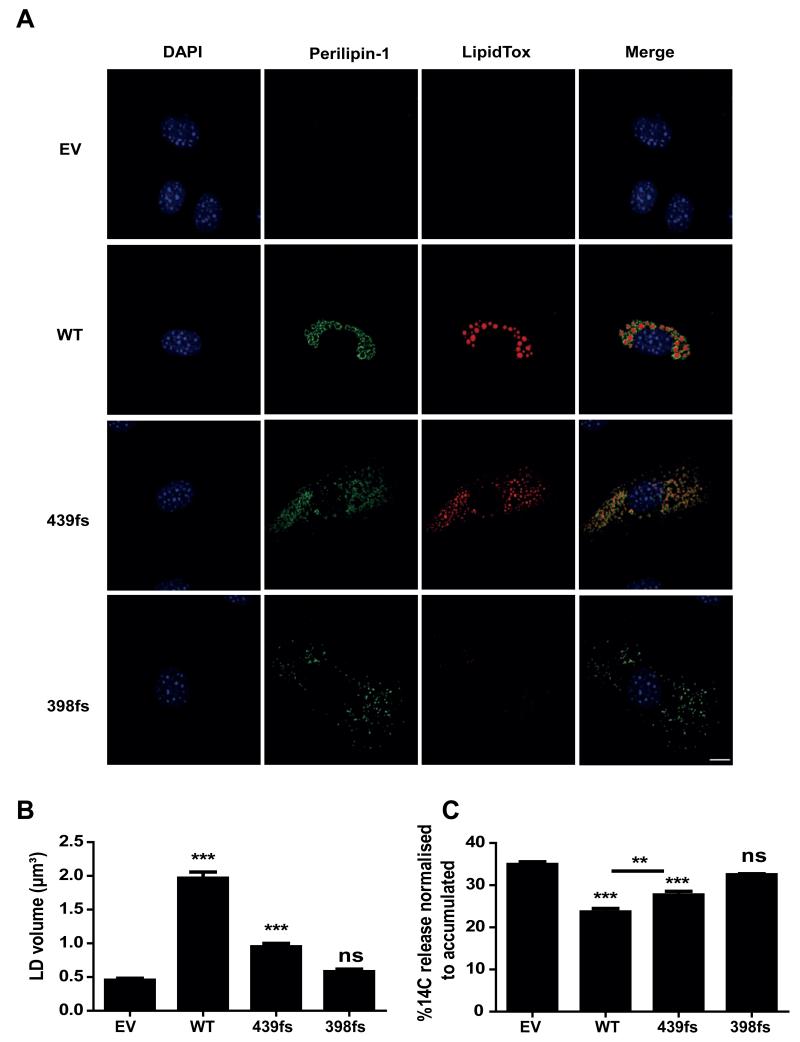
Since perilipin-1 is critical for lipid accumulation in adipocytes [11], we assessed the impact of expression of the 439fs mutant on lipid droplet size in 3T3-L1 fibroblasts. After 48 hours of exposure to medium containing oleic acid, perilipin-1 WT overexpressing cells accumulated several large lipid droplets, whereas cells expressing the perilipin-1 439fs mutant contained a more heterogeneous population of significantly smaller lipid droplets (Figure 4A,B). There was no difference in the ability of C-terminal perilipin-1 mutants to target to the lipid droplets (Figure 4A). Perilipin-1 has previously been shown to exert its effect on lipid accumulation primarily through the inhibition of basal lipolysis rather than an increase in triglyceride synthesis [12]. We thus hypothesized that the 439fs mutant may facilitate higher rates of basal lipolysis. In order to test this hypothesis, cells were incubated with oleic acid overnight, promoting lipid droplet accumulation, followed by a 4 hour chase period in the presence of Triacsin C to inhibit free fatty acid (FFA) re-esterification. Wild type (WT) perilipin-1 significantly suppressed FFA release, whereas the 439fs perilipin-1 mutant did so less effectively, albeit to a greater extent than the 398 perilipin-1 frameshift protein (Figure 4C).
Figure 4. Characterisation of the impact of the perilipin-1 439fs mutant on lipid droplet morphology and lipolysis.
A) Stable cell lines were treated with 400 μM oleic acid for 48 hours, fixed and stained with anti-Myc and anti-mouse-Alexa488 for perilipin-1 (green), LipidTox DeepRed for lipid droplets (red) and DAPI for nuclei (blue); scale bar 10 μm. B) Lipid droplet (LD) volume was measured by taking an average of 10 Z-stacks at 63× magnification with 2-3 cells per focal plane, followed by analysis using the Volosity 5 software (Perkin Elmer). Results from three independent experiments are expressed as mean±SEM. C) Stable cell lines were loaded with 14C oleic acid for 16 hours in order to label the intracellular triglyceride pool. Release of incorporated radioactivity was measured over 4 hours in the presence of 6 μM Triascin C to prevent fatty acid re-esterifiation. Lipolysis is expressed as the percentage of released radioactivity in the medium over total radioactivity incorporated. Results from three independent experiments are expressed as mean±SEM. In B and C, post hoc pairwise comparisons are shown versus EV and between pairs, indicated with an overlying bar. *** P<0.001 **P<0.01.
Perilipin-1 439fs mutant is able to bind ABHD5
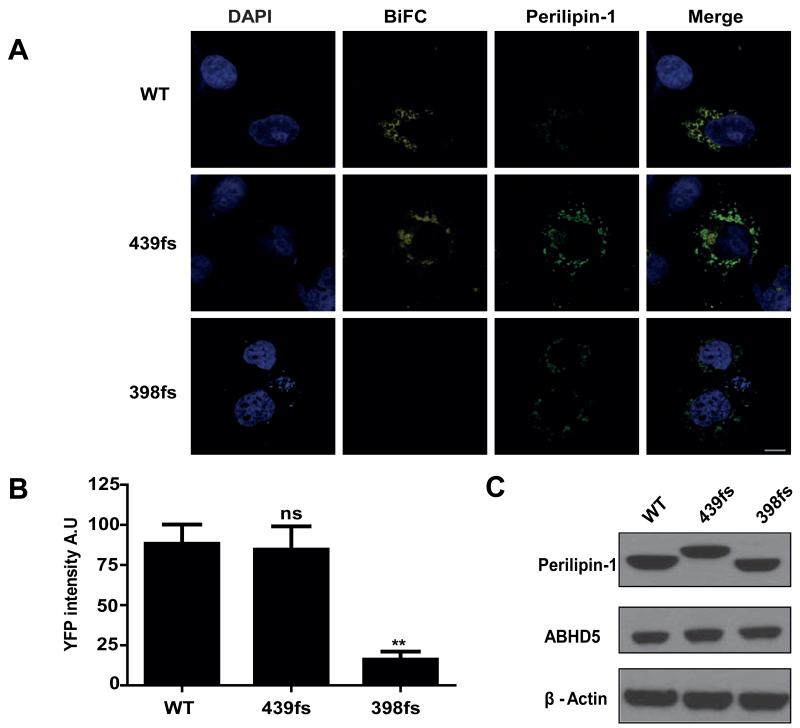
In an effort to reveal the molecular mechanisms underpinning the 439fs mutant’s failure to fully suppress basal lipolysis we employed Bimolecular Fluorescence Complementation (BiFC) assays to assess the interaction of the perilipin-1 439fs with ABHD5 (Figure 5). As both the 439- and 398fs mutants are expressed at lower levels than WT protein, expression plasmids were titrated in order to achieve equal protein expression. YFP signal was reconstituted when ABHD5-Yn was expressed with either WT or the 439fs mutant, but not in the presence of the 398fs mutant, implying that the 439fs is still able to interact with ABHD5. This is in agreement with previous studies, where amino acids 382-429, equivalent to amino acids 380-427 in the human sequence of perilipin-1, were shown to be crucial for ABHD5 binding [13].
Figure 5. The perilipin-1 439fs mutant interacts with ABHD5 on the surface of lipid droplets.
Interaction between perilipin-1 (wild type (WT), 439fs or 398fs) and ABHD5 was assessed using bimolecular complementation (BiFC) in COS-7 cells after normalizing for equal expression of each protein. A) Yn-ABHD5 and Myc-PLIN1-Yc (wild type (WT), 439fs or 398fs mutants) were co-transfected in COS-7 cells and stained with anti-Myc and anti-mouse-Alexa594 for perilipin-1 (green) and DAPI for nuclei (blue). The presence of YFP BiFC signal indicates direct interaction between perilipin-1 and ABHD5; scale bar 10μm. B) The YFP BiFC signal was quantified as described in materials and methods. Results from three independent experiments are expressed as mean±SEM, where post hoc comparison is shown vs WT. ns-not significant ** P<0.001. C) The amount of Myc-perilipin-1 and ABHD5 expressed was assessed by immunoblotting. β-actin was used as a loading control.
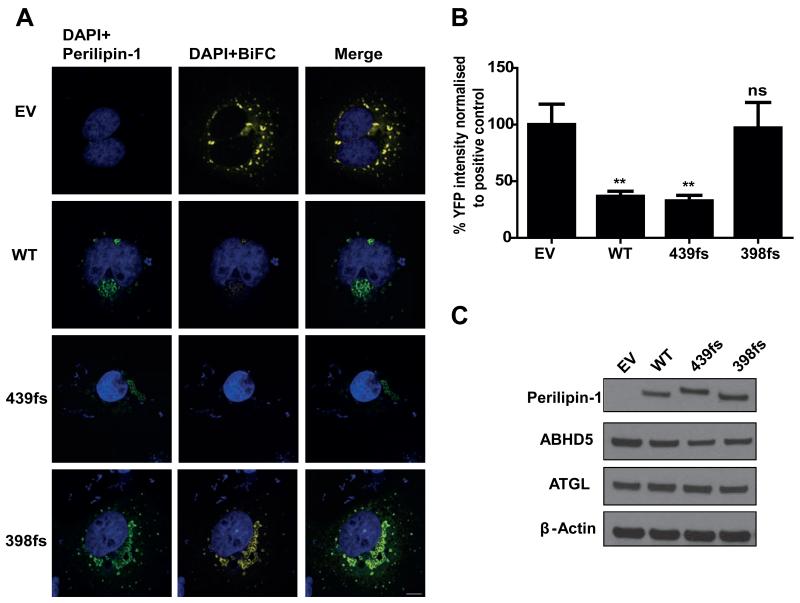
One could hypothesize that the conformational change induced by the C-terminal frameshift would allow the 439fs mutant to bind ABHD5, but might not necessarily prevent the subsequent interaction between ABHD5 and ATGL, as occurs with WT perilipin-1. We tested this hypothesis by assessing the ability of the 439fs perilipin-1 mutant to inhibit direct interaction between ABHD5 and ATGL. In this assay, expression of ATGL (S47A)-Yc and ABHD5-Yn results in bright YFP fluorescence which is reduced by ~70% when either WT or the 439fs perilipin-1 mutant is expressed (Figure 6). In contrast, expression of the 398fs mutant has no effect on the interaction between ATGL and ABHD5.
Figure 6. The perilipin-1 439fs mutant inhibits the interaction between ATGL and ABHD5.
Interaction between ATGL and ABHD5 was assed using BiFC in COS-7 cells after normalizing for equal expression of each protein. A) Yn-ABHD5, ATGL (S47A)-Yc and myc-PLIN1 (wild type (WT), 439fs or 398fs mutants) were co-transfected in COS-7 cells and stained with anti-Myc and anti-mouse-Alexa594 for perilipin-1 (green) and DAPI for nuclei (blue). The presence of YFP BiFC signal indicates a direct interaction between ATGL and ABHD5; scale bar 10 μm. B) The YFP BiFC signal was quantified as described in materials and methods. Results from three independent experiments are expressed as mean±SEM. Post hoc pairwise comparisons are shown versus EV. ns-not significant ** P<0.001. C) Expression of Myc-perilipin-1, ABHD5 and ATGL was assessed by immunoblotting. β-actin was used as a loading control.
Expression of perilipin-1 WT does not rescue 439fs mutant phenotype
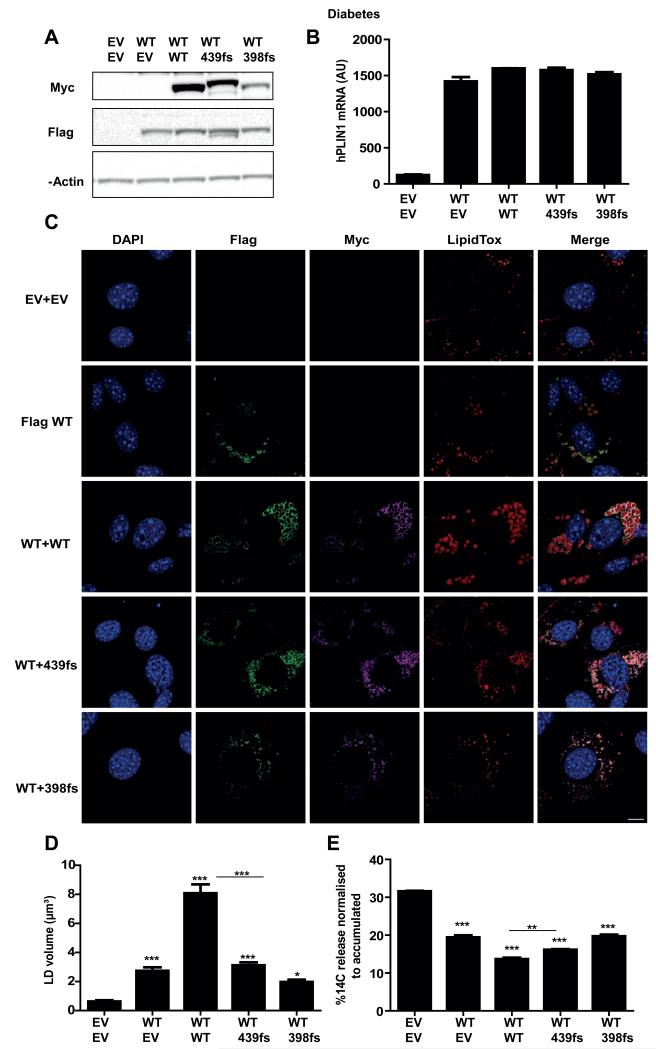
Finally, in an effort to mimic the in vivo consequences of the heterozygous mutation, the 439fs mutant was co-expressed with flag-tagged wild type perilipin-1 (WT). 439fs protein levels were stabilized to some extent by the expression of a WT copy of perilipin-1 (Figure 7A). The results suggest that increasing the amount of WT perilipin-1 protein increases lipid droplet volume (Figure 7C,D), whereas co-expression of either the 439fs or 398fs mutants fails to further increase lipid droplet volume. In accordance with these data, measurement of basal lipolysis in these cell lines showed less inhibition of basal lipolysis by the 439fs perilipin-1 mutant than WT perilipin-1 even in the presence of WT perilipin-1 (Figure 7E).
Figure 7. Characterisation of the consequences of the PLIN1 439fs mutation in pre-adipocytes co-expressing wild type perilipin-1.
3T3-L1 pre-adipocytes stably expressing pLXSN-Flag-PLIN1-WT (wild type) were infected with pBABEpuro EV or Myc-PLIN1 WT, PLIN1 439fs and PLIN1 398fs mutants as described in materials and methods. A) Immunoblot analysis of perilipin-1 expression using an anti-Myc or anit-Flag antibody. β-actin was assessed as a loading control. B) mRNA levels of total hPLIN1 normalized to mCyclophilinA expression. C) Stable cell lines were treated with 400 μM oleic acid for 48 hours, fixed and stained with anti-Myc and anti-mouse-Alexa488 for perilipin-1 (green), LipidTox DeepRed for lipid droplets (red) and DAPI for nuclei (blue); scale bar 10 μm. D) Lipid droplet (LD) volume was measured by taking the average of 10 Z-stacks at 63× magnification with 2-3 cells per focal plane, followed by analysis using Volosity 5 software. Results from three independent experiments are expressed as mean±SEM. E) Stable cell lines were loaded with 14C oleic acid for 16 hours in order to label the intracellular triglyceride pool. Release of incorporated radioactivity was measured over 4 hours in the presence of 6 μM Triascin C to prevent fatty acid re-esterifiation. Lipolysis is expressed as the percentage of released radioactivity in the media over the total radioactivity incorporated. Results from three independent experiments are expressed as mean as mean±SEM. In D and E, post hoc pairwise comparisons are shown versus EV, and between pairs, indicated with an overlying bar. * P<0.05; **P<0.01; *** P<0.001.
Discussion
Lipodystophic syndromes are a rare, but fascinating cause of insulin resistant type 2 diabetes. The archetypal feature of all lipodystrophies is a lack of adipose tissue, which can either be partial or generalized. Nevertheless the consequences of lipodystrophy, which include dyslipidaemia, NAFLD, hyperandrogenism and PCOS in women and accelerated cardiovascular disease are remarkably similar to those usually associated with obesity as part of the metabolic syndrome [14]. This observation in itself constitutes a key piece of evidence underpinning the so called ‘lipid overflow hypothesis’ which posits that the capacity of mammalian adipose tissue to accommodate surplus lipid is finite, and that when this capacity is exceeded, lipids accumulate in ectopic sites, such as the liver and skeletal muscle where they are instrumental in causing insulin resistance [15].
Within the last 15 years several monogenic defects have been causally linked to human lipodystrophic syndromes, collectively advancing the understanding of human adipogenesis and adipocyte function, and the systemic metabolic consequences of ‘adipocyte dysfunction’ [16, 17]. More recently, our laboratory has reported the consequences of loss-of-function mutations in proteins implicated in the formation and functional regulation of adipocyte lipid droplets [3, 18]. Interestingly CIDEC and PLIN1 encode LD proteins almost exclusively expressed in white adipocytes emphasizing firstly their importance in determining the unique properties of adipocyte LDs and secondly the ‘whole organism’ consequences of dysfunction of proteins primarily expressed in adipocytes (perilipin-1 is also expressed in adrenal cells, and both proteins can be expressed in steatotic hepatocytes).
The original description of patients with FPLD4 due to PLIN1 mutations was based on a description of 6 affected subjects. In order to better understand this novel phenotype we have attempted to identify more affected subjects. These efforts enabled us to identify another two probands and four affected relatives with a different PLIN1 mutation (439fs) to those previously reported. The key features of patients with the 439fs mutant include lack of peripheral fat depots, severe insulin resistance and extreme hypertriglyceridaemia. These features are consistent with what was observed in patients with either the PLIN1 398 or 404 frameshift mutations. The effect of bariatric surgery on the metabolic phenotype of Proband A was particularly striking. She experienced a 20 kg weight loss, with an 80% reduction in insulin requirements, improved lipid profile, reversal of cardiomyopathy and improvement in muscle strength. Her daughter exhibited a similar improvement in metabolic profile. These metabolic improvements are consistent with case reports describing the response to bariatric surgery in other forms of partial lipodystrophy [19-21] and highlight the importance of ‘relieving’ the energetic stress imposed upon their dysfunctional adipocytes. The beneficial symptomatic and functional effect of bariatric surgery on cardiac function in obese patients with cardiomyopathy has been described in a limited number of reports, but not yet in patients with lipodystrophy [22].
Functional studies of the 439fs mutant suggest that it is associated with smaller lipid droplets and higher basal lipolytic rates. These data are consistent with previously reported studies by Garcia et al, who observed less triglyceride accumulation in cells over-expressing an artificially generated perilipin-1 truncation mutant which truncates the protein at an amino acid very close to the site of our 439fs mutant, namely E427 stop [11]. However, understanding why the 439fs mutant is associated with higher basal lipolytic rates is more complex than was the case for the previously reported human mutants (398 and 404fs) as those fail to bind and stabilize ABHD5, whereas our studies suggest that the 439fs mutant does bind ABHD5, stabilize its expression and sequester it from ATGL. One possible explanation might be the strikingly reduced expression of the 439fs mutant, which was observed in tissue samples from Proband A and in transfected cells. The aberrant C-terminus of 439fs mutant protein is likely to be disordered, which would account for its propensity to degradation as occurs with many mutant proteins [23]. Interestingly, even partial loss of perilipin-1 is sufficient to reduce fat mass as observed in Plin1 heterozygous knockout mice [7]. Absent perilipin-1 expression in Plin1 null mice was also associated with concomitant up-regulation of perilipin-2 [7, 24]. Thus the observed up-regulation of perilipin-2 expression in fat biopsies from Proband A provides further evidence for reduced total perilipin-1 expression in vivo. We cautiously conclude therefore that reduced perilipin-1 expression is likely to be an important factor in the phenotype observed in patients with the 439fs PLIN1 mutation. It is also very likely that the C-terminus of perilipin-1 has additional, as yet incompletely understood, biological functions which are likely to be impaired by this mutation.
In summary, we report the clinical and molecular characterization of a novel PLIN1 frameshift mutation in two kindreds with FPLD4. The severity of metabolic disease seen in affected patients further highlights the importance of precise lipolytic regulation in adipose tissue in human health. Finally, the highly beneficial response of two patients with this disorder to bariatric surgery emphasizes the importance of weight loss in these patients. Surgery lessens ectopic fat deposition and offers at least one useful management option for an otherwise devastating metabolic illness.
Supplementary Material
Acknowledgements
We are very grateful to the patients who participated in these studies and to the medical staff who assisted in their management. This work was supported by grants from the Wellcome Trust (D.B.S, S.O’R, I.B.), the U.K. NIHR Cambridge Biomedical Research Centre, the MRC Centre for Obesity and Related Metabolic Disease and a BBSRC CASE studentship (K.K.).
Footnotes
Conflict of interest: The authors have declared that no conflict of interest exists.
References
- 1.Bickel PE, Tansey JT, Welte MA. PAT proteins, an ancient family of lipid droplet proteins that regulate cellular lipid stores. Biochimica et Biophysica Acta (BBA) - Molecular and Cell Biology of Lipids. 2009;1791(6):419–440. doi: 10.1016/j.bbalip.2009.04.002. [DOI] [PMC free article] [PubMed] [Google Scholar]
- 2.Zechner R, et al. FAT SIGNALS - Lipases and Lipolysis in Lipid Metabolism and Signaling. Cell Metabolism. 2012;15(3):279–291. doi: 10.1016/j.cmet.2011.12.018. [DOI] [PMC free article] [PubMed] [Google Scholar]
- 3.Gandotra S, et al. Perilipin Deficiency and Autosomal Dominant Partial Lipodystrophy. New England Journal of Medicine. 2011;364(8):740–748. doi: 10.1056/NEJMoa1007487. [DOI] [PMC free article] [PubMed] [Google Scholar]
- 4.Gandotra S, et al. Human frameshift mutations affecting the carboxyl terminus of perilipin increase lipolysis by failing to sequester the adipose triglyceride lipase (ATGL) coactivator, AB-hydrolase containing 5 (ABHD5) Journal of Biological Chemistry. 2011;286(40):34998–5006. doi: 10.1074/jbc.M111.278853. [DOI] [PMC free article] [PubMed] [Google Scholar]
- 5.Donadille B, et al. Etiological investigations in apparent type 2 diabetes: when to search for lamin A/C mutations? Diabetes & Metabolism. 2005;31(6):527–32. doi: 10.1016/s1262-3636(07)70227-6. [DOI] [PubMed] [Google Scholar]
- 6.Patel S, et al. Perilipins 2 and 3 lack a carboxy-terminal domain present in perilipin 1 involved in sequestering ABHD5 and suppressing basal lipolysis. Proceedings of the National Academy of Sciences. 2014 doi: 10.1073/pnas.1318791111. DOI: 10.1073/pnas.1318791111. [DOI] [PMC free article] [PubMed] [Google Scholar]
- 7.Tansey JT, et al. Perilipin ablation results in a lean mouse with aberrant adipocyte lipolysis, enhanced leptin production, and resistance to diet-induced obesity. Proceedings of the National Academy of Sciences. 2001;98(11):6494–6499. doi: 10.1073/pnas.101042998. [DOI] [PMC free article] [PubMed] [Google Scholar]
- 8.Xu G, Sztalryd C, Londos C. Degradation of perilipin is mediated through ubiquitination-proteasome pathway. Biochimica et Biophysica Acta (BBA) - Molecular and Cell Biology of Lipids. 2006;1761(1):83–90. doi: 10.1016/j.bbalip.2005.12.005. [DOI] [PubMed] [Google Scholar]
- 9.Brasaemle DL, et al. Post-translational Regulation of Perilipin Expression. Journal of Biological Chemistry. 1997;272(14):9378–9387. doi: 10.1074/jbc.272.14.9378. [DOI] [PubMed] [Google Scholar]
- 10.Kovsan J, et al. Regulation of Adipocyte Lipolysis by Degradation of the Perilipin Protein. Journal of Biological Chemistry. 2007;282(30):21704–21711. doi: 10.1074/jbc.M702223200. [DOI] [PubMed] [Google Scholar]
- 11.Garcia A, et al. The Amino and Carboxyl Termini of Perilipin A Facilitate the Storage of Triacylglycerols. Journal of Biological Chemistry. 2004;279(9):8409–8416. doi: 10.1074/jbc.M311198200. [DOI] [PubMed] [Google Scholar]
- 12.Brasaemle DL, et al. Perilipin A Increases Triacylglycerol Storage by Decreasing the Rate of Triacylglycerol Hydrolysis. Journal of Biological Chemistry. 2000;275(49):38486–38493. doi: 10.1074/jbc.M007322200. [DOI] [PubMed] [Google Scholar]
- 13.Subramanian V, et al. Perilipin A Mediates the Reversible Binding of CGI-58 to Lipid Droplets in 3T3-L1 Adipocytes. Journal of Biological Chemistry. 2004;279(40):42062–42071. doi: 10.1074/jbc.M407462200. [DOI] [PubMed] [Google Scholar]
- 14.Garg A, Agarwal AK. Lipodystrophies: Disorders of adipose tissue biology. Biochimica et Biophysica Acta (BBA) - Molecular and Cell Biology of Lipids. 2009;1791(6):507–513. doi: 10.1016/j.bbalip.2008.12.014. [DOI] [PMC free article] [PubMed] [Google Scholar]
- 15.Savage DB, Petersen KF, Shulman GI. Disordered Lipid Metabolism and the Pathogenesis of Insulin Resistance. Physiological Reviews. 2007;87(2):507–520. doi: 10.1152/physrev.00024.2006. [DOI] [PMC free article] [PubMed] [Google Scholar]
- 16.Vigouroux C, et al. Molecular mechanisms of human lipodystrophies: From adipocyte lipid droplet to oxidative stress and lipotoxicity. The International Journal of Biochemistry & Cell Biology. 2011;43(6):862–876. doi: 10.1016/j.biocel.2011.03.002. [DOI] [PubMed] [Google Scholar]
- 17.Huang-Doran I, et al. Lipodystrophy: metabolic insights from a rare disorder. Journal of Endocrinology. 2010;207(3):245–255. doi: 10.1677/JOE-10-0272. [DOI] [PubMed] [Google Scholar]
- 18.Rubio-Cabezas O, et al. Partial lipodystrophy and insulin resistant diabetes in a patient with a homozygous nonsense mutation in CIDEC. EMBO Molecular Medicine. 2009;1(5):280–287. doi: 10.1002/emmm.200900037. [DOI] [PMC free article] [PubMed] [Google Scholar]
- 19.Ciudin A, et al. Successful treatment for the Dunnigan-type familial partial lipodystrophy with Roux-en-Y gastric bypass. Clinical Endocrinology. 2011;75(3):403–404. doi: 10.1111/j.1365-2265.2011.04057.x. [DOI] [PubMed] [Google Scholar]
- 20.McGrath N, Krishna G. Gastric Bypass for Insulin Resistance due to Lipodystrophy. Obesity Surgery. 2006;16(11):1542–1544. doi: 10.1381/096089206778869988. [DOI] [PubMed] [Google Scholar]
- 21.Utzschneider KM, Trence DL. Effectiveness of Gastric Bypass Surgery in a Patient With Familial Partial Lipodystrophy. Diabetes Care. 2006;29(6):1380–1382. doi: 10.2337/dc06-0130. [DOI] [PubMed] [Google Scholar]
- 22.Grapsa J, et al. The effect of bariatric surgery on echocardiographic indices: a review of the literature. European Journal of Clinical Investigation. 2013;43(11):1224–1230. doi: 10.1111/eci.12162. [DOI] [PubMed] [Google Scholar]
- 23.Yue P, Li Z, Moult J. Loss of Protein Structure Stability as a Major Causative Factor in Monogenic Disease. Journal of Molecular Biology. 2005;353(2):459–473. doi: 10.1016/j.jmb.2005.08.020. [DOI] [PubMed] [Google Scholar]
- 24.Martinez-Botas J, et al. Absence of perilipin results in leanness and reverses obesity in Leprdb/db mice. Nat Genet. 2000;26(4):474–479. doi: 10.1038/82630. [DOI] [PubMed] [Google Scholar]
Associated Data
This section collects any data citations, data availability statements, or supplementary materials included in this article.


