

Abstract
Progressive multiple sclerosis is characterized by the gradual accrual of disability independent of relapses and can occur with disease onset (primary progressive) or preceded by a relapsing disease course (secondary progressive). An effective disease modifying treatment for progressive multiple sclerosis has not been identified, and the results of clinical trials to date have been generally disappointing. Ongoing advances in our understanding of pathogenesis, identification of novel targets for neuro-protection, and improved outcome measures have the potential to lead to effective treatments for progressive multiple sclerosis. In this review lessons learned from previous clinical trials and perspectives from current trials in progressive multiple sclerosis are summarized. Promising clinical, imaging, and biological markers will also be reviewed, along with novel clinical trial designs.
Introduction
Progressive forms of MS (PMS) are characterized clinically by the accumulation of neurological disability, independent of relapses and may present as the initial disease course (primary progressive [PPMS]) or more commonly following an initial relapsing phase of the disease (secondary progressive [SPMS]).1 The pathologic process that drives the accrual of disability in PMS is unknown but possibilities include continued compartmentalised inflammation, mitochondrial dysfunction, and accelerated neurodegeneration, among others.2 Significant progress has been made in the treatment of multiple sclerosis (MS) over the last two decades with the introduction of effective therapies for the relapsing remitting (RRMS) form of the disease.3 Unfortunately, similar success has not occurred for PPMS and SPMS.4 While inflammation is well defined and treated in RRMS as focal inflammatory lesions, the underlying pathology in PMS is less clear, making development of therapeutics a significant challenge. This has been reflected in the trial results of anti-inflammatory agents which has been disappointing to date. Additional barriers are the relative paucity of sensitive outcome measures and fully validated biomarkers in PMS. Here we will review the lessons learned from previous clinical trials, highlight current trials, examine methodological aspects, and provide an overview of challenges in PMS trials. This section assumes that the compounds chosen for testing have a priori a reasonable chance of success from the mechanistic, bench top and phase 1 work as described in the accompanying paper and concentrates on the architecture of trial design.
1 Completed and ongoing clinical trials
Phase 3 trials
In order to improve clinical trials in PMS it is necessary first to review those trials which already have been completed. Using a comprehensive literature search (see panel 1) and www.clinicaltrials.gov, Tables 1a and b list the previous major disability-driven trials which have taken place in PMS over the last quarter of a century. These involve over 8500 subjects, with the majority (75%) being SPMS.5–22 Different categories of agents have been studied, including classical immunosupressants, beta-interferons, newer immunomodulators and putative neuroprotectants. Despite a huge effort, the trial outcomes are essentially negative (though some exceptions are described below). However, numerous important lessons can be drawn from this experience to inform future efforts. Ongoing trials are listed in Table 3. It can be seen that the Expanded Disability Status Scale (EDSS) scale has dominated the field with the usual measure being time to progression/progression free disability, though absolute mean EDSS difference, Multiple Sclerosis Functional Composite (MSFC) and other summary measures are also recorded. A useful way to start the analysis is to use elements from the CONSORT schema,23 since this is typically reported in modern trials. It is clear that most trials have employed immunomodulating or immunosuppressant medications and the negative data to date would suggest that the focus of PMS trials should shift to a primary neuroprotective stance.
Table 1.
| Intervention | Trial duration (years) |
Participants
|
ARR
|
Progression
|
EDSS change
|
|||||||||||||
|---|---|---|---|---|---|---|---|---|---|---|---|---|---|---|---|---|---|---|
| Pre-trial progression (months) |
MS (years) |
SPMS (years) |
Mean age (years) |
SPMS (%) |
PPMS (%) |
Baseline EDSS (mean) |
Pre- trial |
In-trial pla- cebo |
In-trial active |
EDSS con- firmation (months) |
Estimated placebo (%) |
Actual placebo (%) |
Actual active (%) |
Placebo* | Active* | |||
| British and Dutch MS Azathioprine Group;6 1988; n=354 | Azathioprine (2·5 mg/kg per day) | 3 | ≥6 | 9 | ·· | 38 | 19† | 14† | 3·7 | ·· | 0·84 | 0·73 | ·· | ·· | ·· | ·· | 0·80 | 0·62 |
|
| ||||||||||||||||||
| Cyclosporine MS Study Group;7 1990; n=547 | Ciclosporin (dose adjusted for trough 300–500 ng/ml) | 2 | ≥12 | 10 | ·· | 40 | ‡ | ‡ | 5·4 | ·· | ·· | ·· | 3 | Mean ΔEDSS 0·5 (worse) | ·· | ·· | 0·55 | 0·33 |
|
| ||||||||||||||||||
| Canadian Cooperative MS Study Group;8 1991; n=168 | Cyclophosphamide (1g/alternate day IV until white cell count ≥4·5×106, oral prednisone; or plasma exchange (weekly for 20 weeks), oral cyclophosphamide (1·5–2·0 mg/kg per day, oral prednisone) | 2·5 (mean) | ≥12 | 10 | ·· | 31 | ‡ | ‡ | 5·7 | ·· | ·· | ·· | 6 | ·· | 29 | 35 cyclophosphamide, 32 plasma exchange | 0·69 | 0·81 cyclophosphamide, 0·69 plasma exchange |
|
| ||||||||||||||||||
| Mayo Clinic-Canadian CooperativeTrial;9 1998; n=199 | Sulfasalazine | 3 | ≥12 | 6 | ·· | 28 | 11† | 13† | 2·5 | 1·5 | 0·99 | 0·81 | 3 | 75 | 50 | 52 | 0·66 | 1·01 |
|
| ||||||||||||||||||
| European Study Group on interferon beta-1b in SPMS;10 1998; n=718§ | Interferon beta-1b (8M IU alternate days) | 3 | ≥6 | 13 | 4 | 41 | 100 | 0 | 5·1 | 0·85 | 0·64 | 0·44 | 3 | 50 | 50 | 39 | 0·60 | 0·47 |
|
| ||||||||||||||||||
| North American Linomide Investigators;11 2000; n=715 | Roquinimex (1·0, 2·5, and 7·5 mg) | 3 | ≥18 | 15 | ·· | 46 | 87† | 0† | 5·2 | 0·65 | ¶ | ¶ | 3 | 60 | ¶ | ¶ | ¶ | ¶ |
|
| ||||||||||||||||||
| Rice et al;12 2000; n=159 | Cladribine (0·07 mg/kg per day for 5 days for two or six cycles) | 1 | ≥12 | 11 | ·· | 44 | 70 | 30 | 5·6 | ·· | ·· | ·· | 2 | Mean ΔEDSS 1·0 (worse) | ·· | ·· | Δ0·3/0|| | Δ0/0|| |
|
| ||||||||||||||||||
| SPECTRIMS;13 2001; n=618 | Interferon beta-1a (22 or 44 μg 3 per week) | 3 | ≥6 | 13 | 4 | 43 | 100 | 0 | 5·4 | 0·45 | 0·71 | 0·50 | 3 | 60 | 65** | 60** | ·· | ·· |
|
| ||||||||||||||||||
| Cohen et al (IMPACT);14 2002; n=436 | Interferon beta-1a (60 μg per week) | 2 | ≥12 | 16 | ·· | 48 | 100 | 0 | 5·2 | 0·55 | 0·3 | 0·2 | 3 | MSFC used | Median ΔMSFC 0·161 (worse) | Median ΔMSFC 0·096 (worse) | 0·27 | 0·26 |
|
| ||||||||||||||||||
| Mitoxantrone in progressive MS;15 2002; n=194 | Mitoxantrone (5 or 12 mg/m2 every 3 months) | 2 | ≥18 | 10 | ·· | 40 | 50† | 0† | 4·6 | 1·33 | 1·02 | 0·60 and 0·35 (two doses) | 3 and 6 | Mean ΔEDSS 0·5 (worse) | ·· | ·· | 0·23 | −0·13†† |
|
| ||||||||||||||||||
| Andersen et al;16 2004; n=371 | Interferon beta–1a (22 μg/week) | 3 | ≥6 | 14 | 5 | 46 | 100 | 0 | 4·8 | 0·43 | 0·27 | 0·25 | 6 | Median TTP 3·1 years | 38 | 41 | 0·60 | 0·60 |
|
| ||||||||||||||||||
| Panitch et al;17 2004; n=939 | Interferon beta-1b (250 μg or 160 μg/m2 alternate days) | 3 | ≥6 | 15 | 4 | 47 | 100 | 0 | 5·1 | 0·42 | 0·28 | 0·16 | 6 | 50 | 34** | 36** | ·· | ·· |
|
| ||||||||||||||||||
| European Study on Immunoglobulin in MS trialists;18 2004; n=318 | Immunoglobulin (1g/kg per month) | 2·25 | ≥12 | 14 | 5 | 44 | 100 | 0 | 5·2 | ·· | 0·46 | 0·46 | 3 | 45 | 44 | 48 | 0·5 | 0·5 |
|
| ||||||||||||||||||
| Pohlau et al;19 2007; n=231 | Immunoglobulin (0·4 g/kg per month) | 2 | ≥12 | ·· | ·· | 48 | 85 | 15 | 5·6 | ·· | 0·26 | 0·30 | 3 | ·· | 63 | 48 | 0·5 (median) | 0 (median) |
|
| ||||||||||||||||||
| Wolinsky et al (PROMiSE);20 2007; n=943¶‡‡ | Glatiramer acetate (20 mg SC per day) | 3 | ≥6 | 11 | ·· | 50 | 0 | 100 | 4·9 | N/A | N/A | N/A | 3 | 50 per year (3·0–5·0); 20 per year (5·5–6·5) | 45 | 40 | 0·61 | 0·58 |
|
| ||||||||||||||||||
| Hawker et al (OLYMPUS);21 2009; n=439‡‡ | Rituximab (1000 mg infusions twice in four courses) | 2 | ≥12 | 9 | ·· | 50 | 0 | 100 | 4·8 | N/A | N/A | N/A | 3 | 32 | 39 | 30 | 0·45 | 0·33 |
|
| ||||||||||||||||||
| Freedman et al (MAESTRO);22 2011; n=612 | Myelin basic protein 8298 (500 mg IV 6 monthly) | 2 | Recent | 9 | ·· | 50 | 100 | 0 | 5·5 | 0·09 | 0·15 | 0·12 | 6 | 30 | 28 | 31 | 0·22 | 0·24 |
|
| ||||||||||||||||||
| Zajicek et al (CUPID);23 2013; n=498‡‡ | Dronabinol (max 28 mg per day) | 3 | ≥12 | ·· | ·· | 52 | 61 | 39 | 5·9 | ·· | ·· | ·· | 6 | 70 | 60 | 55 | ·· | ·· |
Table 3.
| Intervention | Trial duration (years) |
Entry EDSS range |
Pre-trial duration of progression (months) |
Mean age of participants (years) |
MS/ SPMS* duration (years) |
SPMS/ PPMS (%) |
Mean EDSS |
Primary outcome(s) | Comments | |
|---|---|---|---|---|---|---|---|---|---|---|
| Khatri et al;26 1985; n=54 | Plasma exchange (weekly for 20 weeks) in addition to low-dose prednisolone and cyclophosphamide | 2 | ·· | ≥12 | 39 | 11/2 | Chronic progressive | 6·4 | EDSS or activities of daily living | EDSS improvement or stabilisation |
| Gordon et al;27 1985; n=20 | Plasma exchange (eight exchanges) in addition to prednisolone and azathioprine | About 0·5 | ·· | ≥24 | 36 | 13 | Chronic progressive | 6·3 | EDSS | Negative |
| Cook et al;28 1986; n=40 | TU(1980 cGy) | 2 | 4·0–8·0 | ≥12 | 43 | 13 | Chronic progressive | 6·4 | Functional scale | Less functional decrease with TU than with sham treatment |
| Kastrukoff et al;29 1990; n=100 | Lymphoblastoid interferon (5×10⁶ per day SC) | 2 | ≤7·0 | ≥6 | 45 | 14 | Chronic progressive | 6·0 | EDSS or MRI lesion load | Negative |
| Bomstein et al;30 1991; n=106 | Cop 1 | 2 | 2·0–6·5 | ≥18 | 42 | ·· | Chronic progressive | 5·6 | Disability progression (EDSS) | Negative |
| Sipe et al;31 1994; n=48 | Cladribine 0·7 mg/kg IV four courses | 1 | ·· | ≥24 | 43 | 12 | Chronic progressive | 4·6 | Disability progression (EDSS or SNRS); MRI lesion volume; oligoclonal band status | Cross-over design; improvement in mean paired EDSS (1·3) and SNRS (−12·5) |
| Wiles et al;32 1994; n=24 | TU(1980 cGy) | 2 | ≤6·5 | ≥12 | 39 | 8 | 75/25 | 5·8 | Disability progression (EDSS) | Negative; recruited only 24 of 56 participants needed |
| Milligan et al;33 1994; n=52 | Isoprinosine (3 g/day) in addition to pulsed methylprednisolone day 6–10 (0·5 g/day) | 2 | <5·5 | ·· | 41 | 8 | 42/8† | 2·9 | Disability progression (EDSS, ambulation index, MRI lesion load) | Negative |
| Goodkin et al;34 1995; n=60 | Methotrexate 7·5 mg per week | 2 | 3·0–6·5 | ≥6 | 44 | 8–11 (median range) | 70/30 | 5·4 | Disability progression (EDSS, 9HPT, Box and Block Test, ambulation index) | 52% active and 83% given placebo had sustained treatment failure (p=0·01), especially for upper limb function |
| Cazzato et al;35 1995; n=35 | Methylprednisolone (1 g/day for 5 days followed by oral prednisolone, four cycles) | 0·25 | ·· | ·· | 44 | 8 | 0/100 | ·· | EDSS functional systems | Cross-over design; significant improvement in EDSS |
| Karussis et al;36 1996; n=30 | Roquinimex (2·5 mg/day) | 0·5 | 3·0–7·0 | ≥24 | 42 | 7 | 100/0 | 4·8 | Safety; MRI GdE activity; EDSS mean change | Reduced MRI activity |
| Van Oosten et al;37 1997; n=71 | Anti-CD4 antibody cM-T412 | 0·75 | 3·0–7·0 | ≥18 | 37 | 7 | 46/0† | 5·0–6·0 (median) | MRI GdE activity | Negative |
| Cook et al;38 1997; n=46 | Modified TU(1980 cGy) in addition to low-dose prednisolone | 3 | 3·5–6·5 | ≥24 | 41 | 11 | Chronic progressive | 5·7 | Disability progression (EDSS) | Stopped prematurely owing to low number of participants recruited |
| Bosco and Cazzato;39 1997; n=23 | Idebenone (90 mg/day) in addition to IV methylprednisolone | 0·7 | 3·0–6·0 | ·· | 46 | 12 | Chronic progressive | 4·3 | EDSS and ambulation index | Negative |
| Goodkin et al;40 1998; n=108 | High-dose or low-dose IV methylprednisolone alternate months; followed by oral methylprednisolone | 2 | 4·0–6·5 | ≥5 | ·· | ·· | 100/0 | ·· | Disability progression (EDSS, 9HPT, ambulation, Box and Block Test, relapase) | No difference |
| Paolillo et al;41 1999 and Coles et al;42 2006; n=25 | Alemtuzumab anti-CD52 (20 mg/day for 5 days) | 1·5 | 4·0–6·0 | ≥12 | 39 | 12 | 100/0 | 5·4 | Disability progression (EDSS); immunological and MRI GdE activity | Cross-over design; reduction in inflammatory activity, but no difference in atrophy rate or EDSS worsening |
| Skurkovich et al;43 2001; n=45 | Antibodies to interferon γ or TNFα | 1 | 3·0–7·0 | ≥12 | 39 | 11/3 | 100/0 | 4·2 | Disability progression (EDSS) | Reduced disease progression in patients with antibodies to interferon γ, but not TNFα |
| Leary and Thompson;44 2003; n=50 | Interferon beta-1a (30 or 60 μg/week) | 2 | 2·0–7·0 | ≥24 | 45 | 8 | 0/100 | 5·2 (median) | Disability progression (EDSS) | Negative |
| Walker et al;45 2005; n=43 | Pirfenidone (max dose 2400 mg/day) | 1 | 5·0–8·0 | ≥24 | 49 | 13 | 100/0 | 6·2 | SNRS | Significant improvement in SNRS |
| Warren et al;46 2006; n=32 | MBP8298 (500 mg every 6 months) | 2 | 3·0–7·5 | ·· | 45 | 14 | 69/31 | 6·5 (median) | Disability progression (EDSS); reduction in CSF anti-MBP levels | Negative overall outcome, but an effect was noted in HLA DR2/4 sub-group |
| Montanari et al (ASPIRE);47 2009; n=85‡ | Azathioprine added to interferon beta-1b | 2 | ·· | ·· | ·· | ·· | 100/0 | ·· | MSFC | Negative, although low completion rate (45/85) |
| Montalban et al;48 2009; n=73 | Interferon beta-1b (8 MU alternate days) | 2 | 3·0–7·0 | ≥12 | 49 | 11 | 0/67§ | 5·2 | Disability progression (EDSS) | Negative |
| Kapoor et al;49 2010; n=120 | Lamotrigine (mean 78 mg/day) | 2 | 4–6·5 | ≥24 | 51 | 20/8 | 100/0 | 6·0 | Atrophy rate: partial (central) brain volume | Restricted tolerability; pseudoatrophy was reported; reduced deterioration of T25FW walking speed |
| Karpha et al;50 2010; n=21 | Recombinant human erythropoietin (30 000 IU per week for 12 weeks) | 0·4 | ·· | ·· | ·· | ·· | 0/100 | ·· | Maximum walking distance; EDSS | Non-significant improvement in maximum walking distance; EDSS unchanged |
| Barkhof et al;51 2010; n=297 | Ibudilast (30 or 60 mg/day) | 1 | <5·5 | ·· | 36 | 6 | 7/0† | 3·2 | MRI, GdE lesion load | Negative, but reduction of brain atrophy |
| Vollmer et al;52 2011; n=215 | Anti-ll 12/23 antibody (200 mg weekly or alternate weeks) | 0·5 | ≤6·5 | ·· | 44–46 (median) | 8 | 21/0† | 3·3 | MRI, GdE lesion load | Negative |
| Connick et al (MSCIMS);53 2012; n=10 | Autologous mesenchymal stem cells | 2 | 5·5–6·5 | ·· | 49 | 14 | 100/0 | 6·1 | Visual pathway: structural and functional measures | Improvement in some visual parameters and EDSS |
| Vermersch et al;54 2012; n=35 | Masitinib (3–6 mg/kg per day) | 1 | 2·0–6·5 | ≥12 | 48 | 9 | ·· | 4·9 | Safety; MSFC | Trend towards MSFC improvement |
| Arun et al;55 2013; n=14 | Amiloride (10 mg/day) | 1 | ·· | ·· | 54(median) | 6 | 0/100 | 4·8 | Atrophy rate: whole brain and tissue integrity | Significant reduction in atrophy rate |
| Mostert et al;56 2013; n=42 | Fluoxetine (40 mg/day) | 2 | 3·5–6·5 | ≥24 | 49 | 14 | 69/31 | 5·8–6·0 (median) | Disability progression (EDSS, 9HPT, ambulation index) | Overall negative; however, positive trends for EDSS and 9HPT progression |
| Chataway et al (MS-STAT);57 2014; n=140 | Simvastatin (80 mg/day) | 2 | 4·0–6·5 | ≥24 | 50 | 21/7 | 100/0 | 5·8 | Atrophy rate: whole brain | Atrophy rate reduced from 0·6% to 0·3% (adjusted 43% reduction); reduced deterioration in EDDS and MSIS29, but not MSFC |
Phase 2 trials
The phase 2 (proof of concept) to phase 3 (clinically definitive) paradigm is embedded in medical trial practice. Phase 2 trials are carried out to determine toxicity, dose identification and to give proof-of-concept encouragement to proceed to the longer and much more expensive phase 3. Phase 2a and 2b trials in PMS historically have been variable as Table 2 illustrates, with a range of structures and subsequent decisions taken. Whilst easy in retrospect, the decision not to pursue a phase 3 trial for alemtuzumab in PMS seems appropriate from the phase 2 (no effect on atrophy measures),24,25 but the decision to proceed seems questionable for MBP8298, where the large phase 3 trial (n=612) was based on a post-hoc, HLA-stratified sub-group of 20 patients.26 Likewise with the β-interferons, no pure SPMS cohort phase 2 trial took place, the decision to move to phase 3 largely driven by extrapolation from the successful RRMS experience. The nature of the primary phase 2 outcome is open to debate, with no measure fully validated. To some extent it depends on the question being asked. Considering stem cell treatment/transplantation, the phase 2a mesenchymal stem cells in multiple sclerosis study (MSCIMS) study focused on questions relating to the anterior visual pathway with an appropriate battery of measures being used27. In contrast, a recent systematic review (n=161, 8 case-series, RCT not performed) of haematopoietic transplantation used the traditional metric of EDSS progression-free survival.28 Examining the effect of therapies on whole or partial brain volume appears promising, as illustrated by the 43% reduction in atrophy rate seen in the MS-STAT trial, but must be concluded by a definitive phase 3 trial, with the relevant clinical primary outcome.29 Phase 2 trials can be useful for other (unexpected) reasons and an example would be the phenomenon of pseudo-atrophy in the lamotrigine trial, which has informed subsequent atrophy based trial design.30 Sometimes, a safety signal will remain hidden until the later stages of trials, as exemplified by the linomide experience 15 years ago.31
Table 2.
| Estimated completion date |
Intervention | Number of people to be randomised |
Trial duration (years) |
Entry EDSS range |
Duration of progression (months) |
Ratio of active to placebo |
Primary outcome | PPMS or SPMS | |
|---|---|---|---|---|---|---|---|---|---|
| Phase 3 | |||||||||
|
| |||||||||
| PROMESS (NCT00241254)* | 2013 | Methylprednisolone (1 g per month) vs cyclophosphamide (750 mg/m2) every 4 weeks for year 1; every 8 weeks for year 2 | 360 | 2 | 4·0–6·5 | ≥6 | 1:1 | EDSS progression | SPMS |
| INFORMS (NCT00731692)† | 2014 | Fingolimod (0·5 mg per day) | 969 | 3 | 3·5–6·0 | ≥24 | 1:1 | Time to confirmed disability progression | PPMS |
| ASCEND in SPMS (NCT01416181) | 2017 | Natalizumab (300 mg IV per month) | 890 | 2 | 3·0–6·5 | ≥24 | 1:1 | Proportion of participants with worsening of ≥1 on EDSS, T25FW, and 9HPT | SPMS |
| NCT01433497 | 2015 | Masitinib (6 mg/kg per day) | 450 | 2 | 2·0–6·0 | ≥6 | 1:1 | MSFC | SPMS or PPMS |
| NCT01194570 | 2017 | Ocrelizumab (300 mg twice during 14 days per treatment cycle) | 740 | 2 | 3·0–6·5 | ·· | 2:1 | Time to confirmed EDSS progression (in ≥3 months) | PPMS |
| EXPAND (NCT01665144) | 2016 | Siponimod (BAF312; 0·25–2·0 mg per day) | 1530 | 2–3·5 | 3·0–6·5 | ≥6 | 1:1 | Time to confirmed EDSS progression | SPMS |
|
| |||||||||
| Phase 2 | |||||||||
|
| |||||||||
| EPO-ProgMS (NCT01144117)‡ | 2013 | Erythropoietin (48 000 IU IV in 17 courses) | 56 | 0·5 | 4·0–6·5 | ≥24 | 1:1 | Composite of maximum gait distance, 9HPT, trail making | SPMS or PPMS |
| Abili-T (NCT01684761) | 2015 | Tcelna (lmilecleucel-T; 30–45×106 total cells, five SC doses per year) | 180 | 2 | 3·0–6·0 | ·· | 1:1 | Brain atrophy | SPMS |
| IPPoMS (NCT00950248) | 2018 | Idebenone (2250 mg/day) | 85 | 2 | 1·0–7·0 | ·· | 1:1 | Brain atrophy | PPMS |
| NCT01188811 | 2016 | Lipoic acid (1200 mg/day) | 56 | 2 | ·· | ·· | 1:1 | Brain atrophy | SPMS |
| SUPREMES (NCT00799890) | 2016 | Sunphenon EGCg (Epigallocatechin-Gallat, EGCG; 200–800 mg/day) | 60 | 3 | 3·0–8·0 | ·· | 1:1 | Brain atrophy | SPMS or PPMS |
| NCT01259388 | 2015 | Lithium (150 or 300 mg/day) | 20 | 2 | 3·0–6·5 | ·· | 1:1 cross-over | Brain atrophy | SPMS or PPMS |
| RIVITaUSE (NCT01212094) | 2017 | Rituximab (intrathecal and IV) | 80 | 2 | 3·0–7·0 | ≥3 | 1:1 | Brain atrophy | SPMS |
| MS-SMART (NCT01910259) | 2017 | Amiloride (10 mg) or fluoxetine (40 mg) or riluzole (100 mg) per day | 440 | 2 | 4·0–6·5 | ≥24 | 1:1:1:1 | Brain atrophy | SPMS |
| SPRINT-MS (NCT01982942) | 2017 | Ibudilast 100 mg/day | 250 | 2 | 3·0–6·5 | ≥24 | 1:1 | Brain atrophy | SPMS or PPMS |
| NCT01950234 | 2017 | ACTH (3 days per month SC) | 100 | 3 | 2·0–6·0 | ·· | 1:1 | Proportion with ≥20% worsening of T25FW | SPMS or PPMS |
| NCT02057159 | 2017 | NeuroVax (TCR peptide vaccine) | 200 | 1 | ≥3·5 | ·· | 1:1 | Cumulative number of gadolinium-enhanced lesions | SPMS |
| ACTIMUS (NCT01815632) | 2018 | Early or late autologous bone marrow infusion | 80 | 2 | 4·0–6·0 | ≥12 | 1:1 | Global evoked potential | SPMS or PPMS |
Previously, phase 2 trials tended to be small and often utilized mixed populations, with PPMS and SPMS sometimes being amalgamated as ‘Progressive’, as seen for example in cladribine11,32 and plasma exchange trials.33,34 Sometimes the progressive group has been the minority in are lapsing-remitting trial cohort, such as the ibudilast (7%)35 and anti-CD4 trials (<50%).36 A large number of small phase 2a studies have occurred where drugs have been repositioned from other fields (eg amiloride, 37 recombinant human erythropoietin38) and a systematic approach to harnessing such information may improve opportunities for drug repurposing.
In summary appropriately targeted phase 2 trials have the potential both to identify therapies most likely to succeed in phase 3 and also determine those with little chance of success.
2. Study Participants
At the core of any trial is the population under investigation. Does it reflect the target to be treated? Firstly the diagnostic definition of SP/PPMS is by no means straightforward, as we discuss below. Indeed a recent study showed that whether a physician or EDSS criteria was applied could alter the onset of SPMS by about 5 years.39 Table 1 shows patient ages (30–50 years), MS duration (10–15 years), SP/PPMS duration (5 and 10 years). Those cohorts with a younger age and/or lower SPMS duration may represent more of a transitional group (early stage with more inflammation). The required minimum duration of clinical progression before trial entry has ranged from 6–18 months. In some trials, the need for an observed EDSS step was mandated for entry with generally, the allowed entry EDSS range has been between 3.0–7.0 (mean actual range of 2.5–6.0). A final point relates to the potential confounding of intercurrent relapses. It has been suggested that the observed effect seen in the European SPMS trial was due to an effect on relapse rather than pure disability.9 This hypothesis may also explain the lack of benefit observed in the North American SPMS trial which had a lower pre-trial and in-trial annualised relapse rate (ARR).12 The MIMS trial entry ARR was higher at 1.33, with the in-trial rates being 0.35 (active high dose) and 1.02 (placebo).14 This could be compared to the MAESTRO trial entry rate of 0.09.40 A low entry ARR and/or little change in-trial, again would add weight to disability being driven by progression rather than relapse reduction. In the OLYMPUS trial, whilst no overall effect was seen, the inflammatory sub-group with GdE lesions at baseline were observed to benefit.20
Following on from the pre-trial progression rate, is the expected and actual in-trial proportion with progression. This is a vital parameter, from which the power of the trial is derived. Most trials postulate an effect size of 30–50% with powers of 80–90%. Crucial is the behavior of the placebo arm in terms of expected and actual progression, if this group does not progress as anticipated, the power of the trial is reduced. In SPMS, common projections are 30–45% with progression over 2-years and 35–65% with progression over 3-years. In the CUPID trial (figure 1),22 a pre-trial progression rate of 70% was anticipated, but the actual rate was 60%; the NASG trial estimated 50%, but had an actual rate of 35%.41 The PROMiSE trial in PPMS was terminated early due to lack of progression.19 Mean change in EDSS is generally not used as the primary outcome because of the ordinal nature of the scale, though estimates of power based on mean EDSS have been used, for example in the cyclosporine trial where detection of a mean EDSS difference of 0.5 was used against placebo.6 Alternatively MSFC changes were used in IMPACT which may have a stronger statistical grounding.13 Additionally, some studies have mixed PMS with other ‘progressive relapsing or chronic progressive forms’ (eg in CCMSGG it was 50%,7 in British and Dutch Azathioprine it was 20%5). Whilst those terminologies are no longer used, and are being actively evolved,1 there are proponents on both sides for the pure or mixed PP/SP approach.
Figure 1.

The allowance for SPMS cohorts to use concurrent anti-inflammatory DMT depends in part on location (anti-inflammatory therapies are typically not reimbursed for PMS patients outside of the US), and in part due to regulatory preference. Patients entered into SPMS trials tend to be off immuno-suppressants for ≥6 months and off corticosteroids for ≥1 month.
Diagnosis
The diagnosis of PMS is a clinical judgment, without a gold standard diagnostic test. When evaluating an individual patient, differentiating PMS from other gradually progressive neurological disorders is not always straightforward,42 and there is growing consensus that relapsing and PMS are not distinct entities.1 The progressive part of MS probably starts during the acute inflammatory stage and accordingly, the distinction of RRMS versus SPMS for enrollment into clinical trials is artificially binary. Moreover, differentiating PPMS from SPMS relies upon patient memory (which may be flawed) of typical demyelinating episodes, which makes for a weak diagnostic classification. Recently, there has been a shift away from these strict sub-type classifications and instead replacing them with two main classifications: the presence or absence of acute inflammation (i.e. relapses or active lesions on MRI), and the presence or absence of gradual progression.1
MS Co-morbidities
An underlying assumption of previous MS therapeutic studies is that all disease activity (i.e. relapses, lesions on MRI, and disability progression) is a product of MS alone. More recent studies have identified other factors that can impact MS disease measures. Several medical conditions can influence progression of MS, including smoking, obesity, mental, and physical disabilities.43 Although smoking has long been identified as a risk factor for developing MS, only more recently has it been identified as a modifier of disease course.44 Vitamin D has also been identified as possibly modifying disease course, and even response to an anti-inflammatory therapy.45 PMS typically affects patients in the sixth decade or later, where aging and co-morbidities typical of aging can confound clinical measures. Brain atrophy is used in Phase 2 PMS trials, yet brain atrophy is typical in healthy aging adults. Co-morbidities add complexity to the study of PMS by confounding the measures of disease, directly impacting the disease course, and potentially modifying the response to a therapeutic intervention. Such data should be collected and included as potential covariates in analysis plans.
3 Trial design
More refined trial design is a necessary step for the development of successful PMS therapies. In this section we will review potential barriers, appropriate intervention selection and novel clinical trial methods. Virtually all of the trials listed in table 1 are classical head-to-head, placebo-controlled trials, mostly using a 1:1 randomization ratio, with some exceptions.14,19,22 Alternatives to 1:1 randomisation is a difficult balance between statistical complexity and the unmet demand for patient recruitment in the face of a deteriorating disease. As we discuss below, perhaps there should be more scope in the future for multi-arm or adaptive trial designs. Trial duration is also of interest. A significant difference in confirmed (3 or 6 month) EDSS progression, over placebo, will be more likely to be observed in phase 3 trials with longer durations (say 36 months). It is not impossible that some of agents already tested have small significant effects, but perhaps up to 5 years may be required to demonstrate it in trial.
Interventions
Table 1 lists the compounds previously used, with a third being β-interferon trials, hoping to replicate the success of these drugs in RRMS. Whilst some short-term effects on 3 month confirmed disability and relapse rate were seen, the overall impact 6 month sustained progression was neutral (figure 2).46
Figure 2.
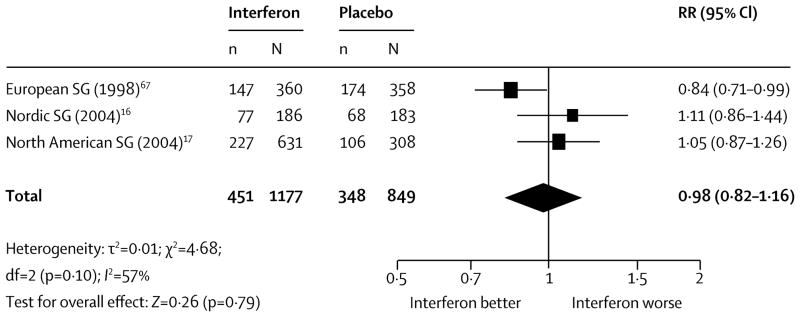
All the major classical immunosuppressive drugs have been tried, involving over 1000 people. On occasion there has been some signal of effect, though for example complicated by a mixed (relapsing) cohort such as with mitoxantrone.14 The details of the largest azathioprine trial (n=354) is given in the table, where only about a third of the cohort had PMS.5 Three smaller studies with azathioprine have included patients with PMS (n=186), although the final conclusion regarding an effect on progression is unclear.47 Likewise smaller trials of cyclophosphamide have taken place with a similar lack of effect on progression.48
More novel recent approaches with the use of gamma-globulin, myelin basic protein and synthetic cannabinoids have not been successful.17,22,40 The process and sequence of novel target identification is described in the accompanying paper.
Drop-out rate
Over the spectrum of the SPMS trials, the retention has generally been good for primary outcome, with 80–90% being typical. Perhaps not unexpectedly, drugs such as cyclosporine have had relatively high rates of patients not completing the final trial follow-up. A high discontinuation rate in the cyclosporine trial required the study to be re-designed in trial, underlining the importance of feasibility testing.6
Novel clinical Trial Design
More efficient conduct of PMS trials has become a high priority. Adaptive clinical trial design permits modifications during the conduct of the study with the goal of added efficiency through testing more treatments in less time and with fewer subjects. However, adaptive designs might raise particular ethical challenges, such as the increased complexity of informed consent and patient burden.49 Scientific issues such as maintaining investigator blinding and selection of outcomes may be more arduous.50
In adaptive randomization design the probability of treatment assignment can vary based ongoing analysis of data. Biomarker-adaptive design may be useful to select populations most likely to benefit from treatments, and to select the biomarkers likely to show an effect during the conduct of a single clinical trial.51 Multi-arm trials can be conducted using a “drop the loser” design where treatment can be terminated early based on interim efficacy analysis, thus minimizing exposure to a potentially inferior treatment and focusing resources on potentially viable treatments.52 Adaptive group sequential design is a refinement of traditional group sequential design with the ability to not only halt the trial but also change outcomes, sample size and even the study hypothesis.53 Seamless phase 2/3 studies are adaptive designs that answer clinical development questions (Phase 2 and 3) in a single trial and have potential application in PMS.54,55 A first stage would include testing several potential therapeutics using biomarker outcomes, and a second stage would carry forward the most promising therapy using clinical outcomes.
Clinical Trial Conduct
Several international efforts are underway to accelerate development of MS therapies. The Progressive MS Alliance is an international alliance of MS advocacy organizations employing research strategies to connect partners across multiple scientific disciplines and fund innovative and collaborative research worldwide.56 The MS Outcome Assessments Consortium (MSOAC) is an academic-industry-regulator collaborative that aims to develop and validate a more sensitive clinical measure of disease progression through pooling of clinical trial data.57 This type of collaborative has proven effective in other diseases to develop clinically sensitive measures for therapeutic studies. By involving regulators in the development process, MSOAC can help ensure a regulatory-compliant tool at its conclusion. The output of these efforts are hoped to accelerate the clinical trial process through more efficient and effective Phase 2 and 3 trials.
Future trials
Table 3 lists the phase 2 and 3 trials underway, with projected reporting timescales. It can be seen that modern trial design has learnt a number of the lessons from the last 25 years: greater trial size; new and hopefully more relevant phase 2 outcomes such as brain atrophy; more realistic (generally) phase 3 trial durations; longer pre-trial progression entries (≥24 months).
4. Outcome Measures
The development of therapeutics in RRMS has been accelerated by the use of effective imaging outcomes in phase 2 and clinical outcomes in phase 3 studies.58 Unfortunately, similar outcomes do not exist in PMS, particularly for Phase 2 studies. Several factors must be considered when selecting an outcome measure: ideally it should be easily reproducible, sensitive to change over a short period of time and be meaningful to patients or correlate with meaningful outcomes over time. Advanced methods for clinical trial design should also allow more efficient conduct of clinical trials, testing a larger number of agents over short periods and selecting only those with the greatest likelihood of success.
Clinical Outcome Measures
Expanded Disability Status Scale (EDSS)
It was first developed by Kurtzke59 as a scale to quantify disability in MS and is based on clinical examination findings and functional status. The advantages are that it is generally accepted and understood by the neurology and regulatory community, it spans several domains of neurological function, and is grounded in symptoms relevant to patients.60 Conversely it is an ordinal scale, where variable differences between contiguous scores make analysis difficult. Inter-rater variability may be high, particularly in the ranges relevant to PMS trials.61–64 The EDSS relies heavily on lower extremity function with cognition and upper extremity function having smaller impacts.65,66 Using the EDSS to measure progression of disability has inherent problems. Several methods of calculating disability progression using EDSS have been utilized and time to worsening in EDSS (normally 0.5 or 1 point sustained for 3 or 6 months) is most commonly used. However, patients tend to plateau at certain EDSS scores (i.e. 6.0) and may remain there for a significant amount of time despite progressively worsening function. Due to the unequal distribution between EDSS steps, a given change will be dependent not only on actual progression but also on EDSS entry level.67 Although well-recognized scale for neurologists, the EDSS is severely limited as an outcome measure for PMS trials.
Multiple Sclerosis Functional Composite (MSFC)
This was designed as a quantitative multi-dimensional composite tool for the measurement of disability in MS trials.68 The MSFC involves measurement of walking speed (Timed 25 foot walk), arm function (9 Hole Peg Test), and cognition (Paced Serial Addition Test, or PASAT). Results from the three domains are then transformed to Z-scores based on a reference population and then averaged to form a composite score.69 The MSFC has advantages in being objectively obtained, has good inter-rater reliability, and can be administered by a trained technician.63,70 The MSFC has also been found to have good concurrent and predictive validity with the EDSS,71,72 patient reported outcomes,71,73–75 and MRI measures.76,77 Furthermore it has been used successfully, showing treatment effects, in clinical trials in RR and PMS.75,78–80 However the MSFC has not been accepted as a primary outcome for MS trials by regulatory agencies. A major concern is the use of Z-scores and the unknown clinical meaning of a change in the Z-score on a patient’s function. Additionally, comparing Z-scores across studies is difficult. The differential weighting of sub scores based on different reference populations may also limit the sensitivity and reliability of the measure.81 Dichotomizing the MSFC using a cutoff of 15 or 20% change for the Timed 25-foot Walk and 9- hole Peg test sustained for a 3 or 6 month time period82,83 has been used in trials, however the optimal meaningful change interval is likely to vary across the spectrum of disability. The use of a change score has also been advocated, although this measure may be less sensitive than EDSS, especially in higher ranges of disability.67 Additional potential limitations of the MSFC are the restriction to only three spheres of function and floor and ceiling effects. Recent recommendations have called for the inclusion of low contrast letter acuity to assess visual function.84,85 The PASAT has been criticized due to the impact of practice effects as well as patient frustration. The Symbol Digit Modalities Test (SDMT) has been suggested as a replacement (see below).85,86
Cognitive Outcomes
Despite the high burden of cognitive impairment in PMS,87 measurement of cognitive deficits has not been adequate in clinical trials. Several quicker tests have been developed to replace the gold standard of dedicated neuropsychological testing. The Brief Repeatable Battery of Neurospychological Tests (BRBN)88 incorporates measurements of several cognitive domains and includes the selective reminding test89, the spatial recall test,90 PASAT,91 SDMT92, Controlled Oral Word Association Test.93 The BRBN requires training and administration of the test may take as long as 90 minutes. The SDMT has emerged as one of the most sensitive among several tests across cognitive batteries and its inclusion has been proposed in the MSFC86,94 as well as a clinical trial outcome metric.95 SDMT can be administered in less than 3 minutes, requires minimal training, is highly reproducible, and correlates well with BRBN results.96 An international effort for the use of a simplified cognitive battery for MS has been proposed and will be validated across several languages.97
Patient Reported Outcomes
Patient reported outcomes (PROs) are becoming of increasing importance in PMS trials. Several measures of health related quality of life have been used including the European Quality of Life 5D, Short Form Health Survey (SF-36, -12, and-6 forms) and these have been validated in relation to EDSS.98 The most frequently used global MS PRO is the Multiple Sclerosis Impact Scale 29,99 which has been correlated with clinical and imaging metrics specifically in PMS.100 More specific PROs designed to capture fatigue, vision, cognition, gait, sphincter function, and pain have been developed for MS. PROs may be used as an anchor to validate MRI or clinical metrics. The increase use of PROs in PMS trials will provide a rich data set for validation of new metrics and will help satisfy regulator’s requirements that therapies demonstrate relevant benefit for patients.
Imaging Outcome Measures
Clinical measures are typically slow to change, often requiring a large number of patients and long follow-up to show effects. Biomarkers that enable quick screening of compounds in phase 2 PMS trials are needed. Sensitive imaging tools will decrease study duration and the number of subjects needed.
Whole Brain Atrophy
Quantification of brain atrophy has been extensively used in trials of RRMS and atrophy is a logical outcome measure for phase 2 PMS trials. Since the accumulation of disability in MS is thought to be related to ongoing neuroaxonal loss,101,102 atrophy may be a sensitive biomarker for clinical progression of the disease. Several methods exist to quantify brain atrophy using highly automated approaches. Registration based techniques include structural image evaluation using normalization of atrophy (SIENA and BSI)and statistical parametric mapping (SPM). Segmentation based techniques include brain parenchymal fraction (BPF) and SIENAX. Whole brain atrophy measures have been validated with EDSS and the temporal evolution of brain atrophy has been well established.103,104 A comparison of sample size estimates for SPMS105 found that SIENA was more robust than SEINAX and CCV, with 80% power to detect a 50% treatment effect with as little as 27 patients per arm over 3 years with semi-annul MRI acquisitions. A 50% effect size may be an overly optimistic goal for some therapies, and sample sizes for more modest slowing of brain atrophy progression will be considerably larger. Many anti-inflammatory MS therapies cause a loss of brain volume in the first year of treatment, which is called pseudo-atrophy.30,106 Although its implication in PMS is not fully understood, the possibility of pseudoatrophy should be considered when planning a PMS study, and the timing of outcomes should be selected accordingly.
Grey Matter Atrophy
Extensive grey matter demyelination has been found in PMS and the cortex is thought to be a primary site of neurodegeneration.107–110 Cortical atrophy has been correlated both with disability and with cognitive function in cross-sectional and longitudinal studies.110–112 Grey matter atrophy is better than white atrophy at predicting clinical disability and thus is considered a good potential outcome for PMS trials.113
Cerebral cortex thickness is an attractive cortical atrophy measure, having correlations with disability independent of focal white matter lesions.114 Free surfer is the most widely available automated tool for assessment of cortical thickness.115,116 A significant limitation is misclassification of lesional tissue as cortex. The use of lesion masks can help, although this process requires manual input and is time consuming. Several promising semi-automated longitudinal methods have been developed to measure cortical atrophy.117,118 Sample size estimates using cortical thickness showed sample sizes as small as 26 per arm to detect a 50% effect size over three years.118
Advanced Brain MRI Techniques
Several newer outcomes have been considered in PMS clinical trials. Techniques which measure brain tissue integrity may be more sensitive than measures of volume change. Diffusion tensor imaging (DTI) estimates the three dimensional diffusion of water in brain tissue and has been explored as an outcome in MS.119,120 DTI has the advantage of characterizing pathological correlates and specific anatomic and functional tracts.121
Magnetization transfer ratio (MTR) MRI has been proposed as a marker of brain myelin content including the cerebral cortex.122,123 Cortical and normal appearing grey matter MTR correlates strongly with measures of disability such as the MSFC and can show treatment effects.124,125
Identification of cortical lesions using high field magnets and special imaging sequences such as double inversion recovery has opened the possibility for cortical lesions as potential outcome metrics for PMS.126 However, only 10–20% of cortical lesions are detected even with the most sensitive techniques.127 A significant challenge with DTI, MTR, and cortical lesions is multi-center implementation, although some progress has been made.128
Spinal Cord Imaging
The accrual of disability in PMS is in part related to the accumulation of injury and neurodegeneration in the spinal cord.129 Although previously ignored, the spinal cord may play a growing role in PMS trials. Advanced spinal cord imaging modalities including DTI and MTR may also be useful, although standardized implementation in a multi-center trial is still challenging.130,131
Optical Coherence Tomography (OCT)
This is a noninvasive, quantitative, and low cost imaging technique which provides high resolution images of the retina.132 In MS, OCT has been used to quantify the retinal nerve fiber layer (RNFL) and ganglion cell layer (GCL). The RNFL is correlated with MS visual function, pathology, brain atrophy, and overall disability.133,134 GCL also correlates with EDSS.135 Macular volume has also been proposed as a measure of neuronal loss.136 Progressive thinning of the RNFL has been observed despite lack of inflammatory episodes, making this measure a compelling model for neurodegeneration.137
5. Cerebrospinal Fluid Biomarkers
The search for biomarkers in MS has been a challenging and at times a disappointing endeavour. The case is no different for PMS where the challenge is to find cerebrospinal fluid (CSF) biomarkers which reflect the ongoing neurodegenerative process and then to validate these biomarkers along with clinical as well as MRI data.138 Clinical trials represent an ideal setting for validating a CSF biomarker, and a push to incorporate CSF testing and banking in all PMS studies is an ongoing priority.
Axonal biomarkers
Among CSF measures of axonal origin, neurofilament (Nf) chains have received significant attention as potential measures of axonal injury. Heavy (NfH) and Light chain (NfL) neurofilament reflect ongoing tissue destruction associated with gadolinium enhancing lesions in RRMS.139 NfL measurements have been found to be elevated in PMS,140 correlate with EDSS scores,141 and an ELISA based technique for measuring NfL has been developed and validated.142 NfL levels also have shown sensitivity to treatment effects in RRMS.142,143 NfL is currently being used in several PMS trials in Europe144 and the United States 145 and correlations with detailed clinical and MRI data will be available. Tubulin and actin are also axonal markers which correlate with EDSS and may represent viable future biomarkers for PMS.146
Glial/astrocyte biomarkers
Glial fibrilary acidic protein (GFAP) is elevated in SPMS and correlates with EDSS.147 GFAP increases over time in SPMS and is predictive of future disability,148 making GFAP an attractive biomarker outcome for trials in PMS. S100B is a marker of astrocytic activation and, in addition to GFAP, is increased in the grey matter of post-mortem MS subjects.147
6. Lessons Learnt and Conclusions
The identification of effective therapies for PMS continues as the major unmet need in MS therapeutics. The tables illustrate the failure of classical immunosuppressants and anti-relapse disease-modifying treatments; it is clear that new molecules and targets are needed with high prior chances of success. In parallel to maximize the return, a more refined and efficient approach to testing them is vital. From the trials conducted to date and from observational studies a number of lessons can be drawn out and applied to future PMS trials (panel 2). Interventions should be selected that have shown evidence in bench top models of the disease and known pathways, though of course this is constrained by the lack optimal animal models of PMS.149 These therapies should be further selected based on an adequate risk benefit profile drawing from phase 1 studies. Repurposing of drugs should be considered. Phase 3 studies in PMS should be carried out after phase 2 trials have shown clear evidence of proof of concept. Novel imaging methods should be employed not only to understand if an intervention is working, but how it has an effect on the brain or spinal cord. This should be supplemented by other modalities such as CSF analysis. Subjects for PMS trials should be selected to ensure they are actively progressing and have minimal inflammatory activity. It would seem appropriate that SPMS patient may continue standard disease modifying agent according to local practice if these are already in use prior to the study, but concurrent immunosuppressants should be avoided. Phase 3 trials should have a duration of at least 36 months alongside a realistic calculation of the proportion of placebo patients who will progress. Studies should be designed to detect differences in 6 month confirmed progression of the primary outcome as minimum. Clinical measures apart from the EDSS are needed urgently, including cognitive testing and patient reported outcomes. Innovative (adaptive/multi-arm) trial designs which minimize the number and time of patient exposure to futile therapies should be encouraged.150
As many compounds enter the clinical trial arena, (table 3 lists nearly 20 studies involving 6000 subjects in the next 5 years alone) and our understanding of the disease improves, the prospects of finding true disease modification in PMS are higher than ever.
Footnotes
Author Contributions:
Daniel Ontaneda: literature search, drafting, editing
Robert Fox: literature search, drafting, editing
Jeremy Chataway: literature search, drafting, editing
Author disclosures:
Dr. Ontaneda reports grants from NIH CTSC KL2TR0000440, during the conduct of the study; personal fees from Acorda Therapeutics, personal fees from Biogen Idec, personal fees from Alkermes, personal fees from Genzyme, personal fees from Novartis, outside the submitted work;.
Dr. Fox reports grants from NINDS/NIH, during the conduct of the study; personal fees from Allozyne, personal fees from Avanir, personal fees and other from Biogen-Idec, grants, personal fees and other from Novartis, personal fees from Questcor, personal fees from Teva, personal fees from Xenoport, outside the submitted work;. Dr. Fox is PI of the SPRINT-MS trial, and serves on the steering committee for the BAF312 in SPMS trial.
Dr. Chataway reports a grants from: Efficacy and Mechanism Evaluation Board (EME), Multiple Sclerosis Trials Collaboration (MSTC), Moulton Foundation (Charity) and Berkeley Foundation (Charity). He is the CI of the MS-STAT and MS-SMART trials. He was the local PI of the following trials: ASCEND (Biogen), INFORMS (Novartis), and MAESTRO (BioMS) during the conduct of the study. He has received a grant from NOVARTIS outside the submitted work. Relevant to this article he has taken part in the following trials in progressive MS: MAESTRO, CUPID, Lamotrigine, INFORMS and ASCEND. He receives support from the National Institute of Health Research (NIHR) University College London Hospitals/UCL Biomedical Research Centres funding scheme.
Publisher's Disclaimer: This is a PDF file of an unedited manuscript that has been accepted for publication. As a service to our customers we are providing this early version of the manuscript. The manuscript will undergo copyediting, typesetting, and review of the resulting proof before it is published in its final citable form. Please note that during the production process errors may be discovered which could affect the content, and all legal disclaimers that apply to the journal pertain.
Contributor Information
Daniel Ontaneda, Mellen Center for Multiple Sclerosis Treatment and Research, Cleveland Clinic, Cleveland Ohio, USA.
Robert J. Fox, Mellen Center for Multiple Sclerosis Treatment and Research, Cleveland Clinic, Cleveland Ohio, USA.
Jeremy Chataway, Queen Square Multiple Sclerosis Centre, Department of Neuroinflammation, UCL Institute of Neurology, University College London and National Hospital for Neurology and Neurosurgery, University College London Hospitals NHS Foundation Trust, London UK.
References
- 1.Lublin FD, Reingold SC, Cohen JA, et al. Defining the clinical course of multiple sclerosis: The 2013 revisions. Neurology. 2014;83(3):278–286. doi: 10.1212/WNL.0000000000000560. [DOI] [PMC free article] [PubMed] [Google Scholar]
- 2.Trapp BD, Nave KA. Multiple sclerosis: An immune or neurodegenerative disorder? Annu Rev Neurosci. 2008;31:247–269. doi: 10.1146/annurev.neuro.30.051606.094313. [DOI] [PubMed] [Google Scholar]
- 3.Miller AE, Rhoades RW. Treatment of relapsing-remitting multiple sclerosis: Current approaches and unmet needs. Curr Opin Neurol. 2012;25 (Suppl):S4–10. doi: 10.1097/01.wco.0000413319.87092.19. [DOI] [PubMed] [Google Scholar]
- 4.Wiendl H, Hohlfeld R. Multiple sclerosis therapeutics: Unexpected outcomes clouding undisputed successes. Neurology. 2009;72(11):1008–1015. doi: 10.1212/01.wnl.0000344417.42972.54. [DOI] [PubMed] [Google Scholar]
- 5.British And Dutch Multiple Sclerosis Azathioprine Trial Group. Double-masked trial of azathioprine in multiple sclerosis. british and dutch multiple sclerosis azathioprine trial group. Lancet. 1988;2(8604):179–183. [PubMed] [Google Scholar]
- 6.The Multiple Sclerosis Study Group. Efficacy and toxicity of cyclosporine in chronic progressive multiple sclerosis: A randomized, double-blinded, placebo-controlled clinical trial. Ann Neurol. 1990;27(6):591–605. doi: 10.1002/ana.410270603. [DOI] [PubMed] [Google Scholar]
- 7.The Canadian Cooperative Multiple Sclerosis Study Group. The canadian cooperative trial of cyclophosphamide and plasma exchange in progressive multiple sclerosis. Lancet. 1991;337(8739):441–446. [PubMed] [Google Scholar]
- 8.Noseworthy JH, O’Brien P, Erickson BJ, et al. The mayo clinic-canadian cooperative trial of sulfasalazine in active multiple sclerosis. Neurology. 1998;51(5):1342–1352. doi: 10.1212/wnl.51.5.1342. [DOI] [PubMed] [Google Scholar]
- 9.European Study Group on interferon beta-1b in secondary progressive MS. Placebo-controlled multicentre randomised trial of interferon beta-1b in treatment of secondary progressive multiple sclerosis. Lancet. 1998;352(9139):1491–1497. [PubMed] [Google Scholar]
- 10.Noseworthy JH, Wolinsky JS, Lublin FD, et al. Linomide in relapsing and secondary progressive MS: Part I: Trial design and clinical results. north american linomide investigators. Neurology. 2000;54(9):1726–1733. doi: 10.1212/wnl.54.9.1726. [DOI] [PubMed] [Google Scholar]
- 11.Rice GP, Filippi M, Comi G. Cladribine and progressive MS: Clinical and MRI outcomes of a multicenter controlled trial. cladribine MRI study group. Neurology. 2000;54(5):1145–1155. doi: 10.1212/wnl.54.5.1145. [DOI] [PubMed] [Google Scholar]
- 12.Secondary Progressive Efficacy Clinical Trial of Recombinant Interferon-Beta-1a in MS (SPECTRIMS) Study Group. Randomized controlled trial of interferon- beta-1a in secondary progressive MS: Clinical results. Neurology. 2001;56(11):1496–1504. doi: 10.1212/wnl.56.11.1496. [DOI] [PubMed] [Google Scholar]
- 13.Cohen JA, Cutter GR, Fischer JS, et al. Benefit of interferon beta-1a on MSFC progression in secondary progressive MS. Neurology. 2002;59(5):679–687. doi: 10.1212/wnl.59.5.679. [DOI] [PubMed] [Google Scholar]
- 14.Hartung HP, Gonsette R, Konig N, et al. Mitoxantrone in progressive multiple sclerosis: A placebo-controlled, double-blind, randomised, multicentre trial. Lancet. 2002;360(9350):2018–2025. doi: 10.1016/S0140-6736(02)12023-X. [DOI] [PubMed] [Google Scholar]
- 15.Andersen O, Elovaara I, Farkkila M, et al. Multicentre, randomised, double blind, placebo controlled, phase III study of weekly, low dose, subcutaneous interferon beta-1a in secondary progressive multiple sclerosis. J Neurol Neurosurg Psychiatry. 2004;75(5):706–710. doi: 10.1136/jnnp.2003.010090. [DOI] [PMC free article] [PubMed] [Google Scholar]
- 16.Panitch H, Goodin DS, Francis G, et al. Randomized, comparative study of interferon beta-1a treatment regimens in MS: The EVIDENCE trial. Neurology. 2002;59(10):1496–1506. doi: 10.1212/01.wnl.0000034080.43681.da. [DOI] [PubMed] [Google Scholar]
- 17.Hommes OR, Sorensen PS, Fazekas F, et al. Intravenous immunoglobulin in secondary progressive multiple sclerosis: Randomised placebo-controlled trial. Lancet. 2004;364(9440):1149–1156. doi: 10.1016/S0140-6736(04)17101-8. [DOI] [PubMed] [Google Scholar]
- 18.Pohlau D, Przuntek H, Sailer M, et al. Intravenous immunoglobulin in primary and secondary chronic progressive multiple sclerosis: A randomized placebo controlled multicentre study. Mult Scler. 2007;13(9):1107–1117. doi: 10.1177/1352458507078400. [DOI] [PubMed] [Google Scholar]
- 19.Wolinsky JS, Narayana PA, O’Connor P, et al. Glatiramer acetate in primary progressive multiple sclerosis: Results of a multinational, multicenter, double-blind, placebo-controlled trial. Ann Neurol. 2007;61(1):14–24. doi: 10.1002/ana.21079. [DOI] [PubMed] [Google Scholar]
- 20.Hawker K, O’Connor P, Freedman MS, et al. Rituximab in patients with primary progressive multiple sclerosis: Results of a randomized double-blind placebo-controlled multicenter trial. Ann Neurol. 2009;66(4):460–471. doi: 10.1002/ana.21867. [DOI] [PubMed] [Google Scholar]
- 21.Freedman MS, Bar-Or A, Atkins HL, et al. The therapeutic potential of mesenchymal stem cell transplantation as a treatment for multiple sclerosis: Consensus report of the international MSCT study group. Mult Scler. 2010;16(4):503–510. doi: 10.1177/1352458509359727. [DOI] [PubMed] [Google Scholar]
- 22.Zajicek J, Ball S, Wright D, et al. Effect of dronabinol on progression in progressive multiple sclerosis (CUPID): A randomised, placebo-controlled trial. Lancet Neurol. 2013;12(9):857–865. doi: 10.1016/S1474-4422(13)70159-5. [DOI] [PMC free article] [PubMed] [Google Scholar]
- 23.Schulz KF, Altman DG, Moher D CONSORT Group. CONSORT 2010 statement: Updated guidelines for reporting parallel group randomised trials. Trials. 2010;11:32–6215-11-32. [Google Scholar]
- 24.Paolillo A, Coles AJ, Molyneux PD, et al. Quantitative MRI in patients with secondary progressive MS treated with monoclonal antibody campath 1H. Neurology. 1999;53(4):751–757. doi: 10.1212/wnl.53.4.751. [DOI] [PubMed] [Google Scholar]
- 25.Coles AJ, Cox A, Le Page E, et al. The window of therapeutic opportunity in multiple sclerosis: Evidence from monoclonal antibody therapy. J Neurol. 2006;253(1):98–108. doi: 10.1007/s00415-005-0934-5. [DOI] [PubMed] [Google Scholar]
- 26.Warren KG, Catz I, Ferenczi LZ, Krantz MJ. Intravenous synthetic peptide MBP8298 delayed disease progression in an HLA class II-defined cohort of patients with progressive multiple sclerosis: Results of a 24-month double-blind placebo-controlled clinical trial and 5 years of follow-up treatment. Eur J Neurol. 2006;13(8):887–895. doi: 10.1111/j.1468-1331.2006.01533.x. [DOI] [PubMed] [Google Scholar]
- 27.Connick P, Kolappan M, Crawley C, et al. Autologous mesenchymal stem cells for the treatment of secondary progressive multiple sclerosis: An open-label phase 2a proof-of-concept study. Lancet Neurol. 2012;11(2):150–156. doi: 10.1016/S1474-4422(11)70305-2. [DOI] [PMC free article] [PubMed] [Google Scholar]
- 28.Reston JT, Uhl S, Treadwell JR, Nash RA, Schoelles K. Autologous hematopoietic cell transplantation for multiple sclerosis: A systematic review. Mult Scler. 2011;17(2):204–213. doi: 10.1177/1352458510383609. [DOI] [PubMed] [Google Scholar]
- 29.Chataway J, Schuerer N, Alsanousi A, et al. Effect of high-dose simvastatin on brain atrophy and disability in secondary progressive multiple sclerosis (MS-STAT): A randomised, placebo-controlled, phase 2 trial. The Lancet. doi: 10.1016/S0140-6736(13)62242-4. (0) [DOI] [PubMed] [Google Scholar]
- 30.Kapoor R, Furby J, Hayton T, et al. Lamotrigine for neuroprotection in secondary progressive multiple sclerosis: A randomised, double-blind, placebo-controlled, parallel-group trial. Lancet Neurol. 2010;9(7):681–688. doi: 10.1016/S1474-4422(10)70131-9. [DOI] [PubMed] [Google Scholar]
- 31.Karussis DM, Meiner Z, Lehmann D, et al. Treatment of secondary progressive multiple sclerosis with the immunomodulator linomide: A double-blind, placebo-controlled pilot study with monthly magnetic resonance imaging evaluation. Neurology. 1996;47(2):341–346. doi: 10.1212/wnl.47.2.341. [DOI] [PubMed] [Google Scholar]
- 32.Sipe JC, Romine JS, Koziol JA, McMillan R, Zyroff J, Beutler E. Cladribine in treatment of chronic progressive multiple sclerosis. Lancet. 1994;344(8914):9–13. doi: 10.1016/s0140-6736(94)91046-4. [DOI] [PubMed] [Google Scholar]
- 33.Khatri B, Barkhof F, Comi G, et al. Comparison of fingolimod with interferon beta-1a in relapsing-remitting multiple sclerosis: A randomised extension of the TRANSFORMS study. Lancet Neurol. 2011;10(6):520–529. doi: 10.1016/S1474-4422(11)70099-0. [DOI] [PubMed] [Google Scholar]
- 34.Gordon PA, Carroll DJ, Etches WS, et al. A double-blind controlled pilot study of plasma exchange versus sham apheresis in chronic progressive multiple sclerosis. Can J Neurol Sci. 1985;12(1):39–44. doi: 10.1017/s0317167100046564. [DOI] [PubMed] [Google Scholar]
- 35.Barkhof F, Hulst HE, Drulovic J, et al. Ibudilast in relapsing-remitting multiple sclerosis: A neuroprotectant? Neurology. 2010;74(13):1033–1040. doi: 10.1212/WNL.0b013e3181d7d651. [DOI] [PubMed] [Google Scholar]
- 36.van Oosten BW, Lai M, Hodgkinson S, et al. Treatment of multiple sclerosis with the monoclonal anti-CD4 antibody cM-T412: Results of a randomized, double-blind, placebo-controlled, MR-monitored phase II trial. Neurology. 1997;49(2):351–357. doi: 10.1212/wnl.49.2.351. [DOI] [PubMed] [Google Scholar]
- 37.Arun T, Tomassini V, Sbardella E, et al. Targeting ASIC1 in primary progressive multiple sclerosis: Evidence of neuroprotection with amiloride. Brain. 2013;136(Pt 1):106–115. doi: 10.1093/brain/aws325. [DOI] [PubMed] [Google Scholar]
- 38.Karpha I, Ramtahal J, Boggild M, Evans F. PAW25 A single-centre, pilot, randomised controlled trial of recombinant human erythropoietin in primary progressive multiple sclerosis. Journal of Neurology, Neurosurgery & Psychiatry. 2010;81(11):e30–e30. [Google Scholar]
- 39.Spelman T, Trojano M, Duquette P, et al. Defining secondary progressive multiple sclerosis: Is it possible to diagnose early? Mult Scler. 2013;19(S1):38. [Google Scholar]
- 40.Freedman MS, Bar-Or A, Oger J, et al. A phase III study evaluating the efficacy and safety of MBP8298 in secondary progressive MS. Neurology. 2011;77(16):1551–1560. doi: 10.1212/WNL.0b013e318233b240. [DOI] [PubMed] [Google Scholar]
- 41.Panitch H, Miller A, Paty D, Weinshenker B North American Study Group on Interferon beta-1b in Secondary Progressive MS. Interferon beta-1b in secondary progressive MS: Results from a 3-year controlled study. Neurology. 2004;63(10):1788–1795. doi: 10.1212/01.wnl.0000146958.77317.3e. [DOI] [PubMed] [Google Scholar]
- 42.Miller DH, Weinshenker BG, Filippi M, et al. Differential diagnosis of suspected multiple sclerosis: A consensus approach. Mult Scler. 2008;14(9):1157–1174. doi: 10.1177/1352458508096878. [DOI] [PMC free article] [PubMed] [Google Scholar]
- 43.Marrie R, Horwitz R, Cutter G, Tyry T, Campagnolo D, Vollmer T. Comorbidity, socioeconomic status and multiple sclerosis. Mult Scler. 2008;14(8):1091–1098. doi: 10.1177/1352458508092263. [DOI] [PubMed] [Google Scholar]
- 44.Manouchehrinia A, Tench CR, Maxted J, Bibani RH, Britton J, Constantinescu CS. Tobacco smoking and disability progression in multiple sclerosis: United kingdom cohort study. Brain. 2013;136(Pt 7):2298–2304. doi: 10.1093/brain/awt139. [DOI] [PMC free article] [PubMed] [Google Scholar]
- 45.Ascherio A, Munger KL, White R, et al. Vitamin d as an early predictor of multiple sclerosis activity and progression. JAMA Neurol. 2014;71(3):306–314. doi: 10.1001/jamaneurol.2013.5993. [DOI] [PMC free article] [PubMed] [Google Scholar]
- 46.La Mantia L, Vacchi L, Di Pietrantonj C, et al. Interferon beta for secondary progressive multiple sclerosis. Cochrane Database Syst Rev. 2012;1:CD005181. doi: 10.1002/14651858.CD005181.pub3. [DOI] [PMC free article] [PubMed] [Google Scholar]
- 47.Casetta I, Iuliano G, Filippini G. Azathioprine for multiple sclerosis. Cochrane Database Syst Rev. 2007;(4):CD003982. doi: 10.1002/14651858.CD003982.pub2. [DOI] [PMC free article] [PubMed] [Google Scholar]
- 48.La Mantia L, Milanese C, Mascoli N, D’Amico R, Weinstock-Guttman B. Cyclophosphamide for multiple sclerosis. Cochrane Database Syst Rev. 2007;(1):CD002819. doi: 10.1002/14651858.CD002819.pub2. [DOI] [PMC free article] [PubMed] [Google Scholar]
- 49.van der Graaf R, Roes KC, van Delden JJ. Adaptive trials in clinical research: Scientific and ethical issues to consider. JAMA. 2012;307(22):2379–2380. doi: 10.1001/jama.2012.6380. [DOI] [PubMed] [Google Scholar]
- 50.Chow SC, Chang M. Adaptive design methods in clinical trials - a review. Orphanet J Rare Dis. 2008;3:11–1172-3-11. doi: 10.1186/1750-1172-3-11. [DOI] [PMC free article] [PubMed] [Google Scholar]
- 51.Wason J, Marshall A, Dunn J, Stein RC, Stallard N. Adaptive designs for clinical trials assessing biomarker-guided treatment strategies. Br J Cancer. 2014 doi: 10.1038/bjc.2014.156. [DOI] [PMC free article] [PubMed] [Google Scholar]
- 52.Thall PF, Millikan RE, Sung HG. Evaluating multiple treatment courses in clinical trials. Stat Med. 2000;19(8):1011–1028. doi: 10.1002/(sici)1097-0258(20000430)19:8<1011::aid-sim414>3.0.co;2-m. [DOI] [PubMed] [Google Scholar]
- 53.Muller HH, Schafer H. Adaptive group sequential designs for clinical trials: Combining the advantages of adaptive and of classical group sequential approaches. Biometrics. 2001;57(3):886–891. doi: 10.1111/j.0006-341x.2001.00886.x. [DOI] [PubMed] [Google Scholar]
- 54.Friede T, Parsons N, Stallard N, et al. Designing a seamless phase II/III clinical trial using early outcomes for treatment selection: An application in multiple sclerosis. Stat Med. 2011;30(13):1528–1540. doi: 10.1002/sim.4202. [DOI] [PubMed] [Google Scholar]
- 55.Chataway J, Nicholas R, Todd S, et al. A novel adaptive design strategy increases the efficiency of clinical trials in secondary progressive multiple sclerosis. Mult Scler. 2011;17(1):81–88. doi: 10.1177/1352458510382129. [DOI] [PubMed] [Google Scholar]
- 56. [Accessed 4/25/2014, 2014];Connect to end progressive MS | MSIF. http://www.msif.org/global-ms-research/current-ms-research-areas/progressive-ms.aspx.
- 57.Rudick RA, Larocca N, Hudson LD, MSOAC Multiple sclerosis outcome assessments consortium: Genesis and initial project plan. Mult Scler. 2014;20(1):12–17. doi: 10.1177/1352458513503392. [DOI] [PubMed] [Google Scholar]
- 58.Barkhof F, Simon JH, Fazekas F, et al. MRI monitoring of immunomodulation in relapse-onset multiple sclerosis trials. Nat Rev Neurol. 2011;8(1):13–21. doi: 10.1038/nrneurol.2011.190. [DOI] [PubMed] [Google Scholar]
- 59.Kurtzke JF. Rating neurologic impairment in multiple sclerosis: An expanded disability status scale (EDSS) Neurology. 1983;33(11):1444–1452. doi: 10.1212/wnl.33.11.1444. [DOI] [PubMed] [Google Scholar]
- 60.Hobart J, Freeman J, Thompson A. Kurtzke scales revisited: The application of psychometric methods to clinical intuition. Brain. 2000;123(Pt 5):1027–1040. doi: 10.1093/brain/123.5.1027. [DOI] [PubMed] [Google Scholar]
- 61.Noseworthy JH, Vandervoort MK, Wong CJ, Ebers GC. Interrater variability with the expanded disability status scale (EDSS) and functional systems (FS) in a multiple sclerosis clinical trial. the canadian cooperation MS study group. Neurology. 1990;40(6):971–975. doi: 10.1212/wnl.40.6.971. [DOI] [PubMed] [Google Scholar]
- 62.Whitaker JN, McFarland HF, Rudge P, Reingold SC. Outcomes assessment in multiple sclerosis clinical trials: A critical analysis. Mult Scler. 1995;1(1):37–47. doi: 10.1177/135245859500100107. [DOI] [PubMed] [Google Scholar]
- 63.Hobart J, Kalkers N, Barkhof F, Uitdehaag B, Polman C, Thompson A. Outcome measures for multiple sclerosis clinical trials: Relative measurement precision of the expanded disability status scale and multiple sclerosis functional composite. Mult Scler. 2004;10(1):41–46. doi: 10.1191/1352458504ms983oa. [DOI] [PubMed] [Google Scholar]
- 64.Verdier-Taillefer MH, Zuber M, Lyon-Caen O, et al. Observer disagreement in rating neurologic impairment in multiple sclerosis: Facts and consequences. Eur Neurol. 1991;31(2):117–119. doi: 10.1159/000116658. [DOI] [PubMed] [Google Scholar]
- 65.Lamers I, Feys P. Assessing upper limb function in multiple sclerosis. Mult Scler. 2014 doi: 10.1177/1352458514525677. [DOI] [PubMed] [Google Scholar]
- 66.Brissart H, Sauvee M, Latarche C, Dillier C, Debouverie M. Integration of cognitive impairment in the expanded disability status scale of 215 patients with multiple sclerosis. Eur Neurol. 2010;64(6):345–350. doi: 10.1159/000322140. [DOI] [PubMed] [Google Scholar]
- 67.Kragt JJ, Thompson AJ, Montalban X, et al. Responsiveness and predictive value of EDSS and MSFC in primary progressive MS. Neurology. 2008;70(13 Pt 2):1084–1091. doi: 10.1212/01.wnl.0000288179.86056.e1. [DOI] [PubMed] [Google Scholar]
- 68.Rudick R, Antel J, Confavreux C, et al. Recommendations from the national multiple sclerosis society clinical outcomes assessment task force. Ann Neurol. 1997;42(3):379–382. doi: 10.1002/ana.410420318. [DOI] [PubMed] [Google Scholar]
- 69.Cutter GR, Baier ML, Rudick RA, et al. Development of a multiple sclerosis functional composite as a clinical trial outcome measure. Brain. 1999;122(Pt 5):871–882. doi: 10.1093/brain/122.5.871. [DOI] [PubMed] [Google Scholar]
- 70.Rudick RA, Cutter G, Reingold S. The multiple sclerosis functional composite: A new clinical outcome measure for multiple sderosis trials. Mult Scler. 2002;8(5):359–365. doi: 10.1191/1352458502ms845oa. [DOI] [PubMed] [Google Scholar]
- 71.Miller DM, Rudick RA, Cutter G, Baier M, Fischer JS. Clinical significance of the multiple sclerosis functional composite: Relationship to patient-reported quality of life. Arch Neurol. 2000;57(9):1319–1324. doi: 10.1001/archneur.57.9.1319. [DOI] [PubMed] [Google Scholar]
- 72.Rudick RA, Polman CH, Cohen JA, et al. Assessing disability progression with the multiple sclerosis functional composite. Mult Scler. 2009;15(8):984–997. doi: 10.1177/1352458509106212. [DOI] [PubMed] [Google Scholar]
- 73.Costelloe L, O’Rourke K, McGuigan C, Walsh C, Tubridy N, Hutchinson M. The longitudinal relationship between the patient-reported multiple sclerosis impact scale and the clinician-assessed multiple sclerosis functional composite. Mult Scler. 2008;14(2):255–258. doi: 10.1177/1352458507081274. [DOI] [PubMed] [Google Scholar]
- 74.Ozakbas S, Cagiran I, Ormeci B, Idiman E. Correlations between multiple sclerosis functional composite, expanded disability status scale and health-related quality of life during and after treatment of relapses in patients with multiple sclerosis. J Neurol Sci. 2004;218(1–2):3–7. doi: 10.1016/j.jns.2003.09.015. [DOI] [PubMed] [Google Scholar]
- 75.Cohen JA, Cutter GR, Fischer JS, et al. Benefit of interferon beta-1a on MSFC progression in secondary progressive MS. Neurology. 2002;59(5):679–687. doi: 10.1212/wnl.59.5.679. [DOI] [PubMed] [Google Scholar]
- 76.Kalkers NF, Bergers L, de Groot V, et al. Concurrent validity of the MS functional composite using MRI as a biological disease marker. Neurology. 2001;56(2):215–219. doi: 10.1212/wnl.56.2.215. [DOI] [PubMed] [Google Scholar]
- 77.Fisher E, Rudick RA, Cutter G, et al. Relationship between brain atrophy and disability: An 8-year follow-up study of multiple sclerosis patients. Mult Scler. 2000;6(6):373–377. doi: 10.1177/135245850000600602. [DOI] [PubMed] [Google Scholar]
- 78.Cadavid D, Kim S, Peng B, et al. Clinical consequences of MRI activity in treated multiple sclerosis. Mult Scler. 2011;17(9):1113–1121. doi: 10.1177/1352458511405375. [DOI] [PubMed] [Google Scholar]
- 79.Kappos L, Radue EW, O’Connor P, et al. A placebo-controlled trial of oral fingolimod in relapsing multiple sclerosis. N Engl J Med. 2010;362(5):387–401. doi: 10.1056/NEJMoa0909494. [DOI] [PubMed] [Google Scholar]
- 80.Balcer LJ, O’Connor PW, Havrdova E. The effects of natalizumab on disability progression as measured by the multiple sclerosis functional composite (MSFC) and visual function in patients with relapsing MS. Presented at 18th World Congress of Neurology; November 9; Sydney, Australia. 2005. [Google Scholar]
- 81.Fox RJ, Lee JC, Rudick RA. Optimal reference population for the multiple sclerosis functional composite. Mult Scler. 2007;13(7):909–914. doi: 10.1177/1352458507076950. [DOI] [PubMed] [Google Scholar]
- 82.Kragt JJ, van der Linden FA, Nielsen JM, Uitdehaag BM, Polman CH. Clinical impact of 20% worsening on timed 25-foot walk and 9-hole peg test in multiple sclerosis. Mult Scler. 2006;12(5):594–598. doi: 10.1177/1352458506070768. [DOI] [PubMed] [Google Scholar]
- 83.Rudick RA, Polman CH, Cohen JA, et al. Assessing disability progression with the multiple sclerosis functional composite. Mult Scler. 2009;15(8):984–997. doi: 10.1177/1352458509106212. [DOI] [PubMed] [Google Scholar]
- 84.Balcer LJ, Baier ML, Cohen JA, et al. Contrast letter acuity as a visual component for the multiple sclerosis functional composite. Neurology. 2003;61(10):1367–1373. doi: 10.1212/01.wnl.0000094315.19931.90. [DOI] [PubMed] [Google Scholar]
- 85.Ontaneda D, Larocca N, Coetzee T, Rudick R. Revisiting the multiple sclerosis functional composite: Proceedings from the national multiple sclerosis society (NMSS) task force on clinical disability measures. Mult Scler. 2012 doi: 10.1177/1352458512451512. [DOI] [PubMed] [Google Scholar]
- 86.Brochet B, Deloire MS, Bonnet M, et al. Should SDMT substitute for PASAT in MSFC? A 5-year longitudinal study. Mult Scler. 2008;14(9):1242–1249. doi: 10.1177/1352458508094398. [DOI] [PubMed] [Google Scholar]
- 87.Julian LJ. Cognitive functioning in multiple sclerosis. Neurol Clin. 2011;29(2):507–525. doi: 10.1016/j.ncl.2010.12.003. [DOI] [PubMed] [Google Scholar]
- 88.Bever CT, Jr, Grattan L, Panitch HS, Johnson KP. The brief repeatable battery of neuropsychological tests for multiple sclerosis: A preliminary serial study. Mult Scler. 1995;1(3):165–169. doi: 10.1177/135245859500100306. [DOI] [PubMed] [Google Scholar]
- 89.Buschke H, Fuld PA. Evaluating storage, retention, and retrieval in disordered memory and learning. Neurology. 1974;24(11):1019–1025. doi: 10.1212/wnl.24.11.1019. [DOI] [PubMed] [Google Scholar]
- 90.Barbizet J, Cany E. Clinical and psychometrical study of a patient with memory disturbances. Int J Neurol. 1968;7(1):44–54. [PubMed] [Google Scholar]
- 91.Gronwall DM. Paced auditory serial-addition task: A measure of recovery from concussion. Percept Mot Skills. 1977;44(2):367–373. doi: 10.2466/pms.1977.44.2.367. [DOI] [PubMed] [Google Scholar]
- 92.Benedict RH, Duquin JA, Jurgensen S, et al. Repeated assessment of neuropsychological deficits in multiple sclerosis using the symbol digit modalities test and the MS neuropsychological screening questionnaire. Mult Scler. 2008;14(7):940–946. doi: 10.1177/1352458508090923. [DOI] [PubMed] [Google Scholar]
- 93.Borkowski J, Benton A, Spreen O. Word fluency and brain damage. neuropsychologia. Neuropsychologia. 1967;(5):135–140. [Google Scholar]
- 94.Strober L, Englert J, Munschauer F, Weinstock-Guttman B, Rao S, Benedict RH. Sensitivity of conventional memory tests in multiple sclerosis: Comparing the rao brief repeatable neuropsychological battery and the minimal assessment of cognitive function in MS. Mult Scler. 2009;15(9):1077–1084. doi: 10.1177/1352458509106615. [DOI] [PubMed] [Google Scholar]
- 95.Benedict RH, Smerbeck A, Parikh R, Rodgers J, Cadavid D, Erlanger D. Reliability and equivalence of alternate forms for the symbol digit modalities test: Implications for multiple sclerosis clinical trials. Mult Scler. 2012 doi: 10.1177/1352458511435717. [DOI] [PubMed] [Google Scholar]
- 96.Sonder JM, Burggraaff J, Knol DL, Polman CH, Uitdehaag BM. Comparing long-term results of PASAT and SDMT scores in relation to neuropsychological testing in multiple sclerosis. Mult Scler. 2014;20(4):481–488. doi: 10.1177/1352458513501570. [DOI] [PubMed] [Google Scholar]
- 97.Benedict RH, Amato MP, Boringa J, et al. Brief international cognitive assessment for MS (BICAMS): International standards for validation. BMC Neurol. 2012;12:55–2377-12-55. doi: 10.1186/1471-2377-12-55. [DOI] [PMC free article] [PubMed] [Google Scholar]
- 98.Fisk JD, Brown MG, Sketris IS, Metz LM, Murray TJ, Stadnyk KJ. A comparison of health utility measures for the evaluation of multiple sclerosis treatments. J Neurol Neurosurg Psychiatry. 2005;76(1):58–63. doi: 10.1136/jnnp.2003.017897. [DOI] [PMC free article] [PubMed] [Google Scholar]
- 99.Hobart J, Lamping D, Fitzpatrick R, Riazi A, Thompson A. The multiple sclerosis impact scale (MSIS-29): A new patient-based outcome measure. Brain. 2001;124(Pt 5):962–973. doi: 10.1093/brain/124.5.962. [DOI] [PubMed] [Google Scholar]
- 100.Hayton T, Furby J, Smith KJ, et al. Clinical and imaging correlates of the multiple sclerosis impact scale in secondary progressive multiple sclerosis. J Neurol. 2012;259(2):237–245. doi: 10.1007/s00415-011-6151-5. [DOI] [PubMed] [Google Scholar]
- 101.Trapp BD, Peterson J, Ransohoff RM, Rudick R, Mork S, Bo L. Axonal transection in the lesions of multiple sclerosis. N Engl J Med. 1998;338(5):278–285. doi: 10.1056/NEJM199801293380502. [DOI] [PubMed] [Google Scholar]
- 102.Kuhlmann T, Lingfeld G, Bitsch A, Schuchardt J, Bruck W. Acute axonal damage in multiple sclerosis is most extensive in early disease stages and decreases over time. Brain. 2002;125(Pt 10):2202–2212. doi: 10.1093/brain/awf235. [DOI] [PubMed] [Google Scholar]
- 103.De Stefano N, Giorgio A, Battaglini M, et al. Assessing brain atrophy rates in a large population of untreated multiple sclerosis subtypes. Neurology. 2010;74(23):1868–1876. doi: 10.1212/WNL.0b013e3181e24136. [DOI] [PubMed] [Google Scholar]
- 104.Rudick RA, Fisher E, Lee JC, Duda JT, Simon J. Brain atrophy in relapsing multiple sclerosis: Relationship to relapses, EDSS, and treatment with interferon beta-1a. Mult Scler. 2000;6(6):365–372. doi: 10.1177/135245850000600601. [DOI] [PubMed] [Google Scholar]
- 105.Altmann DR, Jasperse B, Barkhof F, et al. Sample sizes for brain atrophy outcomes in trials for secondary progressive multiple sclerosis. Neurology. 2009;72(7):595–601. doi: 10.1212/01.wnl.0000335765.55346.fc. [DOI] [PMC free article] [PubMed] [Google Scholar]
- 106.Bermel RA, Bakshi R. The measurement and clinical relevance of brain atrophy in multiple sclerosis. Lancet Neurol. 2006;5(2):158–170. doi: 10.1016/S1474-4422(06)70349-0. [DOI] [PubMed] [Google Scholar]
- 107.Tedeschi G, Lavorgna L, Russo P, et al. Brain atrophy and lesion load in a large population of patients with multiple sclerosis. Neurology. 2005;65(2):280–285. doi: 10.1212/01.wnl.0000168837.87351.1f. [DOI] [PubMed] [Google Scholar]
- 108.Bo L, Vedeler CA, Nyland HI, Trapp BD, Mork SJ. Subpial demyelination in the cerebral cortex of multiple sclerosis patients. J Neuropathol Exp Neurol. 2003;62(7):723–732. doi: 10.1093/jnen/62.7.723. [DOI] [PubMed] [Google Scholar]
- 109.Peterson JW, Bo L, Mork S, Chang A, Trapp BD. Transected neurites, apoptotic neurons, and reduced inflammation in cortical multiple sclerosis lesions. Ann Neurol. 2001;50(3):389–400. doi: 10.1002/ana.1123. [DOI] [PubMed] [Google Scholar]
- 110.Fisher E, Lee JC, Nakamura K, Rudick RA. Gray matter atrophy in multiple sclerosis: A longitudinal study. Ann Neurol. 2008;64(3):255–265. doi: 10.1002/ana.21436. [DOI] [PubMed] [Google Scholar]
- 111.Fisniku LK, Chard DT, Jackson JS, et al. Gray matter atrophy is related to long-term disability in multiple sclerosis. Ann Neurol. 2008;64(3):247–254. doi: 10.1002/ana.21423. [DOI] [PubMed] [Google Scholar]
- 112.Amato MP, Portaccio E, Goretti B, et al. Association of neocortical volume changes with cognitive deterioration in relapsing-remitting multiple sclerosis. Arch Neurol. 2007;64(8):1157–1161. doi: 10.1001/archneur.64.8.1157. [DOI] [PubMed] [Google Scholar]
- 113.Shiee N, Bazin PL, Zackowski KM, et al. Revisiting brain atrophy and its relationship to disability in multiple sclerosis. PLoS One. 2012;7(5):e37049. doi: 10.1371/journal.pone.0037049. [DOI] [PMC free article] [PubMed] [Google Scholar]
- 114.Calabrese M, Atzori M, Bernardi V, et al. Cortical atrophy is relevant in multiple sclerosis at clinical onset. J Neurol. 2007;254(9):1212–1220. doi: 10.1007/s00415-006-0503-6. [DOI] [PubMed] [Google Scholar]
- 115.Dale AM, Fischl B, Sereno MI. Cortical surface-based analysis. I. segmentation and surface reconstruction. Neuroimage. 1999;9(2):179–194. doi: 10.1006/nimg.1998.0395. [DOI] [PubMed] [Google Scholar]
- 116.Fischl B. FreeSurfer. Neuroimage. 2012;62(2):774–781. doi: 10.1016/j.neuroimage.2012.01.021. [DOI] [PMC free article] [PubMed] [Google Scholar]
- 117.Nakamura K, Fox R, Fisher E. CLADA: Cortical longitudinal atrophy detection algorithm. Neuroimage. 2011;54(1):278–289. doi: 10.1016/j.neuroimage.2010.07.052. [DOI] [PMC free article] [PubMed] [Google Scholar]
- 118.Nakamura K, Guizard N, Fonov VS, Narayanan S, Collins DL, Arnold DL. Jacobian integration method increases the statistical power to measure gray matter atrophy in multiple sclerosis. Neuroimage Clin. 2013;4:10–17. doi: 10.1016/j.nicl.2013.10.015. [DOI] [PMC free article] [PubMed] [Google Scholar]
- 119.Harrison DM, Caffo BS, Shiee N, et al. Longitudinal changes in diffusion tensor-based quantitative MRI in multiple sclerosis. Neurology. 2011;76(2):179–186. doi: 10.1212/WNL.0b013e318206ca61. [DOI] [PMC free article] [PubMed] [Google Scholar]
- 120.Fox RJ, Cronin T, Lin J, et al. Measuring myelin repair and axonal loss with diffusion tensor imaging. AJNR Am J Neuroradiol. 2011;32(1):85–91. doi: 10.3174/ajnr.A2238. [DOI] [PMC free article] [PubMed] [Google Scholar]
- 121.Harrison DM, Shiee N, Bazin PL, et al. Tract-specific quantitative MRI better correlates with disability than conventional MRI in multiple sclerosis. J Neurol. 2013;260(2):397–406. doi: 10.1007/s00415-012-6638-8. [DOI] [PMC free article] [PubMed] [Google Scholar]
- 122.Schmierer K, Tozer DJ, Scaravilli F, et al. Quantitative magnetization transfer imaging in postmortem multiple sclerosis brain. J Magn Reson Imaging. 2007;26(1):41–51. doi: 10.1002/jmri.20984. [DOI] [PMC free article] [PubMed] [Google Scholar]
- 123.Tortorella C, Viti B, Bozzali M, et al. A magnetization transfer histogram study of normal-appearing brain tissue in MS. Neurology. 2000;54(1):186–193. doi: 10.1212/wnl.54.1.186. [DOI] [PubMed] [Google Scholar]
- 124.Hayton T, Furby J, Smith KJ, et al. Grey matter magnetization transfer ratio independently correlates with neurological deficit in secondary progressive multiple sclerosis. J Neurol. 2009;256(3):427–435. doi: 10.1007/s00415-009-0110-4. [DOI] [PubMed] [Google Scholar]
- 125.Hayton T, Furby J, Smith KJ, et al. Longitudinal changes in magnetisation transfer ratio in secondary progressive multiple sclerosis: Data from a randomised placebo controlled trial of lamotrigine. J Neurol. 2012;259(3):505–514. doi: 10.1007/s00415-011-6212-9. [DOI] [PubMed] [Google Scholar]
- 126.Calabrese M, Filippi M, Gallo P. Cortical lesions in multiple sclerosis. Nat Rev Neurol. 2010;6(8):438–444. doi: 10.1038/nrneurol.2010.93. [DOI] [PubMed] [Google Scholar]
- 127.Geurts JJ, Bo L, Pouwels PJ, Castelijns JA, Polman CH, Barkhof F. Cortical lesions in multiple sclerosis: Combined postmortem MR imaging and histopathology. AJNR Am J Neuroradiol. 2005;26(3):572–577. [PMC free article] [PubMed] [Google Scholar]
- 128.Fox RJ, Sakaie K, Lee JC, et al. A validation study of multicenter diffusion tensor imaging: Reliability of fractional anisotropy and diffusivity values. AJNR Am J Neuroradiol. 2012;33(4):695–700. doi: 10.3174/ajnr.A2844. [DOI] [PMC free article] [PubMed] [Google Scholar]
- 129.Evangelou N, DeLuca GC, Owens T, Esiri MM. Pathological study of spinal cord atrophy in multiple sclerosis suggests limited role of local lesions. Brain. 2005;128(Pt 1):29–34. doi: 10.1093/brain/awh323. [DOI] [PubMed] [Google Scholar]
- 130.Oh J, Zackowski K, Chen M, et al. Multiparametric MRI correlates of sensorimotor function in the spinal cord in multiple sclerosis. Mult Scler. 2013;19(4):427–435. doi: 10.1177/1352458512456614. [DOI] [PMC free article] [PubMed] [Google Scholar]
- 131.Theaudin M, Saliou G, Ducot B, et al. Short-term evolution of spinal cord damage in multiple sclerosis: A diffusion tensor MRI study. Neuroradiology. 2012;54(10):1171–1178. doi: 10.1007/s00234-012-1057-1. [DOI] [PubMed] [Google Scholar]
- 132.Frohman EM, Fujimoto JG, Frohman TC, Calabresi PA, Cutter G, Balcer LJ. Optical coherence tomography: A window into the mechanisms of multiple sclerosis. Nat Clin Pract Neurol. 2008;4(12):664–675. doi: 10.1038/ncpneuro0950. [DOI] [PMC free article] [PubMed] [Google Scholar]
- 133.Petzold A, de Boer JF, Schippling S, et al. Optical coherence tomography in multiple sclerosis: A systematic review and meta-analysis. Lancet Neurol. 2010;9(9):921–932. doi: 10.1016/S1474-4422(10)70168-X. [DOI] [PubMed] [Google Scholar]
- 134.Abalo-Lojo JM, Limeres CC, Gomez MA, et al. Retinal nerve fiber layer thickness, brain atrophy, and disability in multiple sclerosis patients. J Neuroophthalmol. 2014;34(1):23–28. doi: 10.1097/WNO.0000000000000057. [DOI] [PubMed] [Google Scholar]
- 135.Saidha S, Syc SB, Durbin MK, et al. Visual dysfunction in multiple sclerosis correlates better with optical coherence tomography derived estimates of macular ganglion cell layer thickness than peripapillary retinal nerve fiber layer thickness. Mult Scler. 2011;17(12):1449–1463. doi: 10.1177/1352458511418630. [DOI] [PubMed] [Google Scholar]
- 136.Burkholder BM, Osborne B, Loguidice MJ, et al. Macular volume determined by optical coherence tomography as a measure of neuronal loss in multiple sclerosis. Arch Neurol. 2009;66(11):1366–1372. doi: 10.1001/archneurol.2009.230. [DOI] [PubMed] [Google Scholar]
- 137.Narayanan D, Cheng H, Bonem KN, Saenz R, Tang RA, Frishman LJ. Tracking changes over time in retinal nerve fiber layer and ganglion cell-inner plexiform layer thickness in multiple sclerosis. Mult Scler. 2014 doi: 10.1177/1352458514523498. [DOI] [PMC free article] [PubMed] [Google Scholar]
- 138.Ziemann U, Wahl M, Hattingen E, Tumani H. Development of biomarkers for multiple sclerosis as a neurodegenerative disorder. Prog Neurobiol. 2011;95(4):670–685. doi: 10.1016/j.pneurobio.2011.04.007. [DOI] [PubMed] [Google Scholar]
- 139.Burman J, Zetterberg H, Fransson M, Loskog AS, Raininko R, Fagius J. Assessing tissue damage in multiple sclerosis: A biomarker approach. Acta Neurol Scand. 2014 doi: 10.1111/ane.12239. [DOI] [PubMed] [Google Scholar]
- 140.Malmestrom C, Haghighi S, Rosengren L, Andersen O, Lycke J. Neurofilament light protein and glial fibrillary acidic protein as biological markers in MS. Neurology. 2003;61(12):1720–1725. doi: 10.1212/01.wnl.0000098880.19793.b6. [DOI] [PubMed] [Google Scholar]
- 141.Kuhle J, Plattner K, Bestwick JP, et al. A comparative study of CSF neurofilament light and heavy chain protein in MS. Mult Scler. 2013;19(12):1597–1603. doi: 10.1177/1352458513482374. [DOI] [PubMed] [Google Scholar]
- 142.Gunnarsson M, Malmestrom C, Axelsson M, et al. Axonal damage in relapsing multiple sclerosis is markedly reduced by natalizumab. Ann Neurol. 2011;69(1):83–89. doi: 10.1002/ana.22247. [DOI] [PubMed] [Google Scholar]
- 143.Kuhle J, Malmestrom C, Axelsson M, et al. Neurofilament light and heavy subunits compared as therapeutic biomarkers in multiple sclerosis. Acta Neurol Scand. 2013 doi: 10.1111/ane.12151. [DOI] [PubMed] [Google Scholar]
- 144.MS-SMART: Multiple sclerosis-secondary progressive multi-arm randomisation trial - full text view. [Accessed 5/6/2014, 2014];ClinicalTrials.gov. http://clinicaltrials.gov/show/NCT01910259.
- 145.Safety, tolerability and activity study of ibudilast in subjects with progressive multiple sclerosis - full text view. [Accessed 5/6/2014, 2014];ClinicalTrials.gov. http://clinicaltrials.gov/ct2/show/NCT01982942.
- 146.Semra YK, Seidi OA, Sharief MK. Heightened intrathecal release of axonal cytoskeletal proteins in multiple sclerosis is associated with progressive disease and clinical disability. J Neuroimmunol. 2002;122(1–2):132–139. doi: 10.1016/s0165-5728(01)00455-6. [DOI] [PubMed] [Google Scholar]
- 147.Petzold A, Eikelenboom MJ, Gveric D, et al. Markers for different glial cell responses in multiple sclerosis: Clinical and pathological correlations. Brain. 2002;125(Pt 7):1462–1473. doi: 10.1093/brain/awf165. [DOI] [PubMed] [Google Scholar]
- 148.Axelsson M, Malmestrom C, Nilsson S, Haghighi S, Rosengren L, Lycke J. Glial fibrillary acidic protein: A potential biomarker for progression in multiple sclerosis. J Neurol. 2011;258(5):882–888. doi: 10.1007/s00415-010-5863-2. [DOI] [PubMed] [Google Scholar]
- 149.Denic A, Johnson AJ, Bieber AJ, Warrington AE, Rodriguez M, Pirko I. The relevance of animal models in multiple sclerosis research. Pathophysiology. 2011;18(1):21–29. doi: 10.1016/j.pathophys.2010.04.004. [DOI] [PMC free article] [PubMed] [Google Scholar]
- 150.Parmar MK, Carpenter J, Sydes MR. More multiarm randomised trials of superiority are needed. Lancet. 2014;384(9940):283–284. doi: 10.1016/S0140-6736(14)61122-3. [DOI] [PubMed] [Google Scholar]