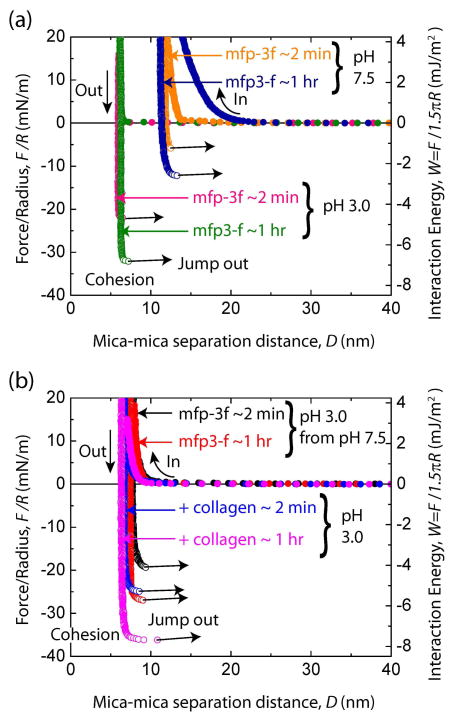
Figure 6.
Bridging cohesion in mfp-3 and the effect of pH and addition of COL1A1. (a) Representative force vs. distance plots for mfp-3f alone deposited at Cmfp-3f = 20 μg/mL in 0.1 M sodium acetate buffer, pH 3.0 and 0.25 M KNO3. (b) Representative force vs. distance plots for mcfp-3f in 0.1 M phosphate buffer, pH 7.5 and 0.25 M KNO3 from pH 3.0 and with collagen (CCOL1A1 = 25 μg/mL) injected between the two films in 0.1 M sodium acetate buffer, pH 3.0 and 0.25 M KNO3.

