

Abstract
O-linked N-Acetylglucosamine (O-GlcNAc) post-translational modifications originate from the activity of the hexosamine pathway, and are known to affect intracellular signaling processes. As aberrant responses to microenvironmental signals are a feature of chronic lymphocytic leukemia (CLL), O-GlcNAcylated protein levels were measured in primary CLL cells. In contrast to normal circulating and tonsillar B cells, CLL cells expressed high levels of O-GlcNAcylated proteins, including p53, c-myc and Akt. O-GlcNAcylation in CLL cells increased following activation with cytokines and through toll-like receptors (TLRs), or after loading with hexosamine pathway substrates. However, high baseline O-GlcNAc levels were associated with impaired signaling responses to TLR agonists, chemotherapeutic agents, B cell receptor crosslinking and mitogens. Indolent and aggressive clinical behavior of CLL cells were found to correlate with higher and lower O-GlcNAc levels, respectively. These findings suggest that intracellular O-GlcNAcylation is associated with the pathogenesis of CLL, which could potentially have therapeutic implications.
Keywords: chronic lymphocytic leukemia, glycolysis, hexosamine pathway, signal transduction, glucosamine
Introduction
Variations in the clinical course of chronic lymphocytic leukemia (CLL) are related in part to the ability of the tumor cells to respond to microenvironmental signals.1 Aggressive CLL cells, marked by unmutated, rearranged heavy-chain variable genes, high CD38, ZAP-70 or CD49d expression and deletions in chromosomes 11 or 17,2 respond more strongly to such signals than cells which show indolent clinical behavior.1 While this observation has primarily been made in studies of B-cell receptor-signaling,3 it is also true for other signals encountered by the CLL cells in the proliferation centers, where circulating cells originate, including chemokines, cytokines, toll-like receptor (TLR) agonists and extracellular calcium fluctuations.1 Understanding how such responses are regulated is important, as it could provide insights into clinical behavior and lead to better treatment strategies for CLL.
Aberrant metabolism is a hallmark of cancer4 and it can also affect signaling processes. For example, overactivity of a minor metabolic pathway, the hexosamine pathway, leads to impaired insulin signaling and type 2 diabetes.5 The rate-limiting enzyme of this pathway is glutamine fructose-6-phosphate amidotransferase (GFAT)6 which ultimately makes uridine diphosphate N-acetylglucosamine (UDP-GlcNAc) (Figure 1a), a nucleotide-sugar, used to glycosylate cell-surface lipids and proteins.7 UDP-GlcNAc is also employed by O-linked N-acetylglucosamine (GlcNAc) transferase (OGT) to O-GlcNAcylate the serine and threonine residues on intracellular proteins, including components of kinase cascades. These modifications can be removed by the deglycosylating enzyme, O-GlcNAcase (OGase).6 The experiments in this study were designed to explore the possibility that the hexosamine pathway might modulate intracellular signaling in CLL cells and affect disease pathobiology.
Figure 1.
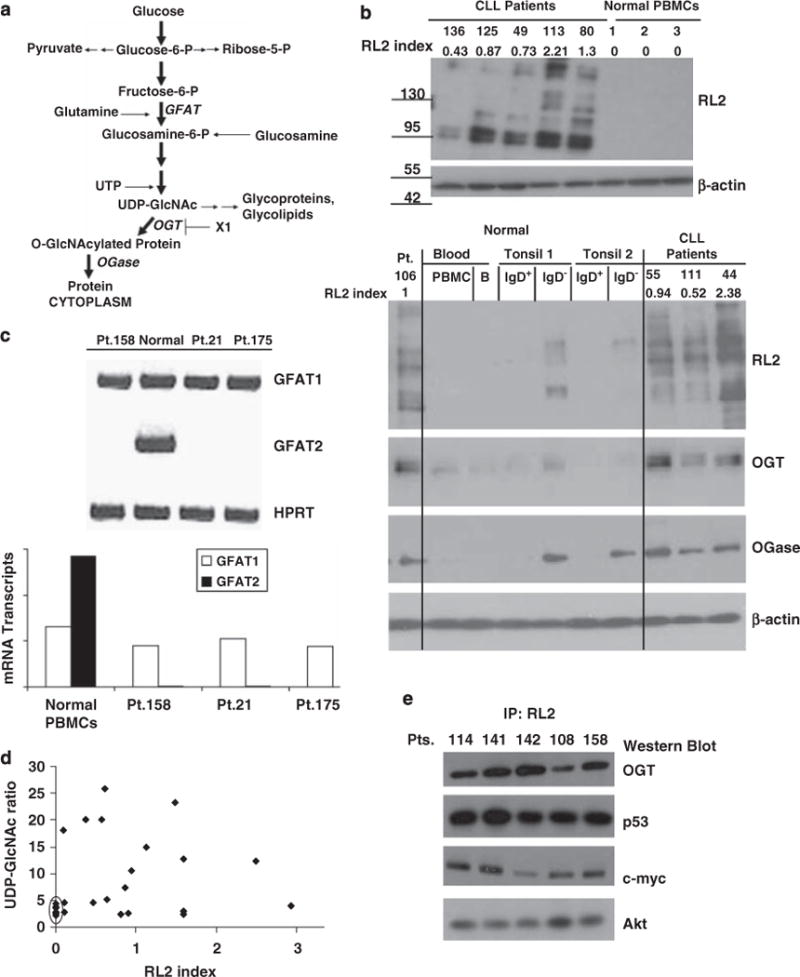
Hexosamine pathway activity in chronic lymphocytic leukemia (CLL) cells. (a) Schema of the hexosamine pathway indicating relevant enzymes (for example, O-linked N-acetylglucosamine (GlcNAc) transferase (OGT), glutamine fructose-6-phosphate amidotransferase (GFAT)) and molecules (for example, OGT inhibitors). (b) Top: Lysates from three freshly isolated normal peripheral blood mononuclear cells (PBMCs) and five CLL samples were immunoblotted with RL2 antibodies and quantified by densitometry (RL2 index), as described in the materials and methods and shown above the blots. Bottom: Results with four additional CLL samples, another PBMC sample, purified circulating adult B cells and IgD+ and IgD− B cells from two normal tonsils are shown. Extracts were probed with RL2 and polyclonal antibodies against OGT and O-GlcNAcase (Ogase). Similar results were seen with three other tonsillar samples. (c) GFAT1 and GFAT2 isozyme expression were assessed by RT–PCR. An example of a gel is shown along with the transcript level relative to hypoxanthine-guanine phosphoribosyl transferase (HPRT). (d) Uridine diphosphate N-acetylglucosamine (UDP-GlcNAc) levels in PBMCs (n = 6) and CLL cells (n = 19), were measured by HPLC and were generally higher in CLL cells than in normal cells (circled). (e) Protein extracts from freshly isolated CLL cells were passed through a Protein A column containing RL2 antibodies and immunoprecipitated proteins were identified with antibodies to the indicated proteins.
Materials and methods
Cells
Blood was obtained from consenting CLL patients (Table 1) with persistently increased clonal CD19+ CD5+ IgM10 cells2 who were untreated for at least 3 months, and from normal donors, with approval from the Sunnybrook Review Board. Tonsils were obtained from the Alberta Children’s Hospital with ethics approval.
Table 1.
Patient characteristics
| Patient no.a | Sex | Age | Time (yrs)b | Rai Stage | WBC | CD38 | Cytogenetics | β2Mc | LDTd | Treatmentse | RL2 indexf |
|---|---|---|---|---|---|---|---|---|---|---|---|
| 5 | M | 63 | 6 | 0 | 33 | 3 | NA | NA | 41 | 0 | 1.3 ± 0.11 |
| 152 | M | 77 | 4 | 0 | 20 | 1 | NA | 1.9 | 60 | 0 | 1.32±0.23 |
| 99 | M | 61 | 4 | II | 30 | 1 | 13q | NA | 61 | 0 | 1.5±0.16 |
| 27 | F | 80 | 11 | III | 92 | 10 | t12 | NA | 15 | 0 | 0.46±0.02 |
| 114 | M | 50 | 5 | IV | 67 | 38 | normal | 4.4 | 6 | 5 | 0.61 ±0.19 |
| 158 | M | 54 | 3 | III | 126 | 14 | t12 | 2.9 | 6 | 1 | 0.62±0.31 |
| 49 | F | 76 | 6 | III | 51 | 13 | NA | NA | 16 | 0 | 0.73±0.24 |
| 116 | M | 52 | 12 | IV | 90 | 1 | normal | 2.9 | 2 | 3 | 0.87±0.08 |
| 54 | M | 80 | 6 | III | 89 | 1 | normal | 11.3 | 10 | 0 | 0.86±0.27 |
| 12 | M | 50 | 7 | 0 | 20 | 6 | normal | NA | 84 | 0 | 1.2±0.10 |
| 14 | M | 54 | 5 | I | 33 | NA | NA | NA | 14 | 0 | 1.04±0.30 |
| 142 | M | 73 | 121 | IV | 35 | 88 | 13q | 5.8 | 5 | 6 | 0.65±0.25 |
| 144 | M | 58 | 1 | IV | 33 | 1 | 13q | 1.6 | 24 | 0 | 1.45±0.15 |
| 110 | F | 59 | 5 | II | 36 | 20 | NA | NA | 14 | 0 | 1.6±0.42 |
| 119 | M | 73 | 5 | III | 54 | 2 | 11q | 3.5 | 14 | 0 | 1.09±0.05 |
| 73 | M | 87 | 5 | IV | 56 | 1 | 13q17p | 1.7 | 36 | 0 | 2.62±0.63 |
| 74 | M | 67 | 6 | II | 142 | 4 | normal | NA | 13 | 0 | 1.6±0.90 |
| 38 | M | 55 | 7 | IV | 14 | 7 | 13q17p | 1.4 | 2 | 7 | 0.09±0.06 |
| 80 | F | 86 | 11 | I | 27 | NA | NA | NA | 22 | 1 | 1.3±0.12 |
| 136 | F | 90 | 2 | 0 | 20 | 28 | t12 | 2.8 | 4 | 1 | 0.43±0.10 |
| 111 | F | 70 | 3 | 0 | 33 | 4 | 13q17p | NA | 15 | 0 | 0.52±0.53 |
| 163 | F | 56 | 2 | I | 12 | 2 | NA | 1.1 | 6 | 0 | 0±0 |
| 133 | F | 57 | 3 | III | 35 | NA | normal | 1.7 | 3 | 3 | 0.57±0.04 |
| 125 | F | 62 | 2 | II | 34 | 1 | t1213q | NA | 6 | 0 | 0.87±0.20 |
| 44 | F | 52 | 12 | IV | 65 | 2 | 13q | NA | 84 | 0 | 2.38±0.76 |
| 164 | M | 75 | 9 | III | 231 | 1 | 13q | 2 | 36 | 0 | 1.59±0.52 |
| 3 | F | 44 | 6 | I | 31 | 2 | NA | NA | 10 | 0 | 0.51 ±0.32 |
| 23 | M | 70 | 11 | IV | 17 | 2 | t1211q | NA | 4 | 4 | 0.37±0.05 |
| 137 | F | 55 | 2 | IV | 13 | 21 | 17p | 4.3 | 2 | 4 | 0.15±0.10 |
| 141 | F | 59 | 25 | IV | 94 | 18 | 11q13q | NA | 11 | 1 | 0.9±0.12 |
| 1 | F | 54 | 7 | IV | 103 | 10 | 13q | NA | 8 | 1 | 1 ±0.17 |
| 75 | M | 67 | 8 | I | 142 | 8 | normal | 2 | 24 | 0 | 2.5±0.14 |
| 154 | M | 76 | 1 | 0 | 15 | 1 | NA | 1.9 | NA | 0 | 1.42±0.24 |
| 130 | M | 61 | 2 | I | 28 | 11 | 13q | 1.1 | 10 | 0 | 0.77±0.13 |
| 55 | M | 75 | 5 | IV | 115 | 12 | t12 | NA | 6 | 3 | 0.94±0.34 |
| 113 | M | 79 | 4 | I | 23 | 1 | NA | NA | 50 | 0 | 2.21 ±0.42 |
| 155 | M | 60 | 2 | 0 | 33 | 5 | 13q | 1.4 | 17 | 0 | 1.8±0.20 |
| 149 | M | 66 | 3 | I | 13 | 21 | NA | 1.5 | 17 | 0 | 0.68±0.23 |
| 26 | F | 56 | 6 | II | 22 | 9 | NA | NA | 17 | 1 | 0.64±0.14 |
| 160 | M | 44 | 1 | 0 | 10 | 1 | NA | 1.2 | NA | 0 | 2.46±0.51 |
| 108 | M | 65 | 4 | II | 39 | 1 | 13q | 2.6 | 19 | 0 | 1.23±0.16 |
| 128 | F | 76 | 10 | IV | 49 | NA | 13q | 4.8 | 4 | 1 | NA |
| 46 | M | 60 | 11 | III | 140 | 2 | 13q | NA | 4 | 5 | NA |
| 171 | F | 35 | 5 | IV | 140 | 8 | 13q | 2.4 | 36 | 0 | NA |
| 172 | M | 42 | 1 | IV | 38 | 1 | NA | 4.2 | 5 | 1 | NA |
| 173 | M | 59 | 5 | IV | 64 | 1 | 13q | NA | 14 | 1 | NA |
| 174 | F | 60 | 5 | II | 48 | 35 | 11q | 3.1 | 14 | 0 | NA |
| 175 | M | 60 | 9 | IV | 19 | NA | 13q17p | 1.5 | 9 | 3 | NA |
| 21 | M | 70 | 11 | IV | 121 | NA | 13q | NA | 10 | 2 | NA |
| 106 | F | 67 | 8 | IV | 156 | 1% | 13q | 2.7 | 5 | 2 | 1.00 |
Abbreviations: β2M, beta 2-microglobulin; LDT, lymphocyte doubling times; WBC, White Blood Cells.
Corresponding patient numbers are maintained throughout the article.
Time since diagnosis.
Normal serum b2M levels are less than 2.3 mg/l.
Lymphocyte doubling times in months were calculated from routine blood lymphocyte counts performed at each clinic visit and are not reported if the time of followup was insufficient.
A course of treatment included any of splenectomy, radiation, or a standard steroid-, alkylator- or fludarabine-based chemotherapy regimen, with or without rituxan. NA = not available.
Reported as the average and s.d. of the three separate measurements.
Patients listed in the lower portion of the table were not used in the analysis of Figure 5.
Normal B and CLL cells were isolated as before8 by negative selection with the Rosette Sep Human B cell enrichment cocktail (StemCell Technologies, Vancouver BC, Canada) and density centrifugation over Ficoll-Paque (Amersham Pharmacia Biotech AB, Uppsala, Sweden). This method yields percentages of CD19+ and CD19+/CD5+ cells of >98 and >96%, respectively.8 Tonsillar B cells were obtained by using RosetteSep spiked with human red blood cells.9 IgD+ (naive) and IgD− (germinal center and memory) cells were then isolated by incubating with biotinylated anti-IgD antibodies (Miltenyi Biotec Inc., Aubarn, CA, USA, cat. no. 120-094-554 for 30 min, followed by washing and incubation with streptavidin-coated microbeads (New England Biolabs, Ipswich, MA, USA, cat. no. S1420S). Cells were then washed twice and were selected three times with an EasySep magnet (Stemcell technologies). IgD+ and IgD− B cells were lysed for subsequent immunoblotting. Peripheral blood mononuclear cells (PBMCs) were obtained by density centrifugation without RosetteSep.
Antibodies and reagents
Phycoerythrin- and FITC-labeled CD19, CD83 and tumor necrosis factor (TNF)α antibodies were purchased from Pharmingen (San Francisco, CA, USA). N-acetylglucosamine, uridine and phorbol dibutyrate were from Sigma (St Louis, MO, USA). The TACE inhibitor, TAPI,10 was from Peptides International (Louisville, KY, USA). The TLR-7 agonist, 852A,11 was from 3M Pharmaceuticals (St Paul, MN, USA). The OGT inhibitor, X1, has been described previously.12 Interleukin-2 (Novartis Pharmaceuticals Canada, Dorval, Quebec, Canada), interferona2b (Schering Canada, Pointe-Claire, Quebec, USA), and vincristine sulfate (Faulding Canada, Kirkland, Quebec, Canada) were purchased from the hospital pharmacy.
RL2 antibodies13 were from AbCam (Cambridge, MA, USA). Antibodies against native and phosphorylated forms of Syk, Akt, c-Jun N-terminal kinases (JNK), extracellular signal-regulated kinases, IκB and secondary horseradish peroxidase-conjugated anti-rabbit and anti-mouse antibodies were from Cell Signaling Technology (Beverly, MA, USA). Antibodies to p53 were from Santa Cruz Biotechnology (Santa Cruz, CA, USA). Anti-c-myc and β-actin were purchased from Sigma. OGase and AL-28 antibodies that recognize OGT were raised as described previously.14,15 Goat anti-human IgM Fc-specific antibodies were from Jackson ImmunoResearch Labs (West Grove, PA, USA).
Cell culture and activation
Purified CLL cells (1.5×10⁶/ml) were cultured in AIM-V (GibcoBRL, Grand Island, NY, USA) plus 2-mercaptoethanol ((Sigma) (5 × 10⁻⁵ M) in 6- or 24-well plates (Becton-Dickinson Labware, Franklin Lake, NJ, USA) at 37°C in 5% CO2. To increase O-GlcNAcylation, cells were cultured overnight with N-acetylglucosamine (20 mM) and uridine (5 mM).16 Short-term activated B cell lines were prepared by activating normal B cells with interleukin-2 (100U/ml) and Resiquimod (Cedarlane Laboratories, Burlington, ON, Canada) (0.5μg/ml) in embryonic stem cell media17 (D-MEM-F12, 15% Knockout Serum Replacement, 1% 100 × Glutamax-I (all from Invitrogen, Carlsbad, CA, USA), 1% 100×MEM nonessential amino acids (Wisent, St Bruno, QUE, Canada), and 2-mercaptoethanol). Every 5 days, the cell density was reset to 5 × 10⁵ cells/ml, and the cells were reactivated. For the experiments in Supplementary Figure 1, cells were rested for 2 days before activation with 852A, with or without overnight culture in glucosamine and uridine.
Immunophenotyping and detection of membrane TNFα (mTNFα) detection
These flow cytometric analyses were carried out as described previously.8,10
Real-time-PCR
RNA was prepared using the RNeasy mini kit (Qiagen, Valencia, CA, USA), and cDNA was synthesized from 2 μg of RNA using Superscript II reverse transcriptase (Invitrogen), according to the instructions of the manufacturer. GFAT1, GFAT2 and hypoxanthine-guanine phosphoribosyl transferase transcripts were amplified with the following primers: GFAT1 forward, 5′-GCAA GCAGTTGG CACAAGG-3′; reverse, 5′-CTCCACTGCTTTTTC TTCCAC-3′; GFAT2 forward, GGA 5′-GTC CGG AGC AAA TAC AAT-3′; reverse, 5′-GACCCG GTG AAT GGA GAG T-3′; HPRT forward, 5′-GAGGATTTGGAAAGGGTGTT-3′; reverse, 5′-ACA ATAGCTCTTCAGTCTGA -3′. Polymerase chain reactions were carried out in a DNA engine Opticon System (MJ Research, Waltham, MA, USA) and cycled 34 times after initial denaturation (95 °C, 15 min) with the following parameters: denaturation at 94 °C for 20s, annealing of primers at 58 °C (GFAT1,2) or at 52 °C hypoxanthine-guanine phosphoribosyl transferase for 20 s, and extension at 72 °C for 20s. The abundance of GFAT 1 and GFAT 2 mRNA were evaluated by a standard amplification curve, which was set on the basis of analyzing the relationship between the starting copy number and the number of cycles. Copy numbers were determined from two independent cDNA preparations for each sample. One cDNA was the target gene while hypoxanthine-guanine phosphoribosyl transferase was used as the internal standard. The final result was expressed as the relative fold change of the target gene to hypoxanthine-guanine phosphoribosyl transferase.
UDP-GlcNAc measurements
Nucleotide sugars were extracted from CLL cells or normal PBMCs (with 0.3 M perchloric acid, followed by 1:4 v/v of trioctylamine and 1,1,2-trichlorotrifluoroethane, on ice), separated on a Partisil SAX anion exchange HPLC column (4.6 × 250 mm; Whatman Inc., Piscataway, NJ, USA), and developed in 80mM potassium phosphate, pH 2.8, 35% acetonitrile. UDP-N-acetylhexosamines were quantified by UV adsorption at 254 nm, and reported relative to the absorbance of UDP-hexoses.16 Reference standards for elution times of UDP-GlcNAc were from Sigma.
Immunoblotting and immunoprecipitation
Protein extracts from freshly isolated CLL-B cells, or following different in vitro treatments, were prepared in radioimmuno-precipitation assay buffer. For immunoprecipitation, 100μg of total protein was incubated with RL2 antibody at 4 °C overnight, and then with UltraLink immobilized protein G (Pierce Chemical, Rockford, IL, USA) for 1 h. Lysate-antibody-agarose bead mixtures were washed four times with phosphate-buffered saline. Total protein extracts (50μg) or immunoprecipitates (200 μg) were mixed with SDS–PAGE sample buffer (50 mM Tris-HCl, pH 6.8, 2 mM EDTA, 10% glycerol, 2% sodium dodecyl sulfate, 2% 2-mercaptoethanol and 0.025% bromphenol blue), heated at 1001C for 5 min and then run in an 8% SDS polyacrylamide mini gel. Proteins were then transferred to polyvinylidene fluoride membranes (Immobilion, Millipore, Bedford, MA, USA). After incubation with primary antibodies overnight, blots were incubated with anti-rabbit or -mouse horseradish peroxidase-conjugated secondary antibodies for 1 h. To confirm that binding was specific for O-GlcNAc moieties, RL2 antibodies were pre-incubated with 500 mM N-acetylglucosamine (GlcNAc), dissolved in tween–phosphate-buffered saline buffer, for 30min at room temperature before immunoblotting. Signals were detected with Supersignal horseradish peroxidase-enhanced chemiluminescence reagent (Pierce), and the blots were exposed to Kodak Biomax MR film (Sigma). Western blot analyses for other antibodies were performed according to the manufacturer’s protocols.
Determination of RL2 index
The total intensity of all RL2-staining bands on a gel was quantified using the GeneTools Analysis Software version 4.00 from Syngene Genius 2 Bioimager (Syngene Frederick, MD, USA) and normalized to the intensity of β-actin staining. To control for the experimental variations involved when comparing large numbers of samples on different blots, this number was normalized again to the results obtained with 50μg of a reference standard from a single CLL patient (Patient 106), which was always run with each gel. To further control for experimental variation, three separate gels were run. The normalized RL2 densities for the reference standard of the second and third blots was divided by the normalized RL2 densities for the reference standard of the first blot, and used to multiply the normalized RL2 densities of the patient samples obtained on the respective gels. The average of the results from gel one and the weighted results of gels two and three was called the ‘RL2 index’. In other words,
where n is the gel number, Xn is the densitometry value of total RL2 staining relative to β-actin staining for an individual patient sample and P106n is the densitometry value of total RL2 staining relative to β-actin staining for patient 106.
Statistical analysis
The Student’s t-test was used to determine P-values for differences between sample means. Best-fit lines were determined by least-square regressions.
Results
Increased levels of O-GlcNAcylated proteins in CLL cells
As a measure of hexosamine pathway activity in CLL cells, protein extracts were immunoblotted with RL2 antibodies, which recognize O-GlcNAc moieties on proteins, such as nuclear porins and transcription factors.13 Examples of five patient samples described in Table 1 are shown (Figure 1b, top panel). The ‘RL2 index’ was obtained by densitometry, as described in the materials and methods section, and used to convey the differences in O-GlcNAcylation between patient samples. Variations in band intensities were noted, but all CLL samples (more than 80 different patients), exhibited evidence of increased O-GlcNAcylation. In marked contrast to CLL cells, normal PBMCs (of which ~20% are B cells) expressed low levels of O-GlcNAcylated proteins, as did purified circulating normal B cells and IgD+ naïve tonsillar B cells. Higher amounts of O-GlcNAcylated proteins were found in IgD− tonsillar B cells, including both memory and germinal center cells, but not to the levels observed in CLL cells (Figure 1b).
Expression of a number of hexosamine pathway enzymes (Figure 1a) by CLL cells was determined, since O-GlcNAcylation reflects activity of this pathway. Consistent with the results obtained with RL2, OGT was expressed at higher levels in CLL cells than in normal circulating or tonsillar B cells (Figure 1b). OGase was expressed by CLL cells and by IgD− tonsillar B cells, but was not present at very high levels in PBMCs, circulating B cells or naïve tonsillar B cells (Figure 1b). Two GFAT isozymes have been described.18 Antibodies to these proteins are not readily available, but GFAT1 mRNA was expressed by CLL cells at similar levels as normal PBMCs (Figure 1c). GFAT2 was not expressed by CLL cells but was found in PBMCs, presumably from the monocyte component (Figure 1c).
UDP-GlcNAc levels in CLL cells were measured by high performance liquid chromatography as OGT activity is thought to depend on the concentration of its substrates (Figure 1a).19 CLL cells were generally found to have higher intracellular levels of UDP-GlcNAc than the normal PBMCs (Figure 1d). Taken together, increased UDP-GlcNAc, and OGT expression could help to account for higher O-GlcNAcylated protein levels in CLL cells.
OGT targets in CLL cells
More than 1000 proteins have been identified that are modified by O-GlcNAcylation, although consensus sequences are not yet available for in silico site mapping.20 Some of these proteins, which were identified in other systems but are relevant to CLL, include OGT itself,20 p53,21 c-myc,22 and Akt.5 By immunoprecipitating RL-2-binding proteins from five different patient samples, and then immunoblotting with the specific antibodies, these proteins were also found to be O-GlcNAcylated in primary CLL cells (Figure 1e). This finding was confirmed by first immunoprecipitating with the specific antibodies, and then immunoblotting with RL2 (not shown). To show that RL-2 antibodies bind O-GlcNAcylated residues, immunoblots were repeated in the presence of 0.5 M GlcNAc, as described in the materials and methods section, and reactive bands disappeared (not shown).
Immunoreceptor-mediated increases in O-GlcNAc levels in CLL cells
The results in Figure 1 suggested that the hexosamine pathway was activated in CLL cells. Activating signals that cause increased intracellular glucose levels classically lead to increased flux through the hexosamine pathway in non-hematopoietic cells.6 Immunoreceptor ligands, such as antigens, cytokines and TLR-agonists, are thought to activate CLL cells in proliferation centers.1 Accordingly, O-GlcNAcylated protein levels were measured after stimulating the CLL cells with IL-2 and a TLR-7/8 agonist23 (Figure 2a, left panel) or interferon-α2b (Figure 2a, right panel), and were found to increase within 1h. Such changes could potentially be caused by increased OGT activity or by decreased OGase activity (Figure 1). However, they were inhibited by X1 (Figure 2b), which was identified as an OGT inhibitor in a small molecule library screen12 and shown previously to prevent hypoxia-induced O-GlcNAcylation in cardiomyocytes,24 suggesting that the immunoreceptor-mediated increases in O-GlcNAcylation in CLL cells were through OGT.
Figure 2.
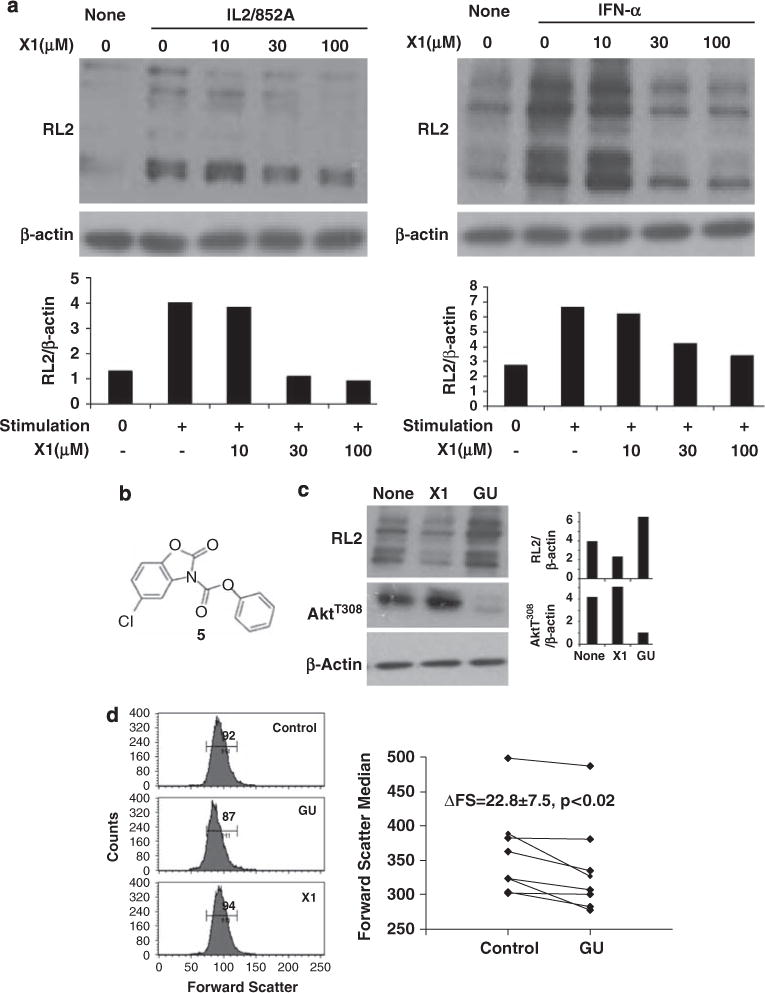
Effect of immunoreceptor agonists and hexosamine pathway substrates on O-GlcNAcylation in chronic lymphocytic leukemia (CLL) cells. (a) Samples from patients 26 and 111, with relatively low baseline O-GlcNAc levels, were incubated with the indicated concentrations of X1 for 30 min and then stimulated with IL2 (100 U/ml), and 852A (0.1 μg/ml) (left panel) or interferon-a2b (1000 U/ml) (right panel), respectively. Extracts were made after 1h and immunoblotted with RL2 antibodies. The intensity of RL2 staining relative to β-actin levels was determined by densitometry and shown below each lane. Similar results were obtained with two other samples. (b) Chemical structure of X1.12 (c) CLL cells from patient 46 were cultured for 2 days in AIM-V alone, with the O-linked N-acetylglucosamine (GlcNAc) transferase (OGT) inhibitor, X1 (50 μM) or with GlcNAc (20 mM) and Uridine (5 mM) (GU) to provide substrates to OGT. Protein extracts were then examined with RL2 and antibodies to activated AktT308. Staining intensities, relative to β-actin, were quantified by densitometry (right panels). GU increased O-GlcNAc levels and decreased the AktT308 levels, while X1 had the opposite effect. (d) Cell size was indicated by the forward scatter parameter of flow cytometry. Cells treated with GU were smaller while cells treated with X1 were slightly larger than cells cultured alone. Numbers in the histogram are the means of the M1 region. The graph summarizes results with eight other CLL samples (patients. 128, 133, 171, 172, 173, 125, 26 and 174), and shows the average and standard error of the differences in cell size due to substrate loading of the hexosamine pathway (P<0.02 for the eight samples).
Effect of increased O-GlcNAcylation on signaling responses in CLL cells
Although acute stimulation with cytokines and TLR-agonists increased O-GlcNAcylated protein levels in CLL cells with relatively low baseline levels (Figure 2a), we wanted to determine the effect of high baseline O-GlcNAc levels on subsequent signaling in CLL cells. To increase O-GlcNAcylated protein levels, cells were cultured in N-acetylglucosamine (GlcNAc) and uridine, which enters the hexosamine pathway downstream of GFAT (Figure 1a), and increases both UDP-GlcNAc and OGT activity.16 To decrease O-GlcNAc levels, cells were cultured in the presence of X1 to prevent new O-GlcNAc moieties from being formed, while allowing time for preexisting modifications to be removed by OGase.
In adipocytes, O-GlcNAcylation inhibits the activity of Akt by interfering with phosphorylation, particularly at threonine 308.5 To determine if Akt was regulated in a similar manner in CLL cells, fresh patient samples were cultured for 2 days in the presence of X1 (to decrease O-GlcNAc levels), or in GlcNAc and uridine. X1 decreased O-GlcNAc levels, as shown by RL2 staining, and resulted in higher expression of AktT308 (Figure 2c, middle lanes). Conversely, GlcNAc and uridine increased RL2 levels, and significantly decreased the expression of phosphorylated Akt (Figure 2c, right lanes). Consistent with decreased Akt activity, CLL cells cultured in GlcNAc and uridine were smaller than cells cultured alone, as indicated by the forward scatter parameter of flow cytometry (Figure 2d). X1-treated cells were also generally larger than untreated cells.
Signaling responses through TLR-7 were indicated by measuring cell surface expression of TNF-α by flow cytometry after 4h of stimulation.10,25 GlcNAc and uridine increased O-GlcNAcylated protein levels in CLL cells, as shown by immunoblotting with RL2 (Figure 3a, right panel), while TNF-α expression in response to 852A decreased (Figure 3a, compare the upper and lower dot-plots). When O-GlcNAc levels were decreased by X1 (Figure 3b, right panel), TNF-α expression increased following stimulation with 852A (Figure 3b, compare the upper and lower dot-plots). These findings suggested that TLR-7-signaling strength was inversely proportional to intracellular O-GlcNAc levels.
Figure 3.
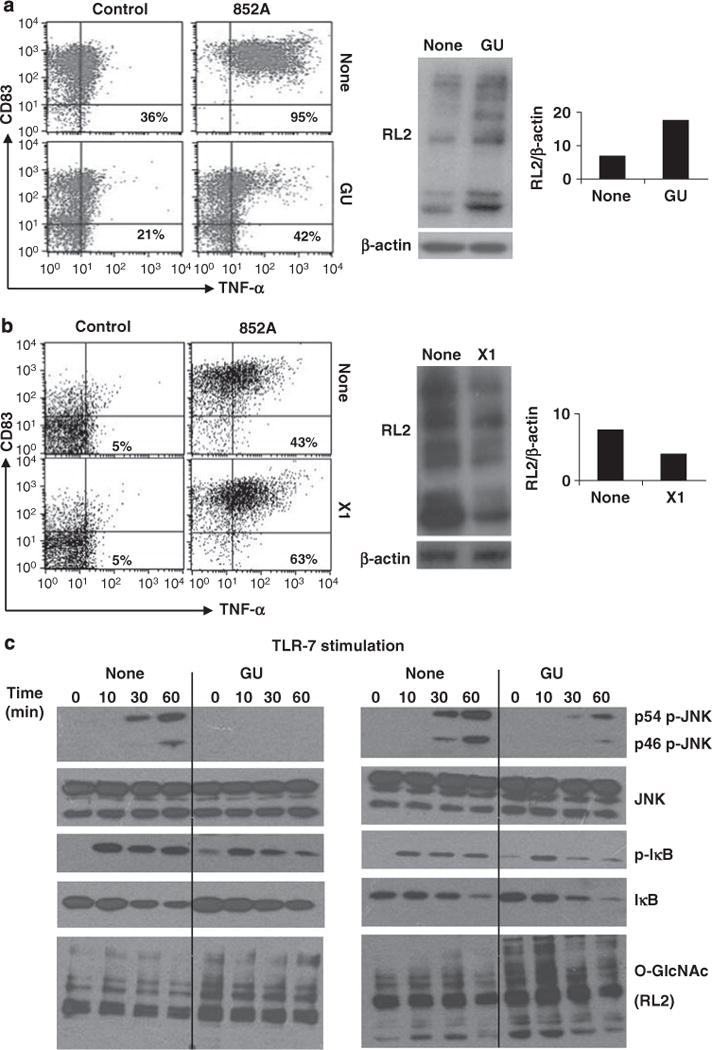
Effect of changing O-GlcNAc levels on toll-like receptor (TLR)-7-signaling in chronic lymphocytic leukemia (CLL) cells. (a) CLL cells from patient 116 were cultured overnight, alone or in GlcNAc and Uridine (GU), before stimulation with the TLR-7 agonist, 852A (0.1 μg/ml). Immunoblotting with RL2 antibodies confirmed the increase in O-GlcNAcylated protein levels (middle panels), which was quantified (relative to β-actin levels) by densitometry (right panel). Surface expression of CD83 and tumor necrosis factor (TNF)-α (to reflect TLR-7-signalling10) were then measured by flow cytometry after 4h. Numbers in the right upper quadrants are the percentages of CLL cells that express membrane TNF-α (mTNF-α). (b) CLL cells from patient 164 were cultured for 24h alone or with the OGT-inhibitor, X1 (50 μM), to decrease O-GlcNAcylation (confirmed by immunoblotting with RL2 antibodies and densitometry (middle and right panels) before stimulation with 852A. Similar increases in TNF-α production were seen with ten other samples. (c) CLL cells from patient 80 (left panel) and patient 125 (right panel) were cultured overnight in the presence or absence of GU and then stimulated with 852A. At the indicated times, protein extracts were collected and expression of phosphorylated and total c-Jun N-terminal kinases (JNK) and IκB, as well as RL2, to confirm the increased levels of O-GlcNAcylated proteins, were examined by immunoblotting. Similar results were seen with two other samples.
JNK and IκB are normally phosphorylated after TLR-7 activation in CLL cells (Figure 3c).10 However, treatment with GlcNAc and uridine markedly impaired JNK phosphorylation (Figure 3c, top two panels), and altered phosphorylation kinetics of IκB (Figure 3c, third and fourth panels). Previously, a similar aberrant signaling profile was found to accompany the inability of CLL cells to make TNF-α in response to TLR-7 agonists.10 To determine if the inhibitory effect of hexosamine pathway loading on TLR-7-mediated JNK phosphorylation was unique to CLL cells, similar studies were carried out with normal B cells isolated directly from the blood, and also with short-term B cell lines, as CLL cells are considered to be the transformed counterparts of activated B cells.26 In either of these states, phosphorylation of at least one JNK isoform was inhibited by an overnight culture with glucosamine and uridine (Supplementary Figure 1).
JNK and nuclear factor kappa B signaling pathways are also activated in CLL cells by the microtubule inhibitor, vincristine (Figure 4a).25 Phosphorylation of JNK in response to vincristine was also particularly impaired (Figure 4a, top two panels), when intracellular O-GlcNAc levels were increased by pre-culture with GlcNAc and uridine (Figure 4a, bottom panel).
Figure 4.
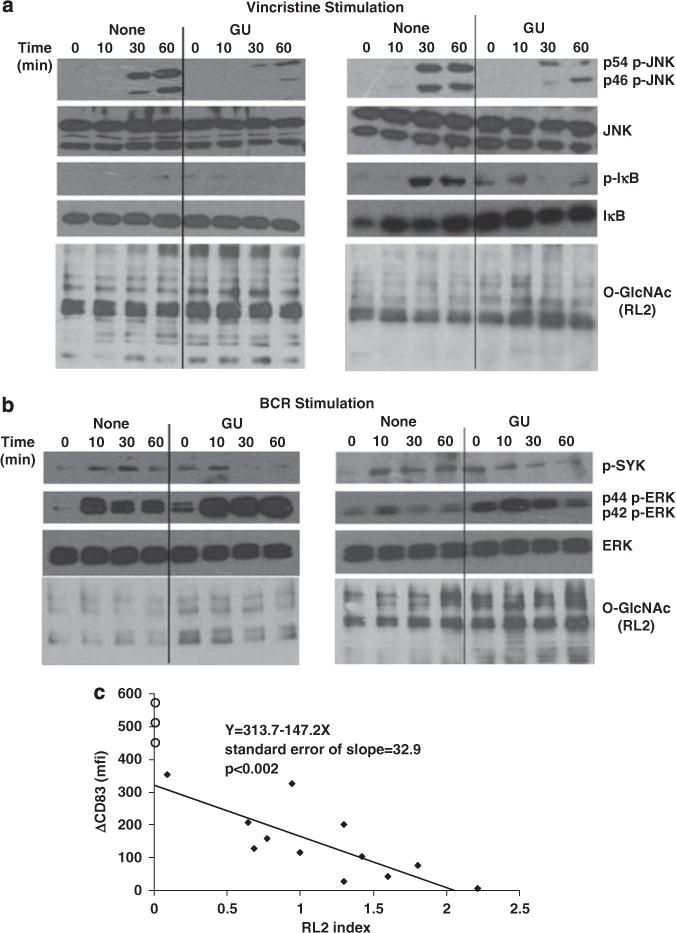
Effect of variations of intracellular O-GlcNAcylation on responses to chemotherapeutic agents, B-cell receptor crosslinking and phorbol esters. Chronic lymphocytic leukemia (CLL) cells were cultured overnight in the presence or absence of GlcNAc and Uridine (GU) and treated with (a) Vincristine (0.3 μg/ml) (patients 80 (left) and 173 (right)) or (b) anti-human IgM antibodies (10 μg/ml) (patients 108 (left) and 21 (right)). Extracts were collected at 0, 10, 30 and 60 min and expression of phosphorylated and total JNK and IκB (for Vincristine) and extracellular signalregulated kinases (ERK) as well as SykYY525/526 (for BCR activation), along with RL2 to confirm increased O-GlcNAcylation, were examined by immunoblotting. Similar results were seen with two other samples for each stimulus. (c) Freshly isolated CLL cells from patients 152, 113, 74, 149, 155, 130, 1, 5, 26, 55, 38 and 154 (solid diamonds) and three normal donors (open circles) were purified and immediately stimulated with phorbol dibutyrate (PDB) (100 ng/ml). Differences in mean fluorescence intensity of CD83 expression on CD19+ B cells, compared with unstimulated cells, were measured by flow cytometry 4h later. RL2 indices were determined using protein extracts from the fresh cells. The results suggest that CLL cells with higher baseline intracellular O-GlcNAcylated protein levels are less responsive to stimulation with PDB.
B-cell receptor-signaling has an important role in the pathogenesis of CLL.27 As readouts for B-cell receptor-signaling, phospho-SykY352 and -ERKT202/Y204 levels were measured, since they usually increase following B-cell receptor-crosslinking despite the anergic features of some CLL cells.3 In contrast to their inhibitory effects on JNK activation by TLR-agonists and microtubule inhibitors (Figures 3c and 4a), GlcNAc and uridine did not significantly affect extracellular signal-regulated kinase phosphorylation by B-cell receptor engagement, although background levels appeared to increase (Figure 4b, second and third panels). However, altered kinetics of Syk phosphorylation accompanied the increase in level of O-GlcNAcylated proteins (Figure 4b, top panel).
Taken together, these results suggested that increased O-GlcNAcylation caused by metabolic loading had marked effects on subsets of signaling pathways in CLL cells. To determine if the natural variations in baseline O-GlcNAc protein levels in CLL cells (Figure 1b) might similarly affect signaling processes, CD83 expression by freshly isolated CLL samples was measured by flow cytometry before, and 4h after, activation with phorbol dibutyrate, an assay we have used previously to reflect protein kinase C signaling.1 At the same time, protein extracts were prepared and frozen to allow subsequent determination of the baseline RL2 index. CLL samples with high baseline RL2 indices proved to be less responsive to protein kinase C agonists and vice versa (Figure 4c). In all the cases, the responses of CLL cells to phorbol dibutyrate were weaker than normal B cells, which have intrinsically very low intracellular O-GlcNAcylation (Figure 1b). Such differences in responsiveness to immunomodulators between normal B cells and CLL cells have been noted previously.1,28
Correlation of O-GlcNAc levels with clinical parameters
To determine if the variations in O-GlcNAcylated protein levels, which were associated with differential responsiveness to phorbol dibutyrate (Figure 4c), had any clinical significance, the RL2 indices of 41 consecutive patients presenting to the CLL clinic at Sunnybrook were related to a number of clinical parameters and conventional biological prognostic factors, including CD38, cytogenetic abnormalities, lymphocyte doubling times and need for treatment2 (Table 1). Note that ZAP-70 and mutation status of rearranged heavy-chain variable genes are not routinely measured at our institution. An association with clinical stage was not observed, although Rai stage IV patients tended to have lower RL2 indices (Figure 5a). However, high levels of O-GlcNAcylation (that is, RL2 index>1) were associated with significantly lower CD38 expression by CLL cells (Figure 5b). Patients with higher RL2 indices (>1) had much longer lymphocyte doubling times (36.1±5.8 months) compared with patients with RL2 indices <1 (8.2±1.1 months) (Figure 5c). Similarly, CLL cells from patients with high-risk cytogenetic abnormalities (that is, any of trisomy 12 or deletions of 11q22–23 or 17p13) (Figure 5e), or disease severe enough to require therapeutic intervention (Figure 5d) had significantly lower RL2 indices than patients with low-risk cytogenetics (that is, normal chromosomes or deletions at 13q14) or disease that did not require treatment. The outlier in Figure 5e is patient 73 with a 17p deletion who has had a benign clinical course (Table 1) despite this ominous prognostic factor. Serum β2M levels, which also reflect aggressive disease, were also higher in patients with RL2 indices <1 (3.43±0.83 mg/l (n=12) compared with 1.98±0.21 mg/l (n=10) for patients with RL2 indices >1), but this difference was not statistically significant. Taken together, these observations suggest that higher O-GlcNAc levels in CLL cells are associated with a favorable outcome, while lower levels are associated with more aggressive disease.
Figure 5.

Correlation of intracellular O-GlcNAcylation with clinical parameters. RL2 indices of freshly isolated chronic lymphocytic leukemia (CLL) cells were measured for 41 patients whose clinical features are described in Table 1. Clinical Rai stage (a), CD38 expression (b), Lymphocyte doubling times (c), number of treatments for symptomatic disease (d), and cytogenetic abnormalities (with no or 13 q deletions considered ‘low-risk’ and any of trisomy 12, 11q or 17p deletions considered ‘high-risk’) (e) were plotted against the RL2 indices. The open circles (b, e) represent patients not included in the statistical analysis. Patients with more aggressive disease had significantly lower intracellular O-GlcNAcylated protein levels, as indicated by the P-values in the respective panels.
Discussion
The findings in this study suggest a role for the hexosamine pathway in the pathogenesis of CLL. Increased levels of O-GlcNAcylated proteins, including OGT, c-myc, p53 and Akt, are found in CLL cells (Figure 1), likely because of high expression of OGT and intracellular concentrations of UDP-GlcNAc (Figures 1b and d). Importantly, higher expression of O-GlcNAcylated proteins appears to be associated with an indolent clinical course, as evidenced by longer doubling times in vivo and absence of symptoms (Figure 5).
The reason for this apparent inverse relationship of total O-GlcNacylated protein levels with the clinical course is not clear. Given that subsets of signaling processes in CLL cells, particularly JNK-signaling (Figures 3c and 4a), appear to be inhibited when O-GlcNAc levels are increased, it is possible that CLL cells with high levels of O-GlcNAcylated proteins are less responsive to activating signals in proliferation centers (Figure 4c), resulting in a slower rate of cell division in vivo and prolonged lymphocyte doubling times. The mechanism by which O-GlcNAcylation is lowered in aggressive cells is also unclear. OGT and UDP-GlcNAc levels do not appear to distinguish between indolent and aggressive cells (Figure 1). Perhaps the changes reflect increased OGase activity29 or a failure of OGT to associate with the signaling complexes in more aggressive cells.30
This model is ‘OGT-centric’ and ignores the potential impact of increased hexosamine activity on glycosylation of proteins and sphingolipids in the golgi (Figure 1a). Indeed, increased flux through the hexosamine pathway has been shown to alter the formation of signaling complexes at the cell surface,7,16 which could affect signal transduction in CLL cells. The relationship of golgi pathway modification and intracellular O-GlcNAcylation in CLL requires further study.
The large increase in OGT expression in CLL cells (Figure 1b) compared with normal cells raises the possibility that the OGT gene sequence, or structure may be modified as part of the leukemogenic process. OGT is found at chromosome Xq13, which is not commonly affected in CLL. Disruptions in this region have been reported, but they are too infrequent31 to account for the essentially uniform overexpression of OGT in CLL samples (Figure 1). However, OGT is induced by cellular activation32 and we suggest its presence in circulating CLL cells may reflect the stimulatory events that occur in a proliferation center.
Larger prospective studies are needed to properly address the possibility that O-GlcNAc levels could be an independent prognostic factor for high-risk CLL (Figure 5). Rather than measuring the global O-GlcNAcylation, as done in this study, perhaps levels of individual O-GlcNAcylated signaling proteins, such as Akt, or possibly JNK, (Figures 2 and 3) may suffice to reveal the relevant activity of the hexosamine pathway in a patient’s tumor cells. Such assays await the development of antibodies against O-GlcNAcylated forms of these proteins. Similarly, the therapeutic possibilities of manipulating O-GlcNAc levels in CLL cells may be worthy of further exploration. For example, administration of glucosamine analogs might possibly slow proliferation of CLL cells in vivo by inhibiting their responsiveness to microenvironmental signals.
Supplementary Material
Acknowledgments
This work was supported by Grants from the Ontario Institute of Cancer Research (OICR no. 07Nov-61)), the Canadian Institutes of Health Research (CIHR) (no. 190633) and the Leukemia and Lymphoma Society of Canada (to DS), a Camille Dreyfus Teacher-Scholar award (no. TC-03-009) (to SW), CIHR Grants MOP-79405 and MOP-43938 and a Grant from Genome Canada through the Ontario Genomics Institute (to JWD), Grants NCI R01CA42486 and NIDDK R01 DK61671 (to GWH) and CIHR Grant no. 15095 (to JPD). We thank Dimitar Efremov, Mark Minden and Suzanne Kamel-Reid for helpful discussions.
Footnotes
Conflict of interest
The authors declare no conflict of interest.
Supplementary Information accompanies the paper on the Leukemia website (http://www.nature.com/leu)
References
- 1.Hammond CM, Shi Y, White D, Cervi D, Tomic J, Spaner DE. The B cell calcium receptor predicts progression of chronic lymphocytic leukemia. Leukemia. 2009;23:426–429. doi: 10.1038/leu.2008.351. [DOI] [PubMed] [Google Scholar]
- 2.Kay NE, O’Brien SM, Pettitt AR, Stilgenbauer S. The role of prognostic factors in assessing ‘high-risk’ subgroups of patients with chronic lymphocytic leukemia. Leukemia. 2007;21:1885–1891. doi: 10.1038/sj.leu.2404802. [DOI] [PubMed] [Google Scholar]
- 3.Ghia P, Chiorazzi N, Stamatopoulos K. Microenvironmental influences in chronic lymphocytic leukaemia: the role of antigen stimulation. J Intern Med. 2008;264:549–562. doi: 10.1111/j.1365-2796.2008.02030.x. [DOI] [PubMed] [Google Scholar]
- 4.Kroemer G, Pouyssegur J. Tumor cell metabolism: cancer’s Achilles’ heel. Cancer Cell. 2008;13:472–482. doi: 10.1016/j.ccr.2008.05.005. [DOI] [PubMed] [Google Scholar]
- 5.Vosseller K, Wells L, Lane MD, Hart GW. Elevated nucleocytoplasmic glycosylation by O-GlcNAc results in insulin resistance associated with defects in Akt activation in 3T3-L1 adipocytes. Proc Natl Acad Sci USA. 2002;99:5313–5318. doi: 10.1073/pnas.072072399. [DOI] [PMC free article] [PubMed] [Google Scholar]
- 6.Hart GW, Housley MP, Slawson C. Cycling of O-linked beta-N-acetylglucosamine on nucleocytoplasmic proteins. Nature. 2007;446:1017–1022. doi: 10.1038/nature05815. [DOI] [PubMed] [Google Scholar]
- 7.Lau KS, Partridge EA, Grigorian A, Silvescu CI, Reinhold VN, Demetriou M, et al. Complex N-glycan number and degree of branching cooperate to regulate cell proliferation and differentiation. Cell. 2007;129:123–134. doi: 10.1016/j.cell.2007.01.049. [DOI] [PubMed] [Google Scholar]
- 8.Gitelson E, Hammond C, Mena J, Lorenzo M, Buckstein R, Berinstein NL, et al. CLL-reactive T cells during tumor progression and after oxidized autologous tumor cell vaccines. Clin Can Res. 2003;9:1656–1665. [PubMed] [Google Scholar]
- 9.Zuccolo J, Unruh TL, Deans JP. Efficient isolation of highly purified tonsil B lymphocytes using RosetteSep with allogeneic human red blood cells. BMC Immunol. 2009;10:30. doi: 10.1186/1471-2172-10-30. [DOI] [PMC free article] [PubMed] [Google Scholar]
- 10.Shi Y, White D, He L, Miller RL, Spaner DE. Toll-like receptor-7 tolerizes malignant B cells and enhances killing by cytotoxic agents. Cancer Res. 2007;67:1823–1831. doi: 10.1158/0008-5472.CAN-06-2381. [DOI] [PubMed] [Google Scholar]
- 11.Spaner DE, Shi Y, White D, Shaha S, He L, Masellis A, et al. A phase I/II trial of TLR-7 agonist immunotherapy in chronic lymphocytic leukemia. Leukemia. 2010;24:222–226. doi: 10.1038/leu.2009.195. [DOI] [PubMed] [Google Scholar]
- 12.Gross BJ, Kraybill BC, Walker S. Discovery of O-GlcNAc transferase inhibitors. J Am Chem Soc. 2005;127:14588–14589. doi: 10.1021/ja0555217. [DOI] [PubMed] [Google Scholar]
- 13.Holt GD, Snow CM, Senior A, Haltiwanger RS, Gerace L, Hart GW. Nuclear pore complex glycoproteins contain cytoplasmically disposed O-linked GlcNAc. J Cell Biol. 1987;104:1157–1164. doi: 10.1083/jcb.104.5.1157. [DOI] [PMC free article] [PubMed] [Google Scholar]
- 14.Wells L, Gao Y, Mahoney JA, Vosseller K, Chen C, Rosen A, et al. Dynamic O-glycosylation of nuclear and cytosolic proteins: further characterization of the nucleocytoplasmic beta-N-acetylglucosa-minidase, O-GlcNAcase. J Biol Chem. 2002;277:1755–1761. doi: 10.1074/jbc.m109656200. [DOI] [PubMed] [Google Scholar]
- 15.Iyer SP, Akimoto Y, Hart GW. Identification and cloning of a novel family of coiled-coil domain proteins that interact with OGT. J Biol Chem. 2003;278:5399–5409. doi: 10.1074/jbc.M209384200. [DOI] [PubMed] [Google Scholar]
- 16.Grigorian A, Lee S, Tian W, Chen I, Gao G, Mendelsohn R, et al. Control of T Cell-mediated autoimmunity by metabolite flux to N-glycan biosynthesis. J Biol Chem. 2007;282:20027–20035. doi: 10.1074/jbc.M701890200. [DOI] [PubMed] [Google Scholar]
- 17.Garcia-Gonzalo FR, Izpisúa Belmonte JC. Albumin-associated lipids regulate human embryonic stem cell self-renewal. PLoS One. 2008;3:e1384. doi: 10.1371/journal.pone.0001384. [DOI] [PMC free article] [PubMed] [Google Scholar]
- 18.Oki T, Yamazaki K, Kuromitsu J, Okada M, Tanaka I. cDNA cloning and mapping of a novel subtype of glutamine:fructose-6-phosphate amidotransferase (GFAT2) in human and mouse. Genomics. 1999;57:227–234. doi: 10.1006/geno.1999.5785. [DOI] [PubMed] [Google Scholar]
- 19.Kreppel LK, Hart GW. Regulation of a cytosolic and nuclear O-GlcNAc transferase. Role of the tetratricopeptide repeats. J Biol Chem. 1999;274:32015–32022. doi: 10.1074/jbc.274.45.32015. [DOI] [PubMed] [Google Scholar]
- 20.Zachara N, Hart G. Cell signaling, the essential role of O-GlcNAc! Biochim Biophys Acta. 2006;1761:599–617. doi: 10.1016/j.bbalip.2006.04.007. [DOI] [PubMed] [Google Scholar]
- 21.Yang WH, Kim JE, Nam HW, Ju JW, Kim HS, Kim YS, et al. Modification of p53 with O-linked N-acetylglucosamine regulates p53 activity and stability. Nat Cell Biol. 2006;8:1074–1083. doi: 10.1038/ncb1470. [DOI] [PubMed] [Google Scholar]
- 22.Chou T, Dang C, Hart G. Glycosylation of the c-Myc transactivation domain. Proc Natl Acad Sci USA. 1995;92:4417–4421. doi: 10.1073/pnas.92.10.4417. [DOI] [PMC free article] [PubMed] [Google Scholar]
- 23.Tomic J, White D, Shi Y, Mena J, Hammond C, He L, et al. Sensitization of IL-2 signaling through TLR-7 enhances B lymphoma cell immunogenicity. J Immunol. 2006;176:3830–3839. doi: 10.4049/jimmunol.176.6.3830. [DOI] [PubMed] [Google Scholar]
- 24.Ngoh G, Watson L, Facundo H, Dillmann W, Jones S. Non-canonical glycosyltransferase modulates post hypoxic cardiac myocyte death and mitochondrial permeability transition. J Mol Cell Cardiol. 2008;45:313–325. doi: 10.1016/j.yjmcc.2008.04.009. [DOI] [PMC free article] [PubMed] [Google Scholar]
- 25.Shaha SP, Tomic J, Shi Y, Pham T, Mero P, White D, et al. Prolonging microtubule dysruption enhances the immunogenicity of chronic lymphocytic leukaemia cells. Clin Exp Immunol. 2009;158:186–198. doi: 10.1111/j.1365-2249.2009.04003.x. [DOI] [PMC free article] [PubMed] [Google Scholar]
- 26.Klein U, Tu Y, Stolovitzky G, Mattioli M, Cattoretti G, Husson H, et al. Gene expression profiling of B cell CLL reveals a homogeneous phenotype related to memory B cells. J Exp Med. 2001;194:1625–1638. doi: 10.1084/jem.194.11.1625. [DOI] [PMC free article] [PubMed] [Google Scholar]
- 27.Efremov DG, Gobessi S, Longo PG. Signaling pathways activated by antigen-receptor engagement in chronic lymphocytic leukemia B-cells. Autoimmun Rev. 2007;7:102–108. doi: 10.1016/j.autrev.2007.02.021. [DOI] [PubMed] [Google Scholar]
- 28.Spaner DE, Shi Y, White D, Mena J, Hammond C, Tomic J, et al. Immunomodulatory effects of Toll-like receptor-7 activation on chronic lymphocytic leukemia cells. Leukemia. 2006;20:286–295. doi: 10.1038/sj.leu.2404061. [DOI] [PubMed] [Google Scholar]
- 29.Slawson C, Pidala J, Potter R. Increased N-acetyl-beta-glucosaminidase activity in primary breast carcinomas corresponds to a decrease in N-acetylglucosamine containing proteins. Biochim Biophys Acta. 2001;1537:147–157. doi: 10.1016/s0925-4439(01)00067-9. [DOI] [PubMed] [Google Scholar]
- 30.Yang X, Zhang F, Kudlow JE. Recruitment of OGT to promoters by corepressor mSin3A: coupling protein O-GlcNAcylation to transcriptional repression. Cell. 2002;110:69–80. doi: 10.1016/s0092-8674(02)00810-3. [DOI] [PubMed] [Google Scholar]
- 31.Kalla C, Nentwich H, Schlotter M, Mertens D, Wildenberger K, Döhner H, et al. Translocation t(X;11)(q13;q23) in B-CLL disrupts two novel genes. Genes Chromosomes Cancer. 2005;42:128–143. doi: 10.1002/gcc.20131. [DOI] [PubMed] [Google Scholar]
- 32.Cheung WD, Hart GW. AMP-activated protein kinase and p38 MAPK activate O-GlcNAcylation of neuronal proteins during glucose deprivation. J Biol Chem. 2008;283:13009–13020. doi: 10.1074/jbc.M801222200. [DOI] [PMC free article] [PubMed] [Google Scholar]
Associated Data
This section collects any data citations, data availability statements, or supplementary materials included in this article.