
Figure 2.
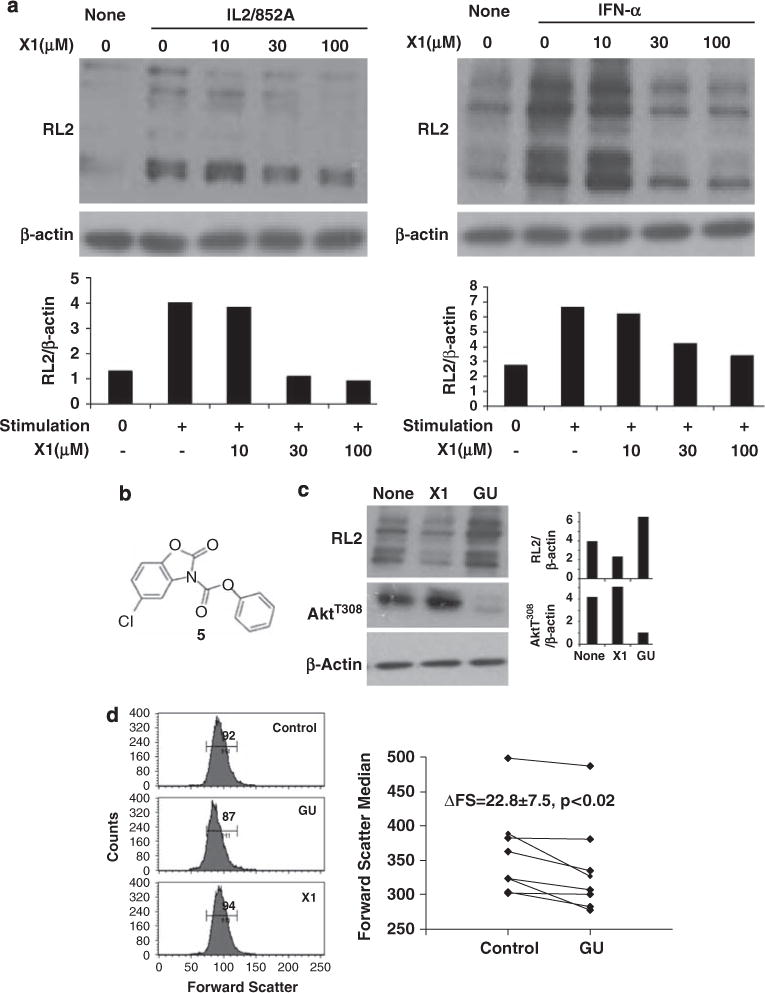
Effect of immunoreceptor agonists and hexosamine pathway substrates on O-GlcNAcylation in chronic lymphocytic leukemia (CLL) cells. (a) Samples from patients 26 and 111, with relatively low baseline O-GlcNAc levels, were incubated with the indicated concentrations of X1 for 30 min and then stimulated with IL2 (100 U/ml), and 852A (0.1 μg/ml) (left panel) or interferon-a2b (1000 U/ml) (right panel), respectively. Extracts were made after 1h and immunoblotted with RL2 antibodies. The intensity of RL2 staining relative to β-actin levels was determined by densitometry and shown below each lane. Similar results were obtained with two other samples. (b) Chemical structure of X1.12 (c) CLL cells from patient 46 were cultured for 2 days in AIM-V alone, with the O-linked N-acetylglucosamine (GlcNAc) transferase (OGT) inhibitor, X1 (50 μM) or with GlcNAc (20 mM) and Uridine (5 mM) (GU) to provide substrates to OGT. Protein extracts were then examined with RL2 and antibodies to activated AktT308. Staining intensities, relative to β-actin, were quantified by densitometry (right panels). GU increased O-GlcNAc levels and decreased the AktT308 levels, while X1 had the opposite effect. (d) Cell size was indicated by the forward scatter parameter of flow cytometry. Cells treated with GU were smaller while cells treated with X1 were slightly larger than cells cultured alone. Numbers in the histogram are the means of the M1 region. The graph summarizes results with eight other CLL samples (patients. 128, 133, 171, 172, 173, 125, 26 and 174), and shows the average and standard error of the differences in cell size due to substrate loading of the hexosamine pathway (P<0.02 for the eight samples).