

Abstract
Mutations in the gene for the lysosomal enzyme glucocerebrosidase (GCase) cause Gaucher disease and are the most common risk factor for Parkinson disease (PD). Analytical ultracentrifugation of 8 μM GCase shows equilibrium between monomer and dimer forms. However, in the presence of its co-factor saposin C (Sap C), only monomer GCase is seen. Isothermal calorimetry confirms that Sap C associates with GCase in solution in a 1:1 complex (Kd = 2.1 ± 1.1 μM). Saturation cross-transfer NMR determined that the region of Sap C contacting GCase includes residues 63–66 and 74–76, which is distinct from the region known to enhance GCase activity. Because α-synuclein (α-syn), a protein closely associated with PD etiology, competes with Sap C for GCase binding, its interaction with GCase was also measured by ultracentrifugation and saturation cross-transfer. Unlike Sap C, binding of α-syn to GCase does not affect multimerization. However, adding α-syn reduces saturation cross-transfer from Sap C to GCase, confirming displacement. To explore where Sap C might disrupt multimeric GCase, GCase x-ray structures were analyzed using the program PISA, which predicted stable dimer and tetramer forms. For the most frequently predicted multimer interface, the GCase active sites are partially buried, suggesting that Sap C might disrupt the multimer by binding near the active site.
Keywords: Gaucher disease, Parkinson disease, NMR, AUC, α-synuclein
1. Introduction
GBA1 encodes glucocerebrosidase (GCase), a 60 kDa lysosomal enzyme that hydrolyzes glucose from glucosyl-sphingolipids such as glucosylceramide (GluCer). Inheritance of mutated GBA1 from both parents results in the lysosomal storage disorder, Gaucher disease (GD). Mutations in GBA1 are the most common known genetic risk modifiers for Parkinson disease (PD) [1]. Despite a wealth of studies linking GBA1 mutations and PD, the underlying mechanisms have yet to be defined [2,3]. Progress is being made, however, as a growing number of studies show a correlation between GCase deficiency and increased levels of α-synuclein (α-syn), a protein closely associated with PD [4,5,6]. In fact, α-syn physically interacts with GCase and inhibits its activity under the acidic conditions found in lysosomes [7,8]. Curiously, while GBA1 mutations are a common PD risk factor, the penetrance is low [9]. Only a minority of GD patients and carriers develop PD, thus other factors are also expected to play a role in promoting PD pathogenesis. Obvious molecules of interest include ones that modulate GCase activity and the interaction of α-syn and GCase.
In vivo degradation of GluCer by GCase is facilitated by the co-factor saposin C (Sap C), a 9 kDa membrane-interacting lysosomal protein [10]. The structures of GCase and Sap C are shown in Fig. 1. Sap C is one of four saposin proteins resulting from proteolytic cleavage of the 70 kDa precursor prosaposin. All four saposins promote hydrolysis of glycolipids by various lysosomal enzymes [11,12]. Sap C has been proposed to aid GluCer hydrolysis by altering lipid bilayer properties, by enhancing recruitment of GCase to the membrane, or through a direct association with GCase that enhances its activity [13,14,15]. Although rare, Sap C deficiency alone can result in GD-like symptoms in patients [11], demonstrating its essential role in GluCer metabolism. We previously found that Sap C can fully rescue the inhibition of GCase activity by α-syn, physically displacing the α-syn bound to GCase [16].
Figure 1.
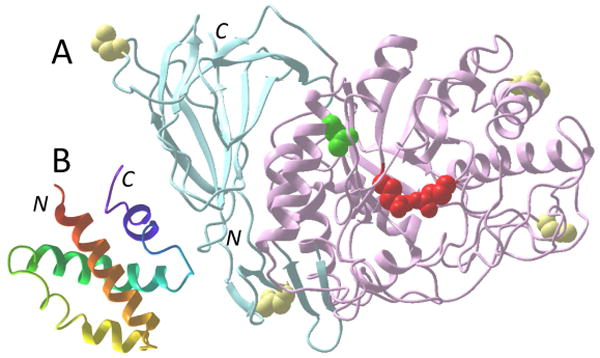
Structures of GCase and Sap C. (A) The ribbon structure of GCase is shown with the N- and C- terminal β-domains in light blue, the TIM barrel catalytic domain in pink with the catalytic glutamate residues in red, the common GD mutation site N370S in green, and glycosylation sites in yellow. (B) The ribbon structure of Sap C is shown shaded from red to violet from the N- to the C-terminus. Locations of N- and C-termini are also indicated.
For the fluorescence measurements of the displacement of α-syn from GCase by Sap C, the results were best fit by a model where the proteins interact with a stoichiometry of 1:2 Sap C to GCase, implying either that Sap C has two sites that bind GCase monomers with comparable affinity or that one Sap C monomer binds to a dimer of GCase [16]. The same stoichiometry was obtained both for α-syn displacement in solution and in the presence of lipid vesicles. Here, we report on a detailed characterization of the interaction of Sap C and GCase in solution. To test whether Sap C binds GCase dimer, we measure GCase using analytical ultracentrifugation (AUC) alone and in the presence of Sap C. Using isothermal titration calorimetry (ITC) we measure the stoichiometry and binding affinity. Finally, to test whether Sap C has two binding sites for GCase, we employ the saturation cross-transfer nuclear magnetic resonance (NMR) technique to map the interacting regions of Sap C with GCase in solution.
2. Materials and Methods
2.1 Protein expression and purification
The Sap C plasmid (pET-16, Novagen) was provided by Gilbert Privé (University of Toronto, Canada), and includes an additional Met-Gly at the N-terminus. Uniformly 2H/15N-labeled protein was produced by a procedure similar to that described in Deshmukh et al. [17] (additional details provided in Fig. S2). Mass spectrometric analysis indicated the loss of the N-terminal methionine and 97% deuteration of non-exchangeable sites (9,588 Da in H2O). 2H/15N human recombinant α-syn was expressed similarly but in BL21(DE3) pLysS cells. α-Syn was purified as previously described [18] and mass spectrometry indicated 99% deuteration of non-exchangeable sites (15,405 Da in H20). Taliglucerase alfa (recombinant GCase) was obtained as a gift from Protalix Biotherapeutics Corp. (Carmiel, Israel). Except where noted, all samples were exchanged into 50 mM sodium acetate (NaOAc) and 100 mM NaCl buffer (pH 5) by repeated buffer exchanges using Amicon Ultra YM3 (Sap C and α-syn) and YM30 (GCase) centrifugal filters (Millipore). Protein concentrations were determined using theoretical extinction coefficients at 280 nm: ε280 (GCase) = 94,353 M−1 cm−1, ε280 (Sap C) = 3,355 M−1 cm−1, and ε280 (α-syn) = 5,120 M−1 cm−1.
2.2 Analytical ultracentrifugation (AUC)
All AUC experiments were performed at 20 °C in the ProteomeLab XL-I analytical ultracentrifuge (Beckman Coulter, Indianapolis, IN) using absorption optics as previously described [19]. Samples with GCase and 2 μM Sap C (α-syn) were prepared and measured first and then the 20 μM samples were made by adding appropriate volumes of higher concentration stocks of Sap C (α-syn) and concentrating to the original sample volume. Final sample concentrations were verified by absorbance at 280 nm; a lower GCase concentration (∼5 vs. 7 μM) was measured for the sample with 20 μM α-syn. Data were analyzed in terms of continuous distributions (c(s)) using the SEDFIT program [19,20] with RMSD < 0.004 and were plotted in GUSSI (http://biophvsics.swmed.edu/MBR/software.html).
2.3 Isothermal titration calorimetry (ITC)
ITC titrations were performed at 25 °C using the ITC200 calorimeter (MicroCal, Northampton, MA). GCase (20 μM) in the 200 μL cell was titrated with 300 μM Sap C using 30 injections at 300-s intervals. The first injection was 0.2 μL and all others were 1.3 μL up to 3 molar equivalents. Data were integrated using NITPIC [21], were analyzed in SEDPHAT [22], and plotted in GUSSI. Syringe concentration (Sap C incompetent fraction) and heat of dilution were adjusted during the fit.
2.4 Nuclear magnetic resonance (NMR)
The saturation cross-transfer experiment was performed as described [23] and consists of a WURST adiabatic pulse repeated for 3.2 s over the frequency range desired for saturation, followed by a standard 15N HSQC pulse sequence. The pulse sequence was also repeated for each time point with the saturation frequency range far off resonance, at roughly –1667 ppm in the proton dimension, and collected interleaved with the on-resonance data. The off-resonance spectra backbone amide intensities (peak heights) were used to normalize the on-resonance intensities. The normalized intensities in the presence of GCase were corrected for solvent effects by dividing by the normalized intensities of Sap C alone. The NMR experiments were performed at 15 °C on a Bruker 600 MHz Avance spectrometer equipped with a cryoprobe, with 5% D2O added to the 50 mM NaOAc, 100 mM NaCl pH 5 buffer. Sap C assignments are from de Alba et al. [24].
3. Results
3.1 Sap C binds to GCase monomer
Preliminary work on GCase using small-angle X-ray scattering at concentrations ≥ 22 μM in solution indicated GCase was present in multiple multimeric forms (Fig. S1). To explore multimerization of GCase at lower concentrations and to probe the impact of Sap C interaction, AUC was empoyed. GCase has 12 tryptophan residues, allowing measurements using UV absorbance at 280 nm down to ∼1 μM. The c(s20,w) distribution of GCase at 8.0 μM shows two main peaks consistent with monomer (4.4 S) and dimer (5.9 S) (see below), with trace amounts of higher molecular weight species and aggregates (< 4% total concentration) (Fig. 2A). The populations of the putative monomer and dimer are nearly equivalent (53% and 47% for monomer and dimer species, respectively) suggesting that the Kd for GCase dimerization is in the μM range. At 1.7 μM, only the monomer peak is present with a slightly lower sedimentation coefficient (4.2 S) and with a broad shoulder extending to the higher S values (Fig. 2A), indicating a fast dimerization off-rate on the AUC experiment time-scale (koff > 10−2 s−1). For 7.4 μM GCase in the presence of 2 μM Sap C, the pattern of oligomerization is unchanged and there is no appearance of a signal for free Sap C, suggesting that all Sap C is bound (Fig. 2B). Surprisingly, when Sap C is increased to 20 μM, only the monomeric GCase peak is observed at 4.4 S (Fig. 2B), slightly higher than the 1.7 μM monomeric peak (4.2 S), thus Sap C is bound to and keeps GCase in its monomeric state. Note that the relative positions of the Sap C, GCase monomer and dimer peaks 1.2 S, 4.2 S, and 5.9 S are consistent with simple spherical model predictions using their molecular weight ratios to the 2/3 power, i.e. (60kD/9kD)2/3 ∼ (4.2S/1.2S) and (120kD/60kD) 2/3 ∼ (5.9S/4.2S).
Figure 2.
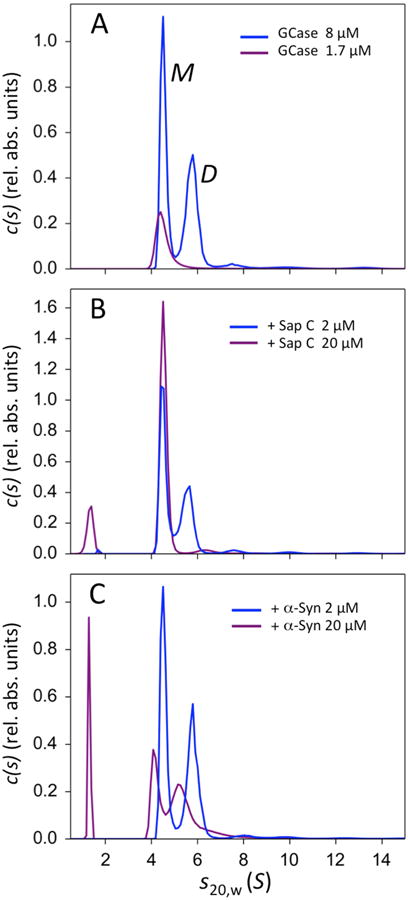
AUC results for GCase in the presence of Sap C and α-syn. (A) Sedimentation coefficients for GCase alone at 8.0 μM (blue curve) and 1.7 μM (purple curve). The sedimentation coefficient distributions c(s) are plotted in relative absorbance units versus svedbergs (S). The monomer and dimer peaks are indicated by M and D, respectively. (B) Sedimentation coefficients of 7.4 μM GCase in the presence of 2.0 μM Sap C (blue), and 7.8 μM GCase in the presence of 20 μM Sap C (purple). For 20 μM Sap C, the peak corresponding to GCase dimer is absent. The new peak seen at S = 1.2 corresponds to unbound Sap C. (C) Sedimentation coefficients of 7.2 μM GCase in the presence of 2.0 μM α-syn (blue), and 5.0 μM GCase in the presence of 20 μM α-syn (purple). The new peak seen at S = 1.2 corresponds to unbound α-syn.
Sap C and α-syn compete for GCase binding [16], so α-syn was tested to see if it also could affect dimerization. As with Sap C, when 7.2 μM GCase was evaluated in the presence of 2 μM α-syn, the pattern of oligomerization was not changed, and the absence of a signal for free α-syn indicated that all α-syn is bound (Fig. 2C). Unlike with Sap C, increasing the α-syn concentration to 20 μM did not prevent dimerization of GCase, even with a lower GCase concentration (5.0 μM) (Fig. 2C). Instead, at the higher concentration α-syn causes both GCase peaks to broaden and shift towards smaller S20,w values, suggesting that α-syn might be interacting with both monomer and dimer forms of GCase. Note that when α-syn binds to GCase in solution, residues 1-117 of α-syn do not contact GCase and remain intrinsically disordered [7]. The S20,w value of the complex depends not only on the total mass, but on the specific density and shape factor as well, so the non-interacting flexible region of α-syn might account for the changes in the sedimentation peaks.
3.2 Sap C binds GCase with 1:1 stoichiometry
The raw and baseline corrected thermograms, along with the fit to the integrated peaks with residuals, are shown in Fig. 3. The titration of Sap C into GCase resulted in the exothermic reaction with the apparent enthalpy of −4.1 kcal/mol. The binding isotherm was fit using models assuming 1:1, 2:1 or 1:2 Sap C/GCase association ratios. The 1:1 model yielded the best fit with an incompetent fraction of 18% for Sap C. The other association ratios yielded unrealistically high incompetent fraction values, 40% incompetent GCase for the 1:2 model and 60% incompetent Sap C for the 2:1 model. The 1:1 model yielded a Kd of 2.1 ± 1.1 μM with a heat of dilution of−0.75 kcal/mol for Sap C.
Figure 3.
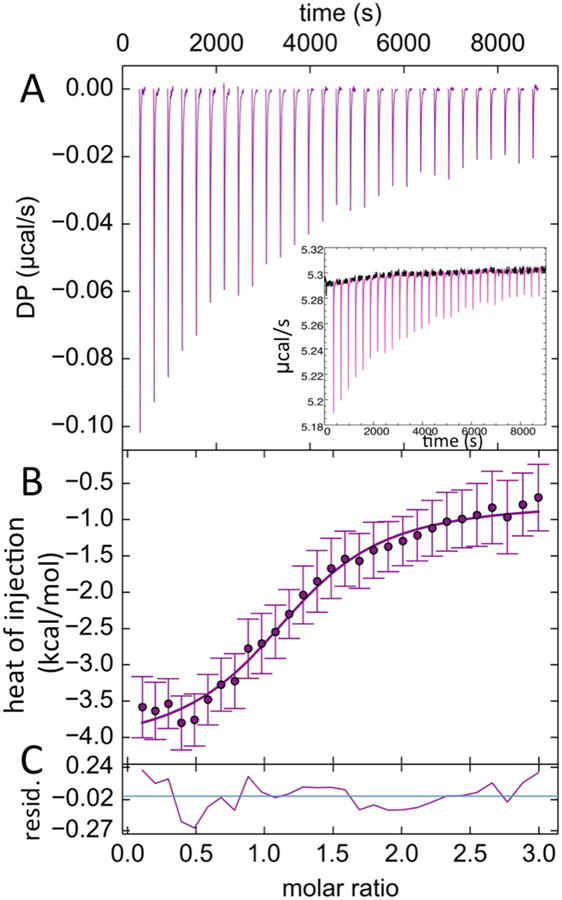
ITC titration of GCase with Sap C. (A) Baseline corrected DP (measured power differential) peaks used for enthalpy determination. Inset shows the raw ITC data. Portions not included in the baseline corrected peaks are shown in black. (B) Plot of the integrated peaks with error bars determined by baseline uncertainty [21], fit with a 1:1 binding curve and (C) residuals resulting from the fit, ranging from −0.27 to 0.24 kcal/mol.
3.3 Region of Sap C in contact with GCase
In order to determine which Sap C residues are in contact with GCase, a saturation cross-transfer NMR experiment was performed [23]. In this experiment, the GCase methyl group 1H spin populations are first saturated, then diffuse via NOE interactions across the interface to the Sap C backbone amide protons closest to the GCase. The Sap C in the sample must be deuterated, 97% in our case determined by mass spectrometry, in order to minimize direct saturation of the 1H population in Sap C. In order to gauge the impact of residual methyl protonation of Sap C and other potential effects, such as interaction with solvent, the saturation cross-transfer experiment was first performed on 38 μM Sap C alone. The results for the backbone amides for Sap C alone are shown in Fig. 4A, and the corresponding 2D 15N HSQC spectrum in shown in Fig. S2A. The experiment was performed twice using two saturation sweep widths (0.1–1.1 and 0.05–0.55 ppm), indicated by the error bars, and no qualitative difference was observed between the data sets. Both data sets show intensity reduction for residues 45–47 at the beginning of the third helix of Sap C. Since the backbone amides of these residues are not near any methyl groups it is unclear what causes this reduction, perhaps some effect involving the solvent.
Figure 4.
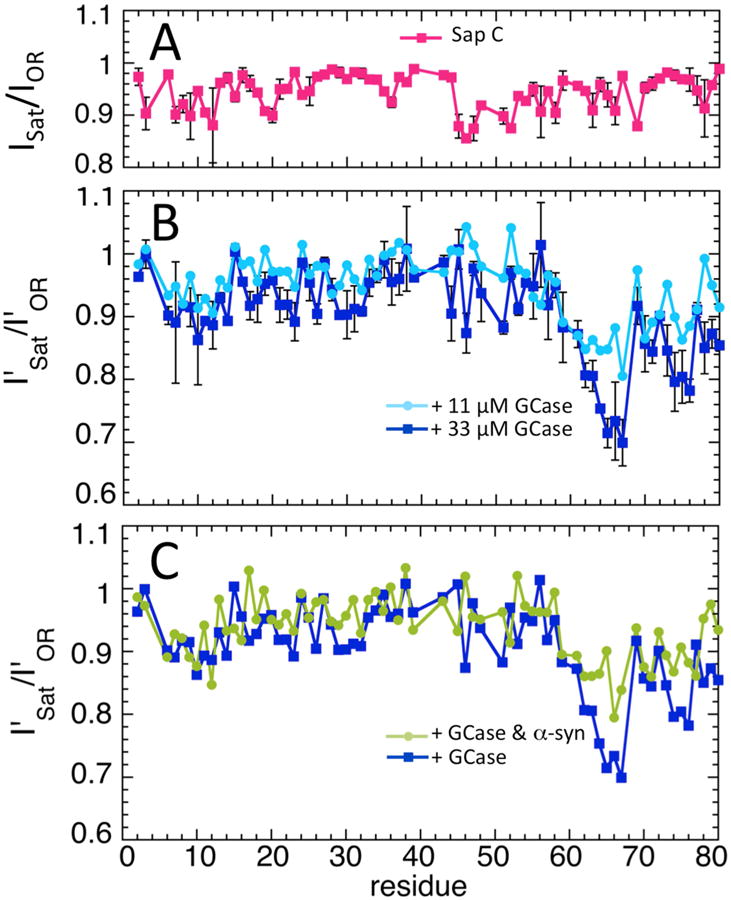
Saturation cross-transfer from GCase to Sap C. (A) Saturation cross-transfer backbone amide resonance intensities (ISat) of 38 μM Sap C alone, normalized by the intensities with the saturation applied off-resonance (IOR). The error bars indicate values from two experiments, with the saturation done at two different sweep widths. (B) Sap C (38 μM) saturation cross-transfer backbone amide resonance intensities in the presence of GCase at 33 μM (dark blue) and 11 μM (light blue), normalized by the off-resonance intensities, and corrected by the normalized intensities of Sap C alone (see Materials and methods), indicated by the primes (I′Sat/I′OR). The error bars indicate values from two experiments for GCase at 33 μM, with the saturation done at two different sweep widths. (C) Sap C (38 μM) normalized, corrected saturation cross-transfer intensities (I′Sat/I′OR) with 33 μM GCase in the presence (green) and absence (dark blue) of 152 μM α-syn. The dark blue curve is the same as in panel B and is shown for comparison.
The results for the saturation cross-transfer experiment in the presence of 33 μM GCase are shown in Fig. 4B, with the corresponding 15N HSQC spectrum shown in Fig. S2A. GCase causes the greatest reduction for Sap C residues 63–66, which lie in the loop preceding the final helix. Residues 74–76 at the end of the final helix also show significant reduction. The location of these residues in the human and consensus Sap C sequences are shown in Fig. S3. The experiment was repeated with GCase at 11 μM (Fig. 4B), and less intensity reduction for residues 63–66 and 74–76 was observed, confirming that their signal reduction comes from saturation cross-transfer. Sap C and α-syn compete for GCase binding, and this was confirmed using saturation cross-transfer, where added α-syn (152 μM) also caused less intensity reduction in residues 63–66 and 74–76 of Sap C (Fig. 4C). As an additional control, saturation cross-transfer between GCase and 2H/15N α-syn was measured at two GCase concentrations with residues 122–137 showing the greatest intensity reduction (Fig. S4). This corresponds well to results using backbone amide intensity reduction in 15N HSQC NMR spectra [7], where α-syn residues 118–137 were determined as the region of interaction.
4. Discussion
The AUC results clearly show that GCase exists in monomer/multimer equilibrium in solution that is driven to the monomeric state when interacting with Sap C. ITC confirmed a 1:1 complex, though it is unclear whether Sap C actively dissociates GCase dimer or simply binds free monomer and prevents self-association. The 1:1 stoichiometry contradicts earlier proposals [25], including our own based on displacement of α-syn by Sap C probed by fluorescence spectroscopy, where the data was best fit with a 1:2 Sap C/GCase binding model [16]. The model assumed non-cooperative, independent binding sites. However, since Sap C binding involves transition of GCase from multimer to monomer states (Fig. 2B), the assumption of non-cooperative binding is likely not valid, potentially accounting for the discrepancy.
The concentration of 8 μM used in the AUC experiments might seem high for the cellular milieu; however, GCase is trafficked to lysosomes confined inside vesicles. A simple calculation (n = (π/6)cd3NA, where n is the number of molecules, c is the concentration in molar, d is the diameter in decimeters, and NA is Avogadro's number) shows that just 19 molecules of GCase in a vesicle with inner diameter 200 nm yields a concentration of 8 μM. To give a sense of the dimensions involved, GCase measures 9.5 nm along its widest axis, so the vesicle is over 20 times wider. In a study of GCase interacting with its trafficking partner LIMP-2, preliminary cross-linking results suggested they form a 2:2 complex [26], and while this does not prove GCase binds LIMP-2 as a dimer, it is consistent with the possibility.
While the LIMP-2 cross-linking results hint that dimeric GCase might be present in trafficking vesicles, there is also evidence of the importance of monomeric GCase in vivo from studies using radiation inactivation of human spleen homogenates [27]. This experiment measures the homo-multimerization state of enzymes. For homogenates from normal spleens, GCase was found to be predominantly monomeric. Intriguingly, in homogenates from spleens of two GD patients, GCase was predominantly dimeric. This suggests the mutations in these particular GD patients cause GCase to favor a dimeric form. Building on this idea, one of the biological roles of Sap C could be to facilitate the transition of GCase to a monomeric form in the lysosome; hence, there could be mutations that promote GD and PD because they interfere with this aspect of the Sap C interaction.
The NMR results presented here map the region contacted by GCase to Sap C residues 63–66 and 74–76. Two previous experimental studies have probed which part of Sap C interacts with GCase and enhances its activity [25,28]. Both studies found that the second half of Sap C activates GCase nearly as well as intact Sap C. Interestingly, both studies also found that the residues most important for activation lie in the region just before that identified by NMR, with the first study identifying residues 41–49 [25] and the second residues 47–62 [28]. These results are consistent with proposed mechanisms where Sap C alters membrane structure in a manner that facilitates substrate access to GCase and helps to recruit GCase to the altered membrane region [14,29]. We note that in the first study, the most strongly binding peptide included residues 41–80, with an apparent dissociation constant (Kact in their nomenclature) of 1.3 μM, similar to the Kd reported here.
The precise region of GCase that Sap C binds to has not been determined experimentally. The disruption of dimeric GCase by Sap C suggests that one possibility is that the Sap C binding site overlaps with the dimer interface. In order to learn more about which multimer forms GCase might assume, we surveyed the x-ray structures of human GCase using the PDBe PISA program for predicting energetically favorable macromolecular interfaces [30]. Nearly all the structures were predicted to form stable dimers and/or tetramers, with the lowest free energy, most frequently predicted multimer interface having the active sites facing the interface and partially buried (Fig. S5). Thus, if the Sap C binding site overlaps with the dimer interface, then the PISA results would suggest that Sap C binds somewhere near the enzyme active site.
Supplementary Material
Fig. S1. Small-angle X-ray scattering (SAXS) results for GCase. (A) Experimental SAXS data is shown for 44 μM GCase. The inset shows Guinier fit (red line) of the lowest-q data (filled symbols) up to qmax*Rgyr = 1.3. Fit residual (experimental minus calculated) is shown on top of the inset with red horizontal line indicating zero. (B) Distribution of the inter-atomic distances within the scattering particle obtained via regularized Fourier transform fit of the experimental SAXS data shown in panel A. The SAXS data recorded for GCase at all concentrations (22, 44, and 88 μM) are strongly indicative of polydispersity within the samples, consistent with a mixture of GCase populations in different multimerization states. When plotted in Guinier coordinates (inset), the data for q2 values exceeding 0.0001 Å−2 show positive curvature of the residuals, typical for polydisperse samples. Regularized inverse Fourier transform of these data via GNOM exhibits high-r tailing (B), also characteristic of polydispersity. When the lowest-q data between 0.01 Å−1 and 0.02 Å−1 are removed, Guinier residuals appear unbiased with a decreased high-q tailing in the P(r) profile. However, radii of gyration extracted from the Guinier plot (46 ± 3 Å) and the P(r) profile (52 ± 4 Å) differ significantly, again indicating sample polydispersity. Based on the smaller calculated radius of gyration (25.4 Å) for the x-ray structure of GCase (PDB code 1OGS) including glycans, monomeric GCase cannot be the dominant species under these solution conditions. Solution X-ray scattering data were collected on samples of GCase (0.13, 0.27, and 0.53 mg/mL in 50 mM MES pH 5.5, 100 mM NaCl, 2 mM TCEP) at the Beamline 12-IDC at the Advanced Photon Source (Argonne National Laboratory, Argonne, IL). Data were collected using a Gold CCD detector positioned 3 m from the sample capillary. Incident radiation with an energy of 18 keV was used, resulting in observable q-ranges of 0.007–0.22 A−1. Q-axis mapping was done via scattering from a silver behenate standard sample. A total of 20 sequential data frames with exposure times of 2.0 s were recorded with the samples kept at 25 °C throughout the measurement. To prevent radiation damage, volumes of 120 μL of samples and buffers were oscillated during data collection using a flow-through setup. Individual data frames were masked, corrected for the detector sensitivity, radially integrated, and normalized by the corresponding transmitted beam intensities. The final 1D scattering profiles and their uncertainties were calculated as means and standard deviations over the 20 individual frames. Gyration radii of PDB coordinates were calculated as the root mean square distance of all non-hydrogen atoms to the centroid, where the centroid is the average position of all non-hydrogen atoms.
Fig. S2. Sap C NMR spectra, chemical shift perturbations, and intensity reduction due to GCase interaction. (A) Overlaid 15N HSQC spectra of 38 μM Sap C alone (black) and in the presence of 33 μM GCase (red). (B) Sap C backbone amide intensity reduction due to GCase interaction. (C) Chemical shift perturbations of the Sap C backbone amides due to GCase interaction. The 15N HSQC spectrum in the presence of GCase shows weaker signals (B), with very small chemical shift perturbations (C) and only a slight broadening in signal linewidth (average 1H linewidth: 14.7 Hz free, 16.1 Hz with GCase present). The significant signal reduction with slight broadening is consistent with Sap C exchanging between free and bound states on the timescale of the individual NMR scans, roughly 0.1–1 s. Because GCase is large (60 kDa), NMR signals of bound Sap C are broadened due to slow molecular tumbling and are too weak to be detectable by standard solution NMR techniques. The NMR signals that are seen arise from Sap C in the free state plus a fraction of interacting Sap C which is unbound sufficiently long during the NMR scan to be detectable, leading to the observed slight broadening of the signals. Amide chemical shift perturbations were calculated as Δδ = sqrt((ΔδH2 +(ΔδN/5)2)/2) where ΔδH and ΔδN are the perturbations in the 1H and 15N chemical shifts, respectively. Sap C for the samples was purified from E. coli BL21(DE3) cell culture grown in D2O M9 minimal medium containing ampicillin (100 μg/mL), 0.3 g/L 2H/15N Isogro (Sigma-Aldrich), 1 g/L 15NH4Cl, and 3 g/L D7,12C6-D-glucose (Cambridge Isotope Laboratories, Inc.), IPTG-induced and harvested by standard procedure. Cells were resuspended in 100 mM Tris pH 8 buffer containing 300 mM NaCl, 1 mM EDTA, and 1 mM PMSF and lysed by a 10-min heat treatment in a boiling water bath. The lysate supernatant was dialyzed overnight against 20 mM Tris and 0.5 mM EDTA (pH 8) and purified using a HiPrep 16/10 Q FF column (GE Healthcare), eluted by NaCl gradient, and purified further by gel filtration chromatography using a HiLoad 16/60 Superdex 75 prep grade column. 1D 1H NMR spectra of the buffer exchanged (50 mM NaOAc, 100mM NaCl pH 5) samples showed no proton-containing contaminants with peak heights greater than 1% that of the acetate peak, with the largest corresponding to glycerol.
Fig. S3. Human and consensus sequences of Sap C. The N-terminal halves of the human and consensus Sap C sequences are shown upside-down below, and the C-terminal halves above, with the termini labeled. The outside sequence shows human Sap C with charged (blue and red denote positive and negative side chains, respectively) and hydrophobic (green) residues highlighted. The lines above the sequence indicate the backbone amides in contact with GCase. The first glycine at the N-terminus is not present in wild-type human Sap C. The Sap C glycosylation site Asn22 is indicated, though this study used non-glycosylated, recombinant Sap C. Inside the human sequence is the consensus sequence for animal Sap C with exposed side chains in orange and those with > 70% conservation in upper case. The four helical regions are indicated by bars, using the same coloring as Figure 1B. The first half of Sap C is not critical for GCase activity enhancement despite three disulfide linkages (black dashed lines) between the first and second halves of Sap C. Of the Sap C residues that interact with GCase, Glu65 and Leu75 are the most highly conserved, though for Leu75 only the backbone is exposed. While humans have glutamate residues in positions 64 and 65, most animals have Gln64 and Glu65. Birds and reptiles are an exception; they have alanine in position 65 and have glutamate in position 64. The sequence comparison suggests that having at least one glutamate in either position 64 or 65 could be important for GCase binding.
Fig. S4. Saturation cross-transfer from GCase to α-syn. Normalized, corrected saturation cross-transfer backbone amide intensities (I′Sat/I′OR) are shown for α-syn (50 μM) in the presence of 20 μM (dark purple) and 10 μM (light purple) GCase.
Fig. S5. Dimeric forms of GCase predicted for the 1OGS PDB structure by PISA. Dimer with interface I (A), interface II (B), and interface III (C). Interface I (A) is predicted for 13 of the 15 structures GCase structures analyzed, and this interface has the lowest predicted free energy on average. Two other interfaces, designated II (B) and III (C), are also predicted for 9 and 5 of the structures, respectively, both with the active sites exposed. The interfaces predicted to be stable are present in the asymmetric units of the respective crystal structures, consistent with the proposal that these interfaces might not just be due to crystal packing. Interfaces II and III also involve contacts with N-glycosylation sites (denoted by * in (B) and (C)), which could potentially interfere with multimerization and make these less likely. For interface I, all glycosylation sites lie away from the interface and are fully exposed. Note that taliglucerase, the plant-cell produced version of human GCase, has nine additional residues at its termini and altered glycans; however, neither termini nor glycans lie near interface I. The GCase surfaces are colored pink for the catalytic TIM-barrel domain and blue for the N- and C-termini β-sheet domains. The surface for all atoms < 10 Å from the catalytic glutamates 235 and 340 is colored red and colored green for all atoms < 10 Å from the cleft residue N370. The N370S mutation is known to weaken α-syn binding to GCase, and since α-syn and Sap C compete for binding, it is possible that N370 lies near the Sap C binding site. Glycosylation sites are colored yellow. In panels B and C, glycosylation sites near the interface are indicated with the orange asterisk, Asn59 for interface II and Asn19 for interface III. Glycosylation site, Asn146, also lies near interface III, but is not visible in this view.
Highlights.
Glucocerebrosidase exists in multimeric states in solution
Putative dimer/multimer interface involves the active site
Binding of C-terminal residues of Saposin C stabilizes glucocerebrosidase monomer
Dimer dissociation by Saposin C likely due to binding near enzymatic active site
Acknowledgments
This work was supported by the Intramural Research Program at the National Institutes of Health, National Heart, Lung, and Blood Institute (NHLBI), National Institute of Diabetes and Digestive and Kidney Diseases (NIDDK), and the National Human Genome Research Institute (NHGRI). Recombinant GCase was a gift from Protalix Biotherapeutics (Carmiel, Israel). The Sap C plasmid was provided by Gilbert Privé (University of Toronto, Toronto, ON). We thank Nico Tjandra (NHLBI) for his advice regarding the NMR experiments and the use of NMR spectrometers, and Duck-Yeon Lee (NHLBI Biochemistry Core Facility) for his assistance with the mass spectrometry and analysis. We thank S. Seifert and X. Zuo for assistance with SAXS data collection and gratefully acknowledge use of the Advanced Photon Source, supported by the U.S. Department of Energy, contract No. W-31-109-ENG-38, and the shared scattering beamline resource allocated under the PUP-77 agreement between NCI, NIH, and the Argonne National Laboratory.
Abbreviations
- GCase
glucocerebrosidase
- GluCer
glucosylceramide
- GD
Gaucher disease
- PD
Parkinson disease
- α-syn
α-synuclein
- Sap C
saposin C
- AUC
analytical ultracentrifugation ITC, isothermal titration calorimetry
- NMR
nuclear magnetic resonance
- NaOAc
sodium acetate
- PDB
Protein Data Bank
Footnotes
Publisher's Disclaimer: This is a PDF file of an unedited manuscript that has been accepted for publication. As a service to our customers we are providing this early version of the manuscript. The manuscript will undergo copyediting, typesetting, and review of the resulting proof before it is published in its final citable form. Please note that during the production process errors may be discovered which could affect the content, and all legal disclaimers that apply to the journal pertain.
References
- 1.Sidransky E, Nalls MA, Aasly JO, et al. Multicenter analysis of glucocerebrosidase mutations in Parkinson's disease. N Engl J Med. 2009;361:1651–1661. doi: 10.1056/NEJMoa0901281. [DOI] [PMC free article] [PubMed] [Google Scholar]
- 2.Westbroek W, Gustafson AM, Sidransky E. Exploring the link between glucocerebrosidase mutations and parkinsonism. Trends Mol Med. 2011;17:485–493. doi: 10.1016/j.molmed.2011.05.003. [DOI] [PMC free article] [PubMed] [Google Scholar]
- 3.McGlinchey RP, Lee JC. Emerging insights into the mechanistic link between α-synuclein and glucocerebrosidase in Parkinson's disease. Biochem Soc Trans. 2013;41:1509–1512. doi: 10.1042/BST20130158. [DOI] [PMC free article] [PubMed] [Google Scholar]
- 4.Cullen V, Sardi SP, Ng J, et al. Acid β-glucosidase mutants linked to Gaucher disease, Parkinson disease, and Lewy body dementia alter α-synuclein processing. Ann Neurol. 2011;69:940–953. doi: 10.1002/ana.22400. [DOI] [PubMed] [Google Scholar]
- 5.Mazzulli JR, Xu YH, Sun Y, et al. Gaucher disease glucocerebrosidase and α-synuclein form a bidirectional pathogenic loop in synucleinopathies. Cell. 2011;146:37–52. doi: 10.1016/j.cell.2011.06.001. [DOI] [PMC free article] [PubMed] [Google Scholar]
- 6.Sardi SP, Clarke J, Kinnecom C, et al. CNS expression of glucocerebrosidase corrects α-synuclein pathology and memory in a mouse model of Gaucher-related synucleinopathy. Proc Natl Acad Sci U S A. 2011;108:12101–12106. doi: 10.1073/pnas.1108197108. [DOI] [PMC free article] [PubMed] [Google Scholar]
- 7.Yap TL, Gruschus JM, Velayati A, et al. α-Synuclein interacts with Glucocerebrosidase providing a molecular link between Parkinson and Gaucher diseases. J Biol Chem. 2011;286:28080–28088. doi: 10.1074/jbc.M111.237859. [DOI] [PMC free article] [PubMed] [Google Scholar]
- 8.Yap TL, Velayati A, Sidransky E, et al. Membrane-bound α-synuclein interacts with glucocerebrosidase and inhibits enzyme activity. Mol Genet Metab. 2013;108:56–64. doi: 10.1016/j.ymgme.2012.11.010. [DOI] [PMC free article] [PubMed] [Google Scholar]
- 9.Sidransky E, Hart PS. Penetrance of PD in glucocerebrosidase gene mutation carriers. Neurology. 2012;79:106–107. doi: 10.1212/01.wnl.0000416261.29035.4c. [DOI] [PubMed] [Google Scholar]
- 10.Kolter T, Sandhoff K. Principles of lysosomal membrane digestion: stimulation of sphingolipid degradation by sphingolipid activator proteins and anionic lysosomal lipids. Annu Rev Cell Dev Biol. 2005;21:81–103. doi: 10.1146/annurev.cellbio.21.122303.120013. [DOI] [PubMed] [Google Scholar]
- 11.Tamargo RJ, Velayati A, Goldin E, et al. The role of saposin C in Gaucher disease. Mol Genet Metab. 2012;106:257–263. doi: 10.1016/j.ymgme.2012.04.024. [DOI] [PMC free article] [PubMed] [Google Scholar]
- 12.Matsuda J, Kido M, Tadano-Aritomi K, et al. Mutation in saposin D domain of sphingolipid activator protein gene causes urinary system defects and cerebellar Purkinje cell degeneration with accumulation of hydroxy fatty acid-containing ceramide in mouse. Hum Mol Genet. 2004;13:2709–2723. doi: 10.1093/hmg/ddh281. [DOI] [PubMed] [Google Scholar]
- 13.Alattia JR, Shaw JE, Yip CM, et al. Molecular imaging of membrane interfaces reveals mode of β-glucosidase activation by saposin C. Proc Natl Acad Sci U S A. 2007;104:17394–17399. doi: 10.1073/pnas.0704998104. [DOI] [PMC free article] [PubMed] [Google Scholar]
- 14.Vaccaro AM, Tatti M, Ciaffoni F, et al. Effect of saposins A and C on the enzymatic hydrolysis of liposomal glucosylceramide. J Biol Chem. 1997;272:16862–16867. doi: 10.1074/jbc.272.27.16862. [DOI] [PubMed] [Google Scholar]
- 15.Qi XY, Grabowski GA. Acid β-glucosidase: Intrinsic fluorescence and conformational changes induced by phospholipids and saposin C. Biochemistry. 1998;37:11544–11554. doi: 10.1021/bi980785+. [DOI] [PubMed] [Google Scholar]
- 16.Yap TL, Gruschus JM, Velayati A, et al. Saposin C protects glucocerebrosidase against α-synuclein inhibition. Biochemistry. 2013;52:7161–7163. doi: 10.1021/bi401191v. [DOI] [PMC free article] [PubMed] [Google Scholar]
- 17.Deshmukh L, Schwieters CD, Grishaev A, et al. Structure and dynamics of full-length HIV-1 capsid protein in solution. J Am Chem Soc. 2013;135:16133–16147. doi: 10.1021/ja406246z. [DOI] [PMC free article] [PubMed] [Google Scholar]
- 18.Pfefferkorn CM, Lee JC. Tryptophan probes at the α-synuclein and membrane interface. J Phys Chem B. 2010;114:4615–4622. doi: 10.1021/jp908092e. [DOI] [PMC free article] [PubMed] [Google Scholar]
- 19.Zhao H, Ghirlando R, Piszczek G, et al. Recorded scan times can limit the accuracy of sedimentation coefficients in analytical ultracentrifugation. Anal Biochem. 2013;437:104–108. doi: 10.1016/j.ab.2013.02.011. [DOI] [PMC free article] [PubMed] [Google Scholar]
- 20.Schuck P. Size-distribution analysis of macromolecules by sedimentation velocity ultracentrifugation and LAMM equation modeling. Biophys J. 2000;78:1606–1619. doi: 10.1016/S0006-3495(00)76713-0. [DOI] [PMC free article] [PubMed] [Google Scholar]
- 21.Keller S, Vargas C, Zhao H, et al. High-precision isothermal titration calorimetry with automated peak-shape analysis. Anal Chem. 2012;84:5066–5073. doi: 10.1021/ac3007522. [DOI] [PMC free article] [PubMed] [Google Scholar]
- 22.Schuck P. On the analysis of protein self-association by sedimentation velocity analytical ultracentrifugation. Anal Biochem. 2003;320:104–124. doi: 10.1016/s0003-2697(03)00289-6. [DOI] [PubMed] [Google Scholar]
- 23.Nakanishi T, Miyazawa M, Sakakura M, et al. Determination of the interface of a large protein complex by transferred cross-saturation measurements. J Mol Biol. 2002;318:245–249. doi: 10.1016/S0022-2836(02)00018-9. [DOI] [PubMed] [Google Scholar]
- 24.de Alba E, Weiler S, Tjandra N. Solution structure of human saposin C: pH-dependent interaction with phospholipid vesicles. Biochemistry. 2003;42:14729–14740. doi: 10.1021/bi0301338. [DOI] [PubMed] [Google Scholar]
- 25.Weiler S, Kishimoto Y, O'Brien JS, et al. Identification of the binding and activating sites of the sphingolipid activator protein, saposin C, with glucocerebrosidase. Protein Sci. 1995;4:756–764. doi: 10.1002/pro.5560040415. [DOI] [PMC free article] [PubMed] [Google Scholar]
- 26.Blanz J, Groth J, Zachos C, et al. Disease-causing mutations within the lysosomal integral membrane protein type 2 (LIMP-2) reveal the nature of binding to its ligand β-glucocerebrosidase. Hum Mol Genet. 2010;19:563–572. doi: 10.1093/hmg/ddp523. [DOI] [PubMed] [Google Scholar]
- 27.Maret A, Potier M, Salvayre R, et al. In vitro detergent activation of lysosomal acid β-glucosidase in the spleen of normal and type-1 Gaucher patients is not accompanied by change in aggregation state. Biochim Biophys Acta. 1989;996:254–256. doi: 10.1016/0167-4838(89)90255-0. [DOI] [PubMed] [Google Scholar]
- 28.Qi X, Qin W, Sun Y, et al. Functional organization of saposin C. Definition of the neurotrophic and acid β-glucosidase activation regions. J Biol Chem. 1996;271:6874–6880. doi: 10.1074/jbc.271.12.6874. [DOI] [PubMed] [Google Scholar]
- 29.Alattia JR, Shaw JE, Yip CM, et al. Direct visualization of saposin remodelling of lipid bilayers. J Mol Biol. 2006;362:943–953. doi: 10.1016/j.jmb.2006.08.009. [DOI] [PubMed] [Google Scholar]
- 30.Krissinel E, Henrick K. Inference of macromolecular assemblies from crystalline state. J Mol Biol. 2007;372:774–797. doi: 10.1016/j.jmb.2007.05.022. [DOI] [PubMed] [Google Scholar]
Associated Data
This section collects any data citations, data availability statements, or supplementary materials included in this article.
Supplementary Materials
Fig. S1. Small-angle X-ray scattering (SAXS) results for GCase. (A) Experimental SAXS data is shown for 44 μM GCase. The inset shows Guinier fit (red line) of the lowest-q data (filled symbols) up to qmax*Rgyr = 1.3. Fit residual (experimental minus calculated) is shown on top of the inset with red horizontal line indicating zero. (B) Distribution of the inter-atomic distances within the scattering particle obtained via regularized Fourier transform fit of the experimental SAXS data shown in panel A. The SAXS data recorded for GCase at all concentrations (22, 44, and 88 μM) are strongly indicative of polydispersity within the samples, consistent with a mixture of GCase populations in different multimerization states. When plotted in Guinier coordinates (inset), the data for q2 values exceeding 0.0001 Å−2 show positive curvature of the residuals, typical for polydisperse samples. Regularized inverse Fourier transform of these data via GNOM exhibits high-r tailing (B), also characteristic of polydispersity. When the lowest-q data between 0.01 Å−1 and 0.02 Å−1 are removed, Guinier residuals appear unbiased with a decreased high-q tailing in the P(r) profile. However, radii of gyration extracted from the Guinier plot (46 ± 3 Å) and the P(r) profile (52 ± 4 Å) differ significantly, again indicating sample polydispersity. Based on the smaller calculated radius of gyration (25.4 Å) for the x-ray structure of GCase (PDB code 1OGS) including glycans, monomeric GCase cannot be the dominant species under these solution conditions. Solution X-ray scattering data were collected on samples of GCase (0.13, 0.27, and 0.53 mg/mL in 50 mM MES pH 5.5, 100 mM NaCl, 2 mM TCEP) at the Beamline 12-IDC at the Advanced Photon Source (Argonne National Laboratory, Argonne, IL). Data were collected using a Gold CCD detector positioned 3 m from the sample capillary. Incident radiation with an energy of 18 keV was used, resulting in observable q-ranges of 0.007–0.22 A−1. Q-axis mapping was done via scattering from a silver behenate standard sample. A total of 20 sequential data frames with exposure times of 2.0 s were recorded with the samples kept at 25 °C throughout the measurement. To prevent radiation damage, volumes of 120 μL of samples and buffers were oscillated during data collection using a flow-through setup. Individual data frames were masked, corrected for the detector sensitivity, radially integrated, and normalized by the corresponding transmitted beam intensities. The final 1D scattering profiles and their uncertainties were calculated as means and standard deviations over the 20 individual frames. Gyration radii of PDB coordinates were calculated as the root mean square distance of all non-hydrogen atoms to the centroid, where the centroid is the average position of all non-hydrogen atoms.
Fig. S2. Sap C NMR spectra, chemical shift perturbations, and intensity reduction due to GCase interaction. (A) Overlaid 15N HSQC spectra of 38 μM Sap C alone (black) and in the presence of 33 μM GCase (red). (B) Sap C backbone amide intensity reduction due to GCase interaction. (C) Chemical shift perturbations of the Sap C backbone amides due to GCase interaction. The 15N HSQC spectrum in the presence of GCase shows weaker signals (B), with very small chemical shift perturbations (C) and only a slight broadening in signal linewidth (average 1H linewidth: 14.7 Hz free, 16.1 Hz with GCase present). The significant signal reduction with slight broadening is consistent with Sap C exchanging between free and bound states on the timescale of the individual NMR scans, roughly 0.1–1 s. Because GCase is large (60 kDa), NMR signals of bound Sap C are broadened due to slow molecular tumbling and are too weak to be detectable by standard solution NMR techniques. The NMR signals that are seen arise from Sap C in the free state plus a fraction of interacting Sap C which is unbound sufficiently long during the NMR scan to be detectable, leading to the observed slight broadening of the signals. Amide chemical shift perturbations were calculated as Δδ = sqrt((ΔδH2 +(ΔδN/5)2)/2) where ΔδH and ΔδN are the perturbations in the 1H and 15N chemical shifts, respectively. Sap C for the samples was purified from E. coli BL21(DE3) cell culture grown in D2O M9 minimal medium containing ampicillin (100 μg/mL), 0.3 g/L 2H/15N Isogro (Sigma-Aldrich), 1 g/L 15NH4Cl, and 3 g/L D7,12C6-D-glucose (Cambridge Isotope Laboratories, Inc.), IPTG-induced and harvested by standard procedure. Cells were resuspended in 100 mM Tris pH 8 buffer containing 300 mM NaCl, 1 mM EDTA, and 1 mM PMSF and lysed by a 10-min heat treatment in a boiling water bath. The lysate supernatant was dialyzed overnight against 20 mM Tris and 0.5 mM EDTA (pH 8) and purified using a HiPrep 16/10 Q FF column (GE Healthcare), eluted by NaCl gradient, and purified further by gel filtration chromatography using a HiLoad 16/60 Superdex 75 prep grade column. 1D 1H NMR spectra of the buffer exchanged (50 mM NaOAc, 100mM NaCl pH 5) samples showed no proton-containing contaminants with peak heights greater than 1% that of the acetate peak, with the largest corresponding to glycerol.
Fig. S3. Human and consensus sequences of Sap C. The N-terminal halves of the human and consensus Sap C sequences are shown upside-down below, and the C-terminal halves above, with the termini labeled. The outside sequence shows human Sap C with charged (blue and red denote positive and negative side chains, respectively) and hydrophobic (green) residues highlighted. The lines above the sequence indicate the backbone amides in contact with GCase. The first glycine at the N-terminus is not present in wild-type human Sap C. The Sap C glycosylation site Asn22 is indicated, though this study used non-glycosylated, recombinant Sap C. Inside the human sequence is the consensus sequence for animal Sap C with exposed side chains in orange and those with > 70% conservation in upper case. The four helical regions are indicated by bars, using the same coloring as Figure 1B. The first half of Sap C is not critical for GCase activity enhancement despite three disulfide linkages (black dashed lines) between the first and second halves of Sap C. Of the Sap C residues that interact with GCase, Glu65 and Leu75 are the most highly conserved, though for Leu75 only the backbone is exposed. While humans have glutamate residues in positions 64 and 65, most animals have Gln64 and Glu65. Birds and reptiles are an exception; they have alanine in position 65 and have glutamate in position 64. The sequence comparison suggests that having at least one glutamate in either position 64 or 65 could be important for GCase binding.
Fig. S4. Saturation cross-transfer from GCase to α-syn. Normalized, corrected saturation cross-transfer backbone amide intensities (I′Sat/I′OR) are shown for α-syn (50 μM) in the presence of 20 μM (dark purple) and 10 μM (light purple) GCase.
Fig. S5. Dimeric forms of GCase predicted for the 1OGS PDB structure by PISA. Dimer with interface I (A), interface II (B), and interface III (C). Interface I (A) is predicted for 13 of the 15 structures GCase structures analyzed, and this interface has the lowest predicted free energy on average. Two other interfaces, designated II (B) and III (C), are also predicted for 9 and 5 of the structures, respectively, both with the active sites exposed. The interfaces predicted to be stable are present in the asymmetric units of the respective crystal structures, consistent with the proposal that these interfaces might not just be due to crystal packing. Interfaces II and III also involve contacts with N-glycosylation sites (denoted by * in (B) and (C)), which could potentially interfere with multimerization and make these less likely. For interface I, all glycosylation sites lie away from the interface and are fully exposed. Note that taliglucerase, the plant-cell produced version of human GCase, has nine additional residues at its termini and altered glycans; however, neither termini nor glycans lie near interface I. The GCase surfaces are colored pink for the catalytic TIM-barrel domain and blue for the N- and C-termini β-sheet domains. The surface for all atoms < 10 Å from the catalytic glutamates 235 and 340 is colored red and colored green for all atoms < 10 Å from the cleft residue N370. The N370S mutation is known to weaken α-syn binding to GCase, and since α-syn and Sap C compete for binding, it is possible that N370 lies near the Sap C binding site. Glycosylation sites are colored yellow. In panels B and C, glycosylation sites near the interface are indicated with the orange asterisk, Asn59 for interface II and Asn19 for interface III. Glycosylation site, Asn146, also lies near interface III, but is not visible in this view.