Abstract
Objectives:
To compare the performance of 3 commonly used 25-hydroxyvitamin D (25-OHD) assays among a sample of the Saudi population.
Methods:
This cross-sectional study was carried out between January 2011 and December 2012 at King Fahd Hospital of the University, Al-Khobar, Saudi Arabia. After informed consent, blood samples for measurement of 25-OHD level was extracted from 200 adults. The vitamin D level of each individual were determined using chemiluminescence immunoassay (CLIA), radio-immuno assay (RIA), and liquid chromatography-tandem mass spectrometry (LC-MS/MS) assay. Assays were also compared through commonly used cut-points for classification of vitamin D deficiency. Bias between assays was evaluated using Bland-Altman plots.
Results:
The average age of patients was 45.7±16.1 years. A significant difference between the assays was found. The mean 25-OHD levels were highest for the LC-MS/MS (21.65 ng/mL, 95% CI 19.74-23.56), intermediate for RIA (16.607 ng/mL, 95% CI 14.87-18.32), and lowest for CLIA method (13.864 ng/mL, 95% CI 12.109-15.618). Using 30 ng/mL as a cutoff value, only 6% was found to have normal levels of 25-OHD using CLIA, 9% using RIA, and 22% using LC-MS/MS.
Conclusion:
Levels of 25-OHD and the prevalence of vitamin D deficiency are dependent on the assay used. The reported high prevalence of hypovitaminosis D among the Saudi population can be partially explained by the use of assays that underestimate vitamin D levels.
Vitamin D deficiency has been known for a long time to cause skeletal diseases such as rickets in children, and osteomalacia in adults.1 Apart from its importance in the management of osteoporosis, lately it was recognized that an association exists between vitamin D deficiency and many acute and chronic illnesses such as cancer, type 1 and type 2 diabetes mellitus, hypertension, cardiovascular diseases, infectious diseases, autoimmune diseases, and depression.2-7 With the improved understanding of the risks of vitamin D deficiency, more attention for the evaluation of vitamin D status has been undertaken and the clinical demand for assessment of vitamin D status has rapidly increased. In general, measurement of 25-hydroxyvitamin D (25-OHD) level in serum or plasma is accepted as a reliable indicator of vitamin D status, but assay technology needs to be able to measure both D2 and D3 metabolites. Thresholds of serum 25-OHD concentration to define vitamin D deficiency are highly debated, but there is a consensus agreement that vitamin D sufficiency should be defined as 25-OHD level of >75 nmol/L (>30ng/ml), insufficiency as 50-75 nmol/L (20-30 ng/ml), and deficiency as <50 nmol/L (<20 ng/ml).8 These deficiencies are widespread and it is higher in the elderly and hospitalized population.9,10 Studies from Saudi Arabia revealed a varying prevalence of vitamin D deficiency (50-100%) in all age groups.11-14 This high variability of prevalence in the same ethnic group raises the questions of reliability and accuracy of the 25-OHD assays used. With the recognized epidemic of hypovitaminosis D worldwide, it became imperative to accurately assess circulating levels of 25-OHD. However, the issue of substantial variability among different assays make clinical assessment of the vitamin D status of an individual patient problematic.15,16 Binkley et al17 reported that it is less appreciated that the assays, which are used to measure levels of 25-OHD may yield discrepant results, and they were the first to drew attention of the clinical community to the large variability in 25-OHD results both between methods and between laboratories. Several assays are being used for the measurement of vitamin D in serum or plasma including competitive binding assay, different manual and automated immunoassays, high-performance liquid chromatography (HPLC), and the lately developed liquid chromatography-tandem mass spectrometry (LC-MS/MS) assay, which was found to be the most accurate and is currently considered the gold standard method for the assessment of 25OHD level.18,19 King Fahd Hospital of the University, Al-Khobar, Saudi Arabia laboratory uses the chemiluminescence immunoassay (CLIA) method to assess levels of 25-OHD, and we hypothesized that such an assay is overestimating the prevalence of hypovitaminosis D. The objective of this study is to compare the performance of the CLIA assay method used at our hospital with the radio-immuno assay (RIA) and the LCMS/MS assay methods among a sample of the Saudi population.
Methods
This cross-sectional study was carried out between January 2011 and December 2012 using a convenient available sample. The study protocol was approved by the ethical committee of the University of Dammam, Dammam, Saudi Arabia. The research was funded by the Deanship of Scientific Research University of Dammam, and as per University policy of the University, the study was carried out as per the principles of the Helsinki Declaration. Prior to collection of blood samples, a search of the data sources was made, which included the Cochrane Central Register of Controlled Trials and Cochrane Database of Systematic Reviews, EMBASE, MEDLINE, and the Science Citation Index, for different vitamin D assays and their reliability. All participants gave an informed consent to participate and to provide a blood sample. A total of 200 adult individuals consisting of 50 males and 150 females were recruited. Adult male and female Saudi patients aged 18 years or older who attended the orthopedic, endocrinology, or obstetrics-gynecology clinics during the study period were invited to participate. Exclusion criteria were as follow: the presence of organ failure or disease that affects vitamin D metabolism, use of vitamin D supplements, or use of medications that alter vitamin D metabolism and refusal to consent for the study. A data collection sheet was used to collect information such as age, gender, disease conditions, medications used, dietary habits, and history of osteoporosis or fracture.
Biochemical analyses
Venous blood samples were collected after an overnight fast for the assessment of serum calcium, phosphorus, alkaline phosphatase, parathormone, and 25-OHD levels. Vitamin D samples were protected from light and stored at -20°C until analysis. Measurements of 25-OHD level were performed using a 3 different assay methods.
Chemiluminescence immunoassay
Chemiluminescence immunoassay was carried out by the Department of Special Clinical Chemistry at King Fahd Hospital of the University, Al-Khobar using DiaSorin (Liaison®, Saluggia, Italy) analyzer. During the first incubation, 25-OHD was dissociated from the binding protein and was binded to the specific antibody on the solid phase. At the end of 10 minutes, vitamin D that linked to the tracer was added and incubated for another 10 minutes. The unbound tracer was washed and the starter reagents were added to initiate the chemiluminescence reaction. The light signal was measured by photomultiplier as relative light units (RLU) and was inversely proportional to the concentration of 25OHD present in calibrator control, or study sample. Chemiluminescence immunoassay is a direct competitive CIA for quantitative determination of total 25-OHD in serum. It is a popular assay method and accounted for 36% of the sample returned during the year 2009 carried out by the External Quality Assessment Scheme for vitamin D metabolites (DEQAS).20 The sample analysis during the year 2012 carried out by the DEQAS revealed run-to-run coefficients of variation (CVs) in the range of 9.6-13.7%.21
Radio-immuno assay
Plasma samples were analyzed using Gamma-B, 25-hydroxyvitamin D RIA (IDS, Boldon, UK) according to the manufacturer’s instructions. Briefly, after following centrifugation a proportion of the supernatant were incubated with 125I-labelled 25-OHD tracer and sheep antibody to 25-OHD. Antibody-bound 125I-labelled 25-OHD was separated using antisheep IgG cellulose followed by centrifugation and decanting. Concentration of 25-OHD is inversely proportional to the bound radioactivity. To establish analytic quality standards, controls and samples were analyzed in duplicate and any sample with a coefficient of variation of >10% were reanalyzed for confirmation. The control samples provided by the manufacturer were within the recommended range. The intra-assay precision was <7% and the inter-assay precision was <9% with sensitivity of -3 nmol/L.
Liquid chromatography-tandem mass spectrometry
The third method used to measure 25-OHD levels in this study was LC-MS/MS, which was carried out at the Quest Diagnostics, Lab One, Ohio, USA using an API 3000 triple-quadrupole mass spectrometer (Applied Biosystems/MDS Sciex, AB Framingham, MA, USA) following the guidelines by the US National Institute of Standards and Technology (NIST). Sample analysis was performed according to the manufacturer’s instructions. Briefly, initial extraction was carried out via protein precipitation followed by separation using the HPLC method, then, detection and quantification was carried out via tandem mass spectrometry. Concentration of both 25-OHD3 and 25-OHD2 were used to calculate the total 25-OHD levels. Analytical sensitivity was 4ng/ml and the reportable range for total 25-OHD was 4-1024ng/ml.
Statistical analysis
Regression analysis and Bland-Altman plots were used for comparison between assays. Bland-Altman plots were also used to identify mean bias and the 95% limits of agreement between assays. Vitamin D level was classified as follows: vitamin D sufficiency defined as 25OHD level of ≥75 nmol/L (≥30ng/mL), insufficiency as 50-75nmol/L (20-30ng/mL), and deficiency as ≤50nmol/L (≤20ng/mL). Statistical analysis was performed using the Statistical Package for Social Sciences software, version 14.0 (SPSS Inc, Chicago, IL, USA). Data was presented as a mean±standard deviation (SD). The mean serum 25-OHD values with 95% confidence intervals (CI) for each assay results were calculated, and a p-value of <0.05 was considered as significant.
Results
A total of 200 participants with an average age of 45.7±16.1 years, consisting of 50 males (48.1±17.1 years) and 150 females (44.8±15.7 years) were included. Baseline demographic data of the participants with the mean and ranges of their different variables is given in Table 1. The findings revealed a low inter-assay agreement regarding the level of 25-OHD (Figure 1). The mean 25-OHD levels came to be highest for the LC-MS/MS (21.65ng/mL, 95% CI: 19.74-23.56), intermediate for the RIA (16.607 ng/mL, 95% CI: 14.87-18.32) and lowest for the CLIA (13.864 ng/mL, 95% CI 12.109-15.618) (p<0.05). There were also considerable differences between the 3 methods in proportion of participants classified as having low vitamin D. Using a 30mg/mL as a cut-off value for normal 25OHD, 6% were found to have normal levels using CLIA, 9% using RIA, and 22% using LCMS/MS. Analysis also showed that 57.3% of subjects had vitamin D deficiency using the LCMS/MS compared with 80.8% using the CLIA. Linear regression analysis was used to analyze the relationship between absolute differences in serum values between the methods against the mean of the 2 values in order to assess the variability at different serum level of 25OHD. The result revealed that beta coefficient of the regression of difference in CLIA versus RIA on mean of CLIA versus RIA was significant, beta coefficient of the regression of difference in CLIA versus LC-MS/MS on mean of CLIA versus LC-MS/MS was significant, and the beta coefficient of the regression of difference in RIA versus LC-MS/MS on mean of RIA versus LC-MS/MS was also significant (Table 2). The estimated parameters were negative and there were no statistically significant differences found, which indicates that the difference in variation between the methods were higher while the serum 25OHD level decreases (Table 2). The correlation of CLIA with LC-MS/MS was low (R2=0.53), which is much lower than the correlation between RIA and LC-MS/MS (R2=0.87). The correlation between CLIA and RIA is also very low (R2=0.46). The assay bias was evaluated using Bland-Altman plots (Figures 2-4). The formula used to calculate the 95% CI was CI=mean ±1.96 SD. Figure 2 shows the bias between CLIA and RIA. The mean bias for CLIA-RIA is +20.2 with upper limit of 57.0 and lower limit of -16.7. The mean value lies between the upper and lower limit. The bias between CLIA and LCMS/MS is shown in Figure 3. The mean bias for CLIA-LCMS/MS was +27.7 with upper limit of 68.5 and lower limit of -13.0. The mean value lies between the upper and lower limit, while the bias between RIA and LCMS/MS is shown in Figure 4. The mean bias for RIA-LCMS/MS was +24.2 and the upper limit was 53.5 and the lower limit was -5.1.
Table 1.
Baseline characteristics and mean 25-hydroxyvitamin D values among 200 adults.
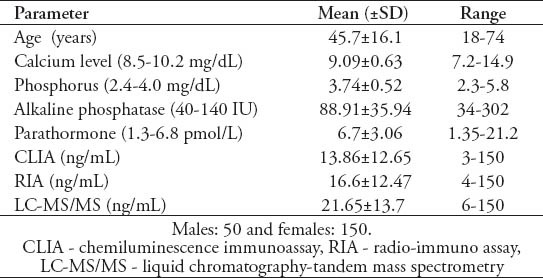
Figure 1.
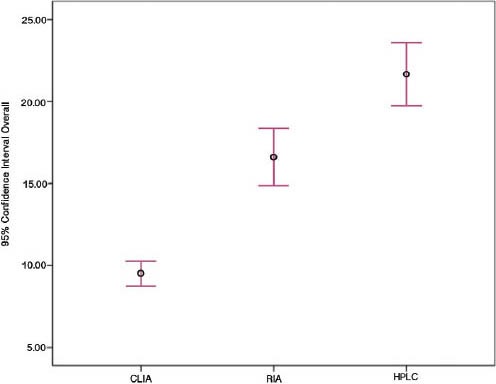
Inter assay relationship between CLIA, RIA, and LCMS/MS. CLIA - chemiluminescence immunoassay, RIA - radio-immuno assay, LC-MS/MS - liquid chromatography-tandem mass spectrometry, HPLC - high-pressure liquid chromatography
Table 2.
Linear regression analyses for the relationship between the absolute differences in CLIA, RIA, and LCMS/MS against the mean of CLIA, RIA and LCMS/MS.

Figure 2.
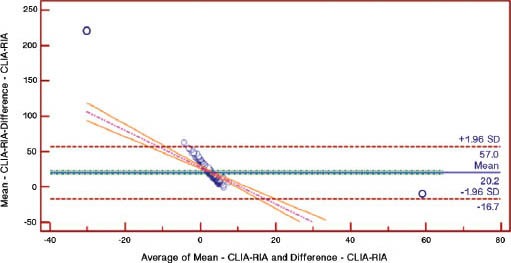
Bland-Altman plot for CLIA-RIA. CLIA - chemiluminescence immunoassay, RIA - radio-immuno assay
Figure 4.
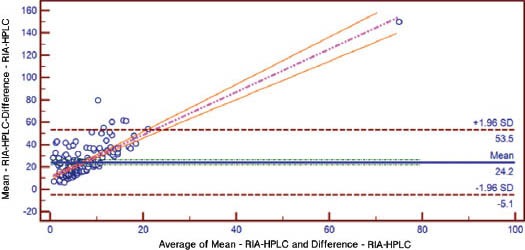
Bland-Altman plot for RIA-LCMS/MS. RIA - radio-immuno assay, LC-MS/MS - liquid chromatography-tandem mass spectrometry
Figure 3.
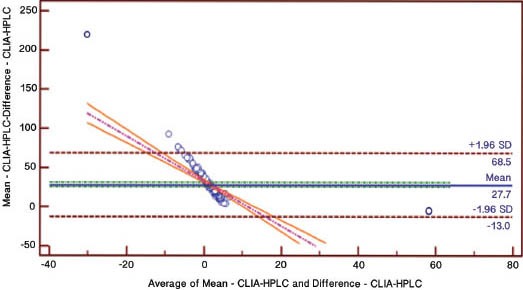
Bland-Altman plot for CLIA-LCMS/MS. CLIA - chemiluminescence immunoassay, LC-MS/MS - liquid chromatography-tandem mass spectrometry, HPLC - high performance liquid chromatography
Discussion
As a result of increased interest in the role of vitamin D in general health, the use of vitamin D testing has grown in recent years. Several assays have been developed for the measurement of vitamin D, and laboratories have started to use quick, easy, less time consuming, and less accurate automated assays instead of the more accurate but labor intensive methodology. Evaluation of the recently established automated assays showed variability of performance with wider CVs, inaccuracy of the results, failure to achieve minimal performance goals, poor cross-reactivity with 25-OHD2, and interference from heterophilic antibodies.21 This raised concerns regarding reliability of the reported results and the validity of inter-laboratory comparisons.20,22 DiaSorin (LIAISON®) vitamin D assay an automated CLIA methodology is the most commonly used commercial platform among laboratories participating in the DEQAS.23 The manufacturer’s kit insert suggests a recovery of 100% for 25-OHD3 and 75% for 25-OHD2; however, DEQAS reported in 2005 a recovery of 54.2% for 25-OHD3 and 29.1% for 25-OHD2.24 The CLIA is also the only method used by most of the laboratories in Saudi Arabia, and it is also the method used at our hospital to assess vitamin D status. In this study, we observed high variability between CLIA, RIA, and LC-MS/MS assays. The mean 25-OHD level for the study population reported by CLIA was significantly lower than the mean 25-OHD level reported by LC-MS/MS (13.86±12.65ng/ml versus 21.65±13.7ng/ml) and it was significantly lower than the reported level by RIA methodology. Although this study was not designed to evaluate the prevalence of hypovitaminosis D, we found that the number of subjects with normal vitamin D level was the highest when using the LC-MS/MS assay method and the number of subjects diagnosed with vitamin D deficiency by CLIA method was higher than the number of subjects diagnosed by LC-MS/MS (80.8% versus 57.3%), which indicates that the CLIA method clearly overestimates the number of individuals with 25-OHD concentration <50nmol/L (<20ng/ml) as compared with the LC-MS/MS assay method. The LC-MS/MS is currently considered the best method for evaluation of 25-OHD levels because to the extract procedure ensures that both free and protein bound 25-OHD are quantified, and it can separate and accurately quantitate both 25-OHD2 and 25-OHD3.25 Several studies used the LC-MS/MS as the gold standard method during evaluation of other assay procedures.26-28 However, the instrument is expensive and the systems require specialized expertise.
The precision for CLIA assay was reported by Harrison et al29 to be consistently poor. Moon et al27 found that the number of subjects with 25-OHD concentration <50 nmol/L by LC-MS/MS was 44.6% compared with 52.2% by CLIA (LIAISON®). Snellman et al29 on reported 204 twins, and found that 8% of the subjects were insufficient using HPLC-APCI-MS, 22% by RIA and 43% by CLIA. While, Lai et al30 studied 813 patients used DiaSorin (LIAISON®) analyzer for CLIA at 2 different laboratories (laboratories A and B) and found that 46% (355/765) were classified as vitamin D deficient using CLIA compared with 17% (128/765) using LC-MS/MS at laboratory A, and 36% (76/209) versus 20% (41/209) for laboratory B indicating that one in 3 patients who were tested were misclassified by CLIA methodology as having deficiency of vitamin D. Their findings also indicated that the variability in vitamin D level is existing not only between assays, also between laboratories. Within assay and between assay variability in measurements of 25-OHD levels were also reported by previous studies.31,32 Linear regression analysis from this study revealed that parameters estimates are negative and highly statistically significantly different from zero, which indicates that the difference in variation between the methods were higher as the serum 25-OHD level decreases, and as most of our patients had low 25OHD levels, the variations is exaggerated. Contrary to our findings, Snellman et al29 found the parameters estimate to be positive, and in their study the difference in variation between the methods were higher as the serum 25OHD levels increase. We also found poor correlation between CLIA and both RIA (R2=0.46) and LC-MS/MS (R2=0.53) and, which is different from the finding of other studies where there was an acceptable correlation between CLIA and LC-MS/MS (0.9455).28 Similar to the study conducted by Farrell et al26 we found positive bias when comparing CLIA and RIA with LC-MS/MS. Holmes et al31 found positive bias between CLIA and LC-MS/MS, but negative bias between RIA and LC-MS/MS. Whereas Moon et al27 found negative bias of -13.5% when they compared CLIA with LC-MS/MS. The presence of bias may justify assay specific decision limits and calls for the standardization of the methods used to assess vitamin D and its metabolites.21,32,33 We recommend the standardization of assays should also be implemented in Saudi Arabia.
Our findings suggest that commonly used immunoassays for evaluation of vitamin D status can lead to under-estimation of vitamin D level with over-diagnosing of hypovitaminosis D. The high reported prevalence of vitamin D deficiency in our community is possibly related to the use of such imprecise assays. This implies that some of the patients may be treated inappropriately as the treatment decisions are likely to be influenced substantially by the 25-OHD assay being used.
There are several implications that arise from this study and cannot be ignored. It appears that the assays used to diagnose vitamin D levels, in most if not all over the country, is incorrect and based on these results patients are treated. Due to this fact we urge the medical fraternity to conduct similar studies to ours and make recommendations to appropriate authorities to streamline the diagnostic procedures for vitamin D assessment.
The strength of this study arises from the fact that we compared the commonly used immunoassays with the gold standard method in Saudi Arabia where the prevalence of vitamin D deficiency was reported to be high. However, our study has some limitations including the small sample size, being non-randomized and hospital based, in addition to the fact that not all assays were carried out at a local laboratory.
In conclusion, recently there has been increased interest in the relevance for vitamin D to human heath accompanied by increase demand of vitamin D testing that has led to the use of less precise assays. We found a large variation between the results of the 3 studied assays and the use of CLIA led to underestimation of the vitamin D level and overestimation of the number of subjects with low vitamin D level. We recommend the use of the gold standard LC-MS/MS assay, and we call for a large national community based study of the prevalence of low vitamin D using the gold standard method.
Footnotes
Related Articles.
Alramdhan AM, El-Zubair AG. Poor vitamin D supplementation in infants. Crosssectional study of maternal practices and awareness of vitamin D supplementation in infants in Al-Ahsa, Eastern Saudi Arabia. Saudi Med J 2014; 35: 67-71.
Alsuwadia AO, Farag YM, Al Sayyari AA, Mousa DH, Alhejaili FF, Al-Harbi AS, et al. Prevalence of vitamin D deficiency in Saudi adults. Saudi Med J 2013; 34: 814-818.
Kari JA, Eldesoky SM, Bagdadi OT. Vitamin D insufficiency and treatment with oral vitamin D3 in children with chronic kidney disease. Saudi Med J 2012; 33: 740-744.
References
- 1.Ryan JW, Anderson PH, Turner AG, Morris HA. Vitamin D activities and metabolic bone disease. Clin Chim Acta. 2013;425:148–152. doi: 10.1016/j.cca.2013.07.024. [DOI] [PubMed] [Google Scholar]
- 2.Lips P, van Schoor NM. The effect of vitamin D on bone and osteoporosis. Best Pract Res Clin Endocrinol Metab. 2011;25:585–591. doi: 10.1016/j.beem.2011.05.002. [DOI] [PubMed] [Google Scholar]
- 3.Wacker M, Holick MF. Vitamin D-effects on skeletal and extraskeletal health and the need for supplementation. Nutrients. 2013;5:111–148. doi: 10.3390/nu5010111. [DOI] [PMC free article] [PubMed] [Google Scholar]
- 4.Genc DB, Ozkan MA, Buyukgebiz A. Vitamin D in childhood cancer: a promising anticancer agent? Pediatr Endocrinol Rev. 2013;10:485–493. [PubMed] [Google Scholar]
- 5.Gunta SS, Thadhani RI, Mak RH. The effect of vitamin D status on risk factors for cardiovascular disease. Nat Rev Nephrol. 2013;9:337–347. doi: 10.1038/nrneph.2013.74. [DOI] [PubMed] [Google Scholar]
- 6.Holick MF. Vitamin D: importance in the prevention of cancers, type 1 diabetes, heart disease, and osteoporosis. Am J Clin Nutr. 2004;79:362–371. doi: 10.1093/ajcn/79.3.362. [DOI] [PubMed] [Google Scholar]
- 7.Ju SY, Lee YJ, Jeong SN. Serum 25-hydroxyvitamin D levels and the risk of depression: a systematic review and meta-analysis. J Nutr Health Aging. 2013;17:447–455. doi: 10.1007/s12603-012-0418-0. [DOI] [PubMed] [Google Scholar]
- 8.Holick MF. Vitamin D Deficiency. N Engl J Med. 2007;357:266–281. doi: 10.1056/NEJMra070553. [DOI] [PubMed] [Google Scholar]
- 9.Binkley N, Ramamurthy R, Krueger D. Low vitamin D status: definition, prevalence, consequences, and correction. Rheum Dis Clin North Am. 2012;38:45–59. doi: 10.1016/j.rdc.2012.03.006. [DOI] [PubMed] [Google Scholar]
- 10.Hilger J, Friedel A, Herr R, Rausch T, Roos F, Wahl DA, et al. A systematic review of vitamin D status in populations worldwide. Br J Nutr. 2013;9:1–23. doi: 10.1017/S0007114513001840. [DOI] [PubMed] [Google Scholar]
- 11.Al-Turki H, Sadat-Ali M, Al-Elq A, Al-Mulhim F, Al-Ali M. 25-Hydroxy vitamin D levels among healthy Saudi Arabian women. Saudi Med J. 2008;29:1765–1768. [PubMed] [Google Scholar]
- 12.Sadat-Ali M, Al-Elq AM, Al-Turki H, Al-Mulhim F, Al-Ali A. Vitamin D levels among Healthy Saudi Arabian Men. Ann Saudi Med. 2009;29:378–382. doi: 10.4103/0256-4947.55168. [DOI] [PMC free article] [PubMed] [Google Scholar]
- 13.Ardawi MS, Qari MH, Rouzi AA, Maimani AA, Raddadi RM. Vitamin D status in relation to obesity, bone mineral density, bone turnover markers and vitamin D receptor genotypes in healthy Saudi pre- and postmenopausal women. Osteoporos Int. 2011;22:463–475. doi: 10.1007/s00198-010-1249-7. [DOI] [PubMed] [Google Scholar]
- 14.ElSammak MY, Al-Wossaibi AA, Al-Howeish A, Alsaeed J. Vitamin D deficiency in Saudi Arabs. Horm Metab Res. 2010;42:1–5. doi: 10.1055/s-0030-1248296. [DOI] [PubMed] [Google Scholar]
- 15.Al-Elq AM. The status of Vitamin D in medical students in the preclerkship years of a Saudi medical school. J Family Community Med. 2012;19:100–104. doi: 10.4103/2230-8229.98293. [DOI] [PMC free article] [PubMed] [Google Scholar]
- 16.Lensmeyer GL, Wiebe DA, Binkley N, Drezner MK. HPLC method for 25-hydroxyvitamin D measurement: comparison with contemporary assays. Clin Chem. 2006;52:1120–1126. doi: 10.1373/clinchem.2005.064956. [DOI] [PubMed] [Google Scholar]
- 17.Binkley N, Krueger D, Cowgill C, Hansen KE, Drezner MK. Assay variation confounds hypovitaminosis D diagnosis: a call for standardization. J Clin Endocrinol Metab. 2003;89:3152–3157. doi: 10.1210/jc.2003-031979. [DOI] [PubMed] [Google Scholar]
- 18.Tsugawa N, Suhara Y, Kamao M, Okano T. Determination of 25-Hydroxyvitamin D in human plasma using high-performance liquid chromatography--tandem mass spectrometry. Anal Chem. 2005;77:3001–3007. doi: 10.1021/ac048249c. [DOI] [PubMed] [Google Scholar]
- 19.Wallace AM, Gibson S, de la Hunty A, Lamberg-Allardt C, Ashwell M. Measurement of 25-hydroxyvitamin D in the clinical laboratory: current procedures, performance characteristics and limitations. Steroids. 2010;75:477–488. doi: 10.1016/j.steroids.2010.02.012. [DOI] [PubMed] [Google Scholar]
- 20.Fraser WD, Milan AM. Vitamin D assays: past and present debates, difficulties, and developments. Calcif Tissue Int. 2013;92:118–127. doi: 10.1007/s00223-012-9693-3. [DOI] [PubMed] [Google Scholar]
- 21.Carter GD. Accuracy of 25-Hydroxyvitamin D Assays: Confronting the Issues. Curr Drug Targets. 2011;12:19–28. doi: 10.2174/138945011793591608. [DOI] [PubMed] [Google Scholar]
- 22.Carter GD, Carter R, Jones J, Berry J. How accurate are assays for 25-hydroxyvitamin D? Data from the international vitamin D external quality assessment scheme. Clin Chem. 2004;50:2195–2197. doi: 10.1373/clinchem.2004.040683. [DOI] [PubMed] [Google Scholar]
- 23.Carter GD, Jones JC, Berry JI. The anomalous behaviour of exogenous 25-hydroxyvitamin D in competitive binding assays. J Steroid Biochem Mol Biol. 2007;103:480–482. doi: 10.1016/j.jsbmb.2006.11.007. [DOI] [PubMed] [Google Scholar]
- 24.He CS, Gleeson M, Fraser WD. Measurement of circulating 25-hydroxy vitamin d using three commercial enzyme-linked immunosorbent assay kits with comparison to liquid chromatography: tandem mass spectrometry method. ISRN Nutr 2013. 2013 doi: 10.5402/2013/723139. 723139. [DOI] [PMC free article] [PubMed] [Google Scholar]
- 25.Roth HJ, Schmidt-Gayk H, Weber H, Niederau C. Accuracy and clinical implications of seven 25-hydroxyvitamin D methods compared with liquid chromatography-tandem mass spectrometry as a reference. Ann Clin Biochem. 2008;45(Pt 2):153–159. doi: 10.1258/acb.2007.007091. [DOI] [PubMed] [Google Scholar]
- 26.Farrell CJ, Martin S, McWhinney B, Straub I, Williams P, Herrmann M. State-of-the-art vitamin D assays: a comparison of automated immunoassays with liquid chromatography-tandem mass spectrometry methods. Clin Chem. 2012;58:531–542. doi: 10.1373/clinchem.2011.172155. [DOI] [PubMed] [Google Scholar]
- 27.Moon HW, Cho JH, Hur M, Song J, Oh GY, Park CM, Yun YM, Kim JQ. Comparison of four current 25-hydroxyvitamin D assays. Clin Biochem. 2012;45:326–330. doi: 10.1016/j.clinbiochem.2011.12.025. [DOI] [PubMed] [Google Scholar]
- 28.Harrison SL, Nowak M, Buettner PG, Kimlin M, Proter D, Kennedy RL, et al. Public health and clinical dilemmas resulting from imprecise vitamin D tests. J Rural Trop Public Health. 2009;8:52–58. [Google Scholar]
- 29.Snellman G, Melhus H, Gedeborg R, Byberg L, Berglund L, Wernroth L, et al. DeterminingVitamin D status: A comparison between commercially available assays. PLos One. 2010;5:e11555. doi: 10.1371/journal.pone.0011555. [DOI] [PMC free article] [PubMed] [Google Scholar]
- 30.Lai JK, Lucas RM, Banks E, Ponsonby AL Ausimmune Investigator Group. Variability in vitamin D assays impairs clinical assessment of vitamin D status. Intern Med J. 2012;42:43–50. doi: 10.1111/j.1445-5994.2011.02471.x. [DOI] [PubMed] [Google Scholar]
- 31.Holmes EW, Garbincius J, McKenna KM. Analytical variability among methods for the measurement of 25-hydroxyvitamin D: still adding to the noise. Am J Clin Pathol. 2013;140:550–560. doi: 10.1309/AJCPU2SKW1TFKSWY. [DOI] [PubMed] [Google Scholar]
- 32.Ong L, Saw S, Sahabdeen NB, Tey KT, Ho CS, Sethi SK. Current 25-hydroxyvitamin D assays: do they pass the test? Clin Chim Acta. 2012;413:13–14. doi: 10.1016/j.cca.2012.03.009. [DOI] [PubMed] [Google Scholar]
- 33.Glendenning P, Taranto M, Noble JM, Musk AA, Hammond C, Goldswain PR, Fraser WD, Vasikaran SD. Current assays overestimate 25-hydroxyvitamin D3 and underestimate 25-hydroxyvitamin D2 compared with HPLC: need for assay-specific decision limits and metabolite-specific assays. Ann Clin Biochem. 2006;43(Pt 1):23–30. doi: 10.1258/000456306775141650. [DOI] [PubMed] [Google Scholar]


