

Abstract
Polyploidization is one of the most dramatic changes that can occur in the genome. In the liver, physiological polyploidization events occur during both liver development and throughout adult life. Here, we determined that a pathological polyploidization takes place in nonalcoholic fatty liver disease (NAFLD), a widespread hepatic metabolic disorder that is believed to be a risk factor for hepatocellular carcinoma (HCC). In murine models of NAFLD, the parenchyma of fatty livers displayed alterations of the polyploidization process, including the presence of a large proportion of highly polyploid mononuclear cells, which are rarely observed in normal hepatic parenchyma. Biopsies from patients with nonalcoholic steatohepatitis (NASH) revealed the presence of alterations in hepatocyte ploidy compared with tissue from control individuals. Hepatocytes from NAFLD mice revealed that progression through the S/G2 phases of the cell cycle was inefficient. This alteration was associated with activation of a G2/M DNA damage checkpoint, which prevented activation of the cyclin B1/CDK1 complex. Furthermore, we determined that oxidative stress promotes the appearance of highly polyploid cells, and antioxidant-treated NAFLD hepatocytes resumed normal cell division and returned to a physiological state of polyploidy. Collectively, these findings indicate that oxidative stress promotes pathological polyploidization and suggest that this is an early event in NAFLD that may contribute to HCC development.
Introduction
The liver is a fascinating organ with multiple functions and remarkable features. In addition to its crucial role in a wide array of metabolic processes, it also possesses regenerative capabilities that enable it to respond to several types of damage. Although the liver is made up of various cell types, hepatocytes account for 78% of liver volume and 70% of all liver cells (1), and these cells carry out most of the important functions of the liver. Hepatocytes are quiescent and differentiated cells, with an average life span ranging from 200 to 300 days. Moreover, mammalian hepatocytes are able to increase their number of chromosome sets, a phenomenon called polyploidization. Polyploid hepatocytes are characterized by the number of nuclei per cell (cellular ploidy) as well as the ploidy of each nucleus (nuclear ploidy). In rodents, hepatocytes are mainly tetraploid (binuclear with 2 diploid nuclei or mononuclear with 1 tetraploid nucleus) and octoploid (binuclear with 2 tetraploid nuclei or mononuclear with 1 octoploid nucleus) (2, 3). In humans, hepatocytes are essentially tetraploid (4, 5). Although the process of liver polyploidization has been documented extensively (6–8), this phenomenon remains poorly understood. During postnatal development, a scheduled division program characterized by incomplete cytokinesis results in the genesis of binuclear tetraploid hepatocytes (2x2n), which subsequently play a pivotal role in liver polyploidization (3, 9–11). Remarkably, during postnatal development and adult life, hepatocytes are able to increase their DNA content but also reduce it through a process call “ploidy reversal” (2, 12). In fact, polyploid hepatocytes undergo multipolar mitosis, producing daughter cells with half the chromosome content but also with aneuploid content. Polyploid hepatocytes use dynamic aneuploidization and polyploidization to induce genetic heterogeneity and thus maintain homeostasis or cope with environmental stress (13). Hepatocytes in adult rodents and humans retain a remarkable ability to proliferate in response to damage. In these circumstances, the liver polyploidy profile can also be modified. Signals promoting hepatocyte polyploidy include liver regeneration following partial hepatectomy (14), metabolic overload (15, 16), chemical overload (17), oxidative damage (18), and viral infection (5). However, the cellular and molecular mechanisms regulating polyploidy in these different situations are not fully understood.
We showed previously that insulin signaling controls the genesis of polyploid hepatocytes during liver development through the PI3K/AKT pathway by regulating the late stages of mitosis (19, 20). The close connection between liver physiology and insulin signaling prompted us to investigate whether polyploidy is modified during metabolic disorders of the liver, such as nonalcoholic fatty liver disease (NAFLD). This metabolic disease is commonly associated with metabolic syndrome (MS), obesity, and type 2 diabetes (21, 22). Due to the increasing incidence of obesity, NAFLD has become a worldwide health concern. NAFLD includes a large spectrum of hepatic lesions, ranging from simple reversible steatosis (intrahepatic accumulation of triglycerides) and nonalcoholic steatohepatitis (NASH) to more severe lesions, such as cirrhosis and hepatocellular carcinoma (HCC) (23–25). There is growing evidence that HCC can occur during NALFD in noncirrhotic livers (26–29). A “2-hit” model has been proposed to explain the progression of simple fatty liver disease to NASH (30). Alterations of lipid homeostasis associated with obesity, insulin resistance, and adipokine abnormalities constitute the first hit and result in fat accretion in the liver (31). This state subsequently primes the liver for the second hit, characterized by oxidative stress, lipid peroxidation, and an increase in cytokine production and inflammation, ultimately resulting in NASH (32, 33). Oxidative stress originating from mitochondria and cytochrome P450 2E1 is considered as a key signal in the pathophysiology of NASH (34, 35). Interestingly, studies in animal models and patients show that antioxidants, such as vitamin C, vitamin E, and N-acetylcysteine (NAC), are useful for both protecting against NAFLD and treating this disease (36–38). ROS affect several cell signaling pathways involved in cell proliferation and tumorigenicity (39, 40). Increasing evidence indicates that NAFLD strongly affects the intrinsic proliferative properties of hepatocytes. Many signs of impaired proliferation have been found in fatty hepatocytes (41–43).
In the present study, we used both mouse models and patients suffering from NAFLD to demonstrate that the molecular and cellular mechanisms controlling liver polyploidization are altered profoundly during the course of this metabolic disease. Indeed, our work reveals that oxidative stress induces an alteration of hepatic polyploidy, which could represent a novel cellular signature for NAFLD.
Results
NAFLD drives the genesis of highly polyploid hepatocytes in rodent and human liver parenchyma.
We first examined changes to the ploidy profile of hepatocytes during NAFLD in obese, diabetic leptin-deficient ob/ob mice. These mice are hyperphagic and display insulin resistance, hyperglycemia, and hypercholesterolemia and develop massive hepatic steatosis with moderate necroinflammation and mild fibrosis (44–47). We analyzed the hepatocyte ploidy profile by flow cytometry (Supplemental Figure 1; supplemental material available online with this article; doi:10.1172/JCI73957DS1). We observed that livers of ob/ob mice were enriched in hepatocytes with high DNA content compared with the control one (Figure 1A). In order to determine whether cellular (number of nuclei per hepatocyte) and/or nuclear ploidy (ploidy of each nucleus) were altered, we used imaging approaches. Labeling of nuclear (Hoechst) and plasma membrane (β-catenin) compartments was performed to investigate cellular ploidy in liver sections (Figure 1B and refs. 3, 5, 48). The binuclear fraction was lower in the liver parenchyma of ob/ob mice than in that of WT mice (ob/ob: 16.4% ± 1.3%; WT: 42.9% ± 2.1%) (Figure 1B and Table 1). This result is consistent with observations made in the context of insulin resistance (20). We next investigated nuclear ploidy by measuring the nucleus area. The mononuclear diploid (2n) hepatocyte population was substantially lower in ob/ob liver than in WT liver (ob/ob: 9.5% ± 1.7%; WT: 29.9% ± 2.7%) (Figure 1C and Table 2). By contrast, mononuclear tetraploid hepatocytes were enriched in ob/ob liver (ob/ob: 34.2% ± 2.6%; WT: 22.4% ± 1.5%) (Figure 1C and Table 2). Importantly, ob/ob liver contained highly polyploid mononuclear hepatocytes (≥8n), which were infrequently observed in WT liver (ob/ob: 39.9% ± 1.2%; WT: 4.8% ± 3.2%) (Figure 1C and Table 2).
Figure 1. Hepatocyte ploidy profiles are altered in a genetic mouse model of NAFLD.

(A) Hepatocytes from WT and ob/ob livers were separated into ploidy populations by FACS analyses (n = 3 per group) with 2c, 4c, and 8c and >8c DNA content corresponding to diploid, tetraploid, and highly polyploid hepatocytes, respectively. Of note, smear between hepatocytes populations (ob/ob cells) is due to high granularity (correlation with high lipid content). 7AAD, 7-aminoactinomycin D. (B) Images of liver sections from WT and ob/ob mice after double staining with β-catenin (plasma membrane labeling, red) and Hoechst (nucleus, green) (scale bar: 20 μm). Percentage of binuclear hepatocytes in WT and ob/ob mice (n = 6 per group). Results represent mean ± SEM. ***P < 0.001, Student’s t test. (C) β-Catenin/Hoechst immunostaining in WT and ob/ob mice (scale bar: 20 μm) and box plots of the percentage of 2n, 4n, and ≥8n mononuclear hepatocytes relative to total hepatocytes in WT and ob/ob mice. The bottom, central, and top lines of each box represent the first quartile, median, and third quartile of the distribution, respectively (n = 6 per group). **P < 0.005, ***P < 0.001, Student’s t test.
Table 1. Cellular ploidy of the NAFLD mouse models (by image quantification).
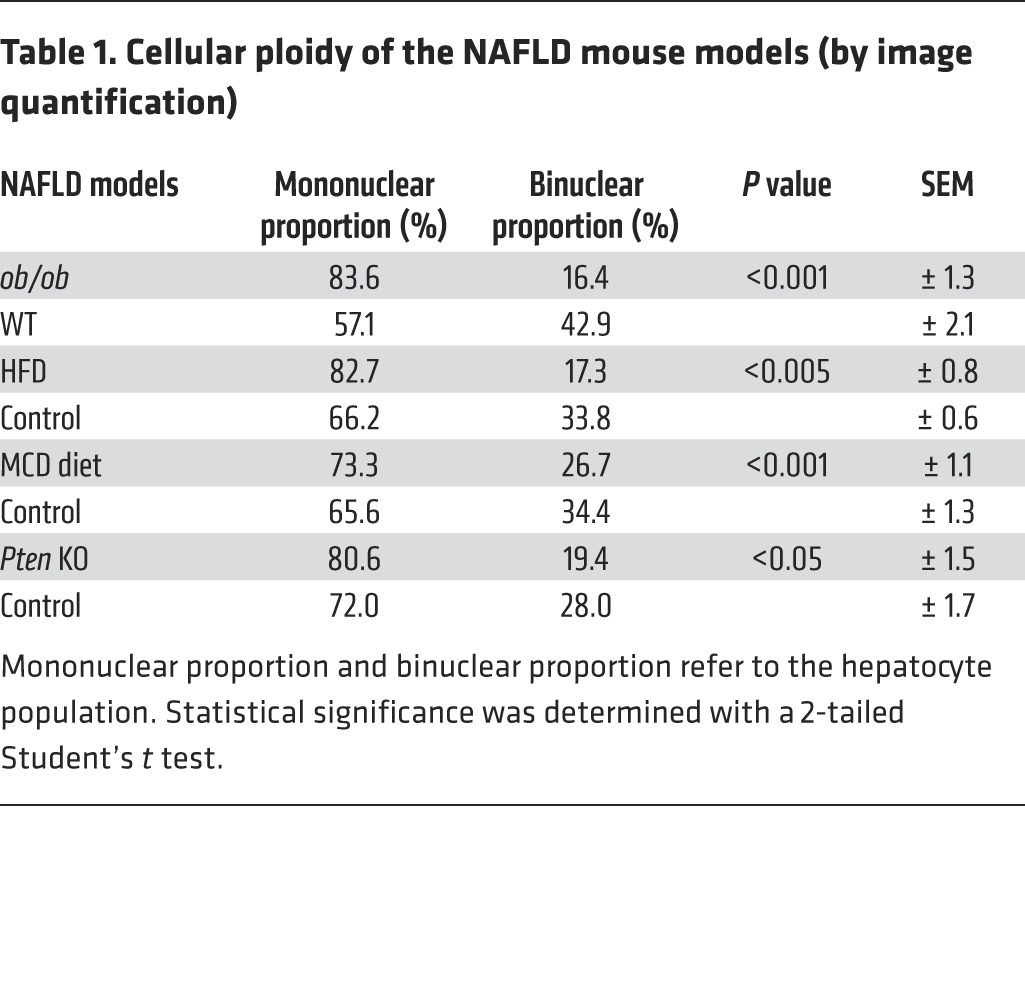
Table 2. Nuclear ploidy of the NAFLD mouse models (by image quantification).
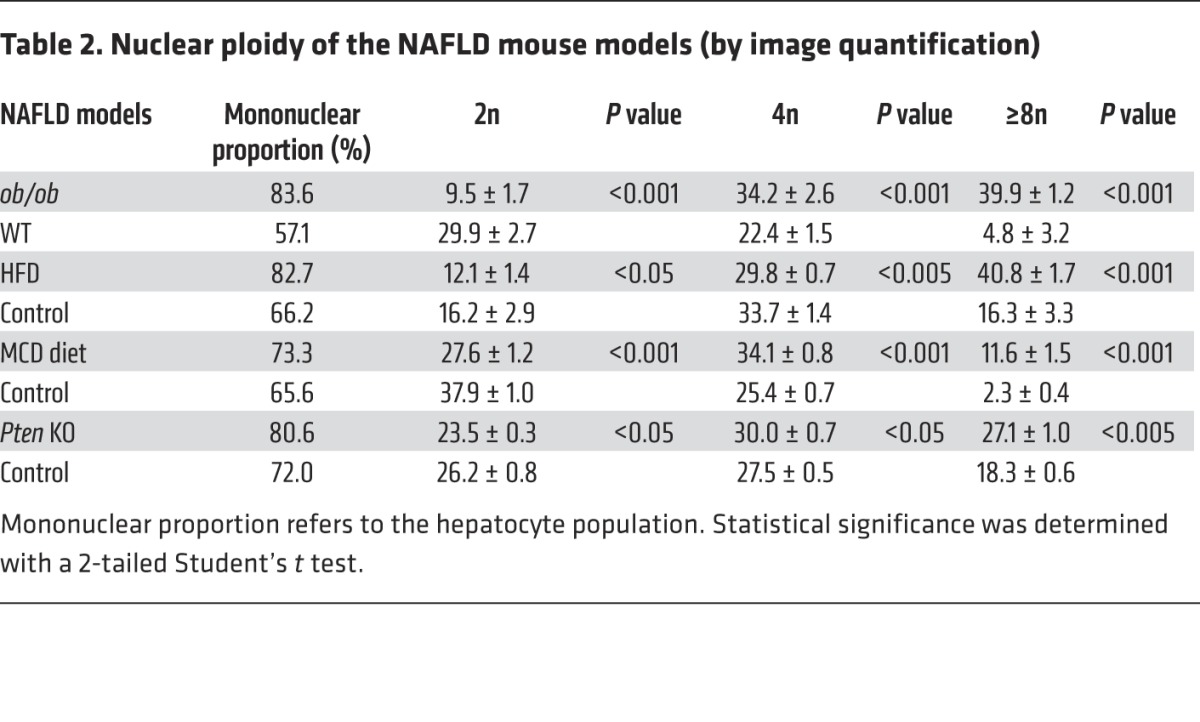
Next, we investigated ploidy profiles in diet-induced mouse models of NAFLD, including mice fed a high-fat diet (HFD) or a methionine-choline–deficient (MCD) diet, to further examine the link between steatosis and alterations to ploidy. A HFD is well known to increase body weight, body fat, and induce insulin resistance and hyperinsulinemia (49). The MCD diet promotes steatohepatitis by impairing the secretion of very low–density lipoprotein and creating conditions of high oxidative stress (50). Consistent with our findings in the ob/ob model, alterations of cellular and nuclear ploidy profiles were observed in both models (Figure 2 and Tables 1 and 2). Importantly, the highly polyploid mononuclear fraction was enriched in mice fed a HFD or a MCD diet (Figure 2 and Table 2). Finally, we determined the ploidy profile in the liver-specific phosphatase and tensin homolog (Pten) knockout mouse, which is a genetic mouse model that reflects the progression of NAFLD to NASH and HCC, which is related to human pathology. In the liver, the activation of the pro-anabolic PI3K/AKT pathway drives de novo lipogenesis as well as pathological liver growth (25). In this mouse model, loss of PTEN tumor suppressor results in chronic activation of PI3K/AKT signaling, leading to pronounced steatosis and, as mice age, to liver tumorigenesis (25). We first evaluated the nuclear ploidy profile in 3-month-old Pten KO mice at pretumoral stages. At this age, the Pten KO mouse liver shows extensive steatohepatitis (51, 52). Similar to other NAFLD models, the ploidy profile of Pten KO livers was different from that of WT livers and was characterized by the amplification of the highly polyploid mononuclear population (Supplemental Figure 2A and Table 2). In order to establish a relationship between hepatocyte polyploidy and HCC incidence, we have also analyzed ploidy profile in 10-month-old Pten KO mice. At this age, hepatic PTEN mutants are presented with multiple malignant lesions (51, 52). Importantly, we observed that highly polyploid mononuclear hepatocytes (≥8n) were also enriched in livers of tumoral KO mice compared with those in control animals (Supplemental Figure 2A). Interestingly, we observed that highly polyploid hepatocytes were also present in hepatocellular tumors in the livers of Pten KO mice (Supplemental Figure 2B).
Figure 2. Hepatocyte ploidy profiles are altered in dietary mouse models of NAFLD.

(A) MCD diet model. Hepatocytes were separated into ploidy populations by FACS analysis (n = 3 per group) with 2c, 4c, and 8c and >8c DNA content corresponding to diploid, tetraploid, and highly polyploid hepatocytes, respectively. Images of liver sections after double staining with anti–β-catenin (plasma membrane labeling, red) and Hoechst (nucleus, green) in WT mice fed control (CTRL) or MCD diets (scale bar: 20 μm). Box plots of the percentage of ≥8n mononuclear hepatocytes relative to total hepatocytes in control-fed and MCD diet–fed mice. Results represent mean ± SEM (n = 8 per group). ***P < 0.001, Student’s t test. (B) HFD model. Hepatocytes were separated into ploidy populations by FACS analysis (n = 3 per group) with 2c, 4c, and 8c and >8c DNA content corresponding to diploid, tetraploid, and highly polyploid hepatocytes, respectively. Images of liver sections after double staining with anti–β-catenin (red) and Hoechst (green) in WT mice fed a control or a HFD (scale bar: 20 μm). Box plots of the percentage of ≥8n mononuclear hepatocytes relative to total hepatocytes in control-fed and HFD-fed mice. Results represent mean ± SEM (n = 5 per group). ***P < 0.001, Student’s t test.
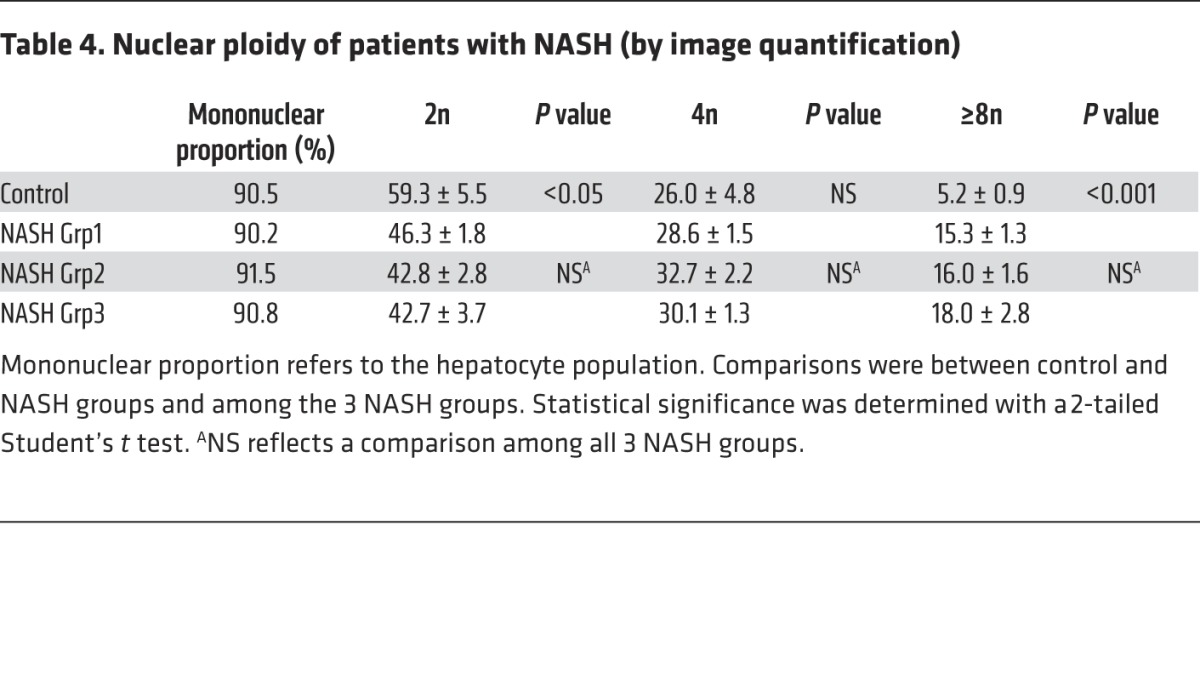
Importantly, we also investigated the ploidy profile of the liver in patients diagnosed with NASH who had undergone liver resection for HCC. Patients included in the study were of similar age (54 ± 7 years), which is important because hepatocyte ploidy varies in accordance with age (53). MS was the only risk factor for chronic liver disease (CLD) in patients with NASH (n = 16). Eight patients had moderate fibrosis (NASH Grp1), and the others had bridging fibrosis or cirrhosis (NASH Grp2). The control group (n = 8, HCC resected) was composed of patients with bridging fibrosis or cirrhosis but did not present any risk factors for MS. Immunofluorescence staining and quantification revealed that the binuclear fraction was small and equivalent in liver parenchyma for the 3 groups of patients (Figure 3A and Table 3). Interestingly, the percentage of diploid hepatocytes was significantly lower in patients with NASH with moderate (NASH Grp1: 46.3% ± 1.8%) or advanced fibrosis (NASH Grp2: 42.8% ± 2.8%) than in the control patients (control: 59.3% ± 5.5%) (Figure 3B and Table 4). Conversely, the percentage of highly polyploid mononuclear hepatocytes (≥8n) was significantly higher in patients with NASH with moderate or advanced fibrosis (NASH Grp1: 15.3% ± 1.3% and NASH Grp2: 16.0% ± 1.6%, respectively) than in control patients (control: 5.2% ± 0.9%) (Figure 3B and Table 4). Finally, in order to determine whether polyploidy could be causally related to hepatocarcinogenesis, we analyzed ploidy profiles in patients with NASH without HCC (NASH Grp3). Highly polyploid mononuclear hepatocytes were also present in fatty liver parenchyma tissue (18.0% ± 2.8%) (Figure 3 and Table 4). Altogether, our data reveal a shift in the distribution of hepatocyte ploidy toward an increase in highly polyploid mononuclear hepatocytes in patients with NASH, which seems to be independent of the severity of fibrosis and precedes HCC development.
Figure 3. Alteration of liver nuclear ploidy in patients diagnosed with NASH.

Nuclear ploidy profiles were analyzed in patients with CLD (resection for HCC) with bridging fibrosis or cirrhosis but with no features of MS (control), in patients with MS with moderate fibrosis (NASH Grp1), and in patients with MS with bridging fibrosis or cirrhosis (NASH Grp2) (n = 8 per group). Nuclear ploidy profiles were also analyzed in patients with MS with moderate fibrosis and without HCC (liver biopsy) (NASH Grp3). (A) Images of human liver sections (control and NASH Grp1–Grp3) after double staining with KL1 (plasma membrane labeling, red) and Hoechst (nucleus, green) (scale bar: 20 μm). (B) Box plots of the percentage of diploid (2n) and highly polyploid (≥8n) mononuclear hepatocytes relative to total hepatocytes in each patient group. The bottom, central, and top lines of each box represent the first quartile, median, and third quartile of the distribution, respectively. *P < 0.05, ***P < 0.001, Student’s t test.
Table 3. Cellular ploidy of patients with NASH (by image quantification).
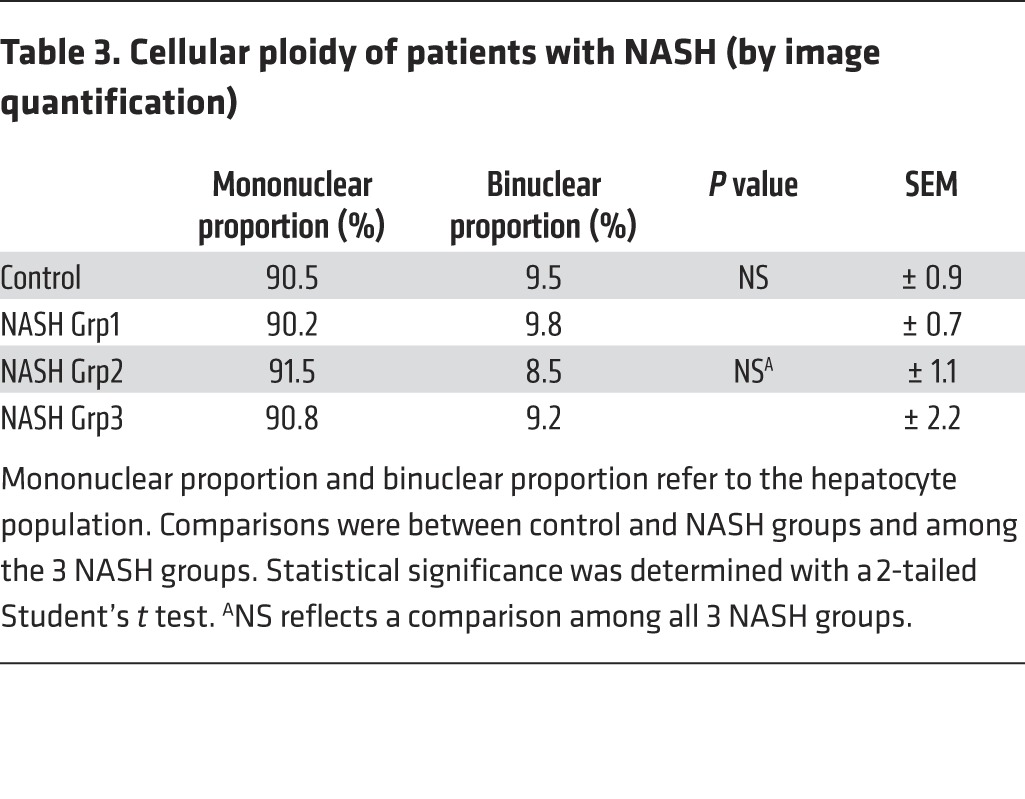
Table 4. Nuclear ploidy of patients with NASH (by image quantification).
Progression of NAFLD hepatocytes through S and G2 phases is altered.
We sought to determine the precise mechanism leading to the genesis of the highly polyploid mononuclear population in NAFLD livers. We isolated primary hepatocytes from WT and ob/ob mice and analyzed cell cycle progression. In our culture conditions, primary hepatocytes only divided once and progressed through S phase 48 hours after plating, with a maximal mitotic index 60 hours after plating (Figure 4A and refs. 3, 54). Cell viability after liver perfusion was equivalent for both genotypes. BrdU incorporation was similar between ob/ob and WT hepatocytes early during culture, suggesting that ob/ob hepatocytes entered S phase normally (Figure 4B and Supplemental Figure 3A). We also investigated the expression pattern of components of the cell cycle machinery that control progression through G1 and entry to S phase. The increase of D-cyclin (Ccnd1) and E-cyclin (Ccne1) mRNA abundance during cell cycle progression was equivalent in both cultures (Supplemental Figure 3B). Interestingly, ob/ob hepatocytes accumulated in S phase at late time points during culture (48 and 60 hours), whereas control hepatocytes exited S phase as expected during this period (Figure 4B). We confirmed this result by analyzing expression of A-cyclin (CCNA2), a master regulator of progression through the S phase (55). The abundance of Ccna2 mRNA decreased at between 48 and 60 hours in the control culture, whereas its expression significantly increased in ob/ob hepatocytes (Figure 4D), likely reflecting alterations of S phase progression.
Figure 4. NAFLD hepatocytes preferentially undergo an altered cell cycle.

Experiments were carried out in hepatocytes isolated from WT or ob/ob livers (4 independent cultures). (A) Experimental scheme of culture. T12H, time 12 hours after plating. (B) Immunostaining of primary hepatocytes with anti-BrdU (green) and Hoechst (blue) at 60 hours after plating (scale bar: 20 μm) and quantitative analysis of BrdU labeling (percentage of BrdU+ hepatocytes). Data represent the mean ± SEM. ***P < 0.001, Student’s t test. (C) Double immunostaining of primary hepatocytes at 60 hours after plating, with anti-PHH3 (green) and Hoechst (blue) (scale bar: 20 μm) and quantitative analysis of G2-labeling index (percentage of PHH3+ nuclei). Data represent mean ± SEM. ***P < 0.001, Student’s t test. (D) RNA extracted from WT (black circle) and ob/ob (gray square) primary hepatocytes (n = 5) and Ccna2 and Ccnb1 mRNAs were analyzed by quantitative real-time PCR. *P < 0.05, **P < 0.01, Student’s t test. (E) CCNB1 and phosphorylated CDK1 (Tyr15) protein levels were analyzed in WT and ob/ob cultures during the time-course experiment. γ-Tubulin was used as a loading control. The CCNB1 blot was derived from parallel samples run on a separate gel. The Western blot is from the same experiment as the Figure 6 and Supplemental Figure 4 and is representative of 4 different cultures. Lanes were run on the same gel but were noncontiguous, as indicated by the black line. (F) Soluble chromatin was prepared from culture at 60 hours, and MCM7 was analyzed by Western blotting. Lamin A-C was used as an indicator of fraction purity. Tot, total fraction; Chro, chromatin fraction. The Western blot is representative of 4 different cultures. Lanes were run on the same gel but were noncontiguous.
We then used phospho-histone H3 (PHH3) punctiform nuclei labeling (a marker for cells in late G2) to determine G2 progression (Figure 4C). In contrast with control cultures, ob/ob hepatocytes accumulated in G2 phase in cultures at 60 hours after plating (Figure 4C). We next examined the abundance of mitosis-promoting factor (MPF), which comprises a complex between B-cyclin (CCNB1) and CDK1. The accumulation of CCNB1 and dephosphorylation of CDK1 at Tyr15 are necessary for the activation of the MPF complex and the initiation of mitosis (56, 57). In our model, the abundance of Ccnb1 mRNA and protein increased normally from G1 to G2 phase (24–60 hours after plating) and CDK1 was highly phosphorylated during S phase (36 hours after plating) in both ob/ob and control hepatocytes (Figure 4, D and E). The phosphorylation of CDK1 decreased in WT hepatocytes as the cells proceeded through G2/M; however, in ob/ob cultures, inhibitory CDK1 phosphorylation was maintained and enhanced in ob/ob cultures (Figure 4E), reflecting an inactive MPF. We also analyzed the expression of MCM7, which is one of the minichromosome maintenance (MCM) proteins that are critical for licensing DNA replication in proliferating cells (58). MCM2–MCM7 are normally removed from replicated DNA, so that it cannot undergo further initiation events until it passes through mitosis (59). The abundance of MCM7 protein was higher in ob/ob proliferating hepatocytes than in control hepatocytes (Supplemental Figure 4). In control cells, only a small amount of MCM7 was present in the chromatin fraction at 60 hours, the time at which hepatocytes progress through G2/M phase (Figure 4F). By contrast, MCM7 was highly abundant in the chromatin fraction in ob/ob hepatocytes (Figure 4F), consistent with G2/M arrest. Importantly, similar alterations in cell cycle progression were observed in MCD diet and HFD hepatocyte cultures (Supplemental Figure 5). Taken together, we showed that NAFLD hepatocytes present an altered cell cycle progression, which correlates to the genesis of highly polyploid mononuclear cells in fatty liver tissue.
We determined next whether mononuclear polyploid fatty hepatocytes are able to bypass the G2/M arrest and reenter a new cell cycle. We used continuous labeling with 2 thymidine analogs (chlorodeoxyuridine [CldU] and iododeoxyuridine [IdU]) to follow division in vivo during disease progression (Figure 5A). Briefly, mice were fed an MCD diet, and CldU and IdU were incorporated successively into their drinking water. This approach enables the proliferative status of liver cells to be followed over a large time period. Importantly, it can show whether an individual hepatocyte that has already progressed through S phase (CldU+, green nucleus, Figure 5B) is able to reenter another replicative cell cycle (CldU+IdU+, yellow nucleus, Figure 5B). We observed that polyploid mononuclear fatty hepatocytes (4n: 45.6% and ≥8n: 10.9%) have achieved a first replicative cell cycle (CldU+, green labeling, Figure 5, B and C) and have progressed through another replicative cycle (IdU+, red labeling, Figure 5, B and C). These data strongly suggest that polyploid mononuclear hepatocytes are able to reenter the cell cycle despite G2/M arrest.
Figure 5. NAFLD mononuclear polyploid cells are able to reenter the cell cycle.

(A) Schematic representation of the nuclei double-labeling experiment with thymidine analogs. C57BL/6J mice were fed MCD diet for 4 weeks (d1–d27). At d15, animals had access to labeled CldU drinking water for 5 days. Over following 2 days, animals had access to unlabeled water to clear unincorporated CldU, followed by 5 days of access to IdU drinking water. (B) Images of hepatocyte nuclei from MCD diet liver sections after costaining with anti-CldU (green) and anti-IdU (red) and a merge with Hoechst (blue) (scale bar: 50 μm). The arrowheads point to double-labeled nuclei (yellow) (scale bar: 200 μm). (C) Quantification of polyploid mononuclear fatty hepatocytes with nuclei double labeling (CldU+IdU+) in MCD diet liver (n = 4). Results represent mean ± SEM.
A persistent DNA damage response, resulting from oxidative stress–induced polyploidization in NAFLD hepatocytes.
Recent work suggests that pathological polyploidization is an adaptation to genomic stress (60). Cells respond to a diverse array of DNA lesions with an evolutionarily conserved DNA damage response (61). The DNA damage response is a signal transduction pathway that is primarily mediated by proteins of the PI3K-like protein kinase family: ataxia telangiectasia mutated/ataxia telangiectasia and RAD3-related (ATM/ATR) (62, 63). We assessed whether this DNA damage checkpoint was activated in proliferative NAFLD hepatocytes. ATR phosphorylation was barely detectable in proliferative control hepatocytes (Figure 6). By contrast, ATR was highly phosphorylated as the cells proceeded through S and G2 phase in ob/ob hepatocytes (48–60 hours after plating) (Figure 6). As expected, this was associated with an activation of p53 protein and the accumulation of p21 protein in ob/ob hepatocytes (Figure 6). Importantly, the DNA damage checkpoint was also activated in proliferative MCD diet and HFD hepatocytes (Supplemental Figure 5, C and D). These results are consistent with the idea that the transient arrest in G2/M of NAFLD hepatocytes is regulated by the DNA damage pathway under the control of ATR/p53/p21 signaling.
Figure 6. Polyploidization in NAFLD is associated with the activation of ATR/p53/p21 signaling.

The abundance of phosphorylated ATR (Ser428), phosphorylated p53 (Ser15), and p21 protein was analyzed in primary hepatocytes isolated from WT or ob/ob mice. γ-Tubulin was used as a loading control. The Western blot is from the same experiment as the Figure 4E and Supplemental Figure 4 and is representative of 4 different cultures. Lanes were run on the same gel but were noncontiguous, as indicated by the black line.
ROS overproduction and subsequent oxidative stress influence genomic integrity greatly (40). Oxidative stress in the liver plays a central role in the progression of steatosis (34, 64). As expected, markers of oxidative stress are detectable in ob/ob hepatocytes both in vivo and in vitro: accumulation of ROS, a high abundance of glutathione peroxidase-3 (GPX3) (reflecting the adaptive activation of antioxidant defenses), and a high abundance of hemoglobin α (HBA1) recently correlated with oxidative stress in patients with NASH (ref. 65 and Supplemental Figure 6, A–C). We treated primary ob/ob hepatocytes with the antioxidant NAC and examined cell cycle progression. NAC treatment impaired the accumulation of ROS (assessed with dihydroethidium [DHE] labeling) as well as that of Gpx3 and Hba1 mRNA (Figure 7A and Supplemental Figure 6C), with no impact on cell viability. Moreover, the accumulation of BrdU at 60 hours after plating was lower in ob/ob hepatocytes treated with NAC than in untreated cells (Figure 7B), showing that treated cells progressed normally through the cell cycle. Importantly, ATR activation at this time point was substantially lower in treated cells than in untreated cells (Figure 7C). Finally, by analyzing ploidy at a late time point of culture, we observed that highly polyploid hepatocytes were enriched in ob/ob cultures compared with control (at 60 hours after plating) cultures (Supplemental Figure 6D). Notably, antioxidant treatment restored a normal ploidy profile in ob/ob cultures (Supplemental Figure 6D). We then subjected ob/ob and WT mice to long-term NAC treatment to examine the role of oxidative stress in vivo. This antioxidant was chosen because it is well tolerated in animals and can be administered orally over long periods of time (66). NAC treatment was initiated from early gestation through administration to pregnant female mice and maintained after birth until the mice were killed at 10 weeks old. DHE labeling and Gpx3 and Hba1 mRNA levels were significantly lower in ob/ob mice treated with NAC than in untreated ob/ob mice (Figure 7D), confirming that long-term administration of NAC significantly alleviates oxidative stress in ob/ob liver parenchyma. Remarkably, the proportion of highly polyploid hepatocytes was significantly lower in treated ob/ob mice than in untreated ob/ob mice, with a concomitant enrichment of the diploid hepatocytes (Figure 7E). Hence, these data indicate that affecting oxidative stress during NAFLD is sufficient to prevent the development of the pathological polyploidization.
Figure 7. Antioxidant treatment prevents activation of the G2/M DNA damage checkpoint and rescues normal hepatocyte polyploidy.

(A) DHE staining of hepatocytes (60 hours of culture). The ROS-sensitive vital dye DHE (red) was used to detect the production of superoxide (scale bar: 20 μm). The abundance of Gpx3 and Hba1 mRNA was assessed by qPCR in WT hepatocytes and in ob/ob hepatocytes treated with NAC or not treated (n = 4). *P < 0.05, **P < 0.01, Student’s t test. (B) Quantitative analysis of BrdU labeling. Data represent mean ± SEM of 4 independent cultures. **P < 0.01, Student’s t test. (C) Western blot analysis of phosphorylated ATR (Ser428) (60 hours of culture). γ-Tubulin was used as a loading control. The Western blot is representative of 4 different cultures. (D) DHE immunostaining of liver sections isolated from ob/ob mice treated with NAC for 10 weeks or from ob/ob mice that were not treated (n = 3 per group) (scale bar: 20 μm). The abundance of Gpx3 and Hba1 mRNA was assessed by qPCR (n = 3 per group). *P < 0.05, **P < 0.01, ***P < 0.001, Student’s t test. (E) Analysis of nuclear ploidy in ob/ob mice treated or not with NAC. Box plots of the percentage of diploid (2n) and highly polyploid (≥8n) hepatocytes relative to all mononuclear hepatocytes. The bottom, central, and top lines of each box represent the first quartile, median, and third quartile of the distribution, respectively (n = 3 per group). *P < 0.05, ***P < 0.001, Student’s t test.
Discussion
The development and progression of NAFLD is a growing health issue worldwide, and this condition can lead to end-stage liver diseases such as cirrhosis and HCC. Our limited understanding of the pathogenesis of NAFLD stems from its complex nature, governed by close interactions between genetic factors and environmental cues (67). Alarmingly, there are increasing reports of NASH linked to HCC, without accompanying cirrhosis (26, 29). Our results reveal for what we believe to be the first time a connection between hepatocyte polyploidy and fatty liver disorders (Figure 8). Using various murine models of NAFLD, we show that polyploidization is altered in fatty liver, with a specific enrichment of the highly polyploid mononuclear population, which is rarely observed in normal hepatic parenchyma. We also observed similar alterations of hepatocyte ploidy in patients with NASH. In addition, we show that polyploidization occurs in NAFLD hepatocytes experiencing a “G2/M DNA damage checkpoint” (ATR/p53/p21 signaling). We also show that oxidative stress, a key player in NAFLD progression, is crucial for pathological polyploidization in fatty liver.
Figure 8. Proposed model for the role of oxidative stress in liver polyploidization during NAFLD.

Polyploidization is one of the most dramatic changes known to occur in the genome. In mammals, the development of polyploid cells can contribute to tissue differentiation and, therefore, may represent a gain of function (68). However, given that cellular stress promotes polyploidization and that many diseased organs contain polyploid cells, polyploidization could also be considered as a pathological lesion (69). The liver is the only organ that modulates its ploidy content both during its life span and following different types of stress (13, 19, 70). The primary mechanism for physiological polyploidization involves a failure of cytokinesis, characterized by a modulation of insulin/AKT and E2F signaling (9, 11, 20). Interestingly, other factors can promote polyploidy in adults, such as regeneration following partial hepatectomy (48, 71, 72), fibrogenesis (5, 73), and metabolic overload (18, 74). Although some correlation exists between polyploidization and these stresses, little is known about the mechanisms leading to the genesis of polyploid hepatocytes and the consequences on liver parenchyma function. Our findings suggest that alteration of the ploidy profile of hepatocytes can be considered as a new signature of metabolic liver disorders. Indeed, our data from both mouse models and patients with NAFLD support the hypothesis that steatosis is sufficient per se to induce alterations in ploidy status. Many signals and genes are reported to be involved in pathological polyploidization (7, 60, 69). In our model, oxidative stress triggered the activation of a G2/M DNA damage checkpoint under the control of ATR/p53/p21 signaling, preventing the activation of the cyclin B1/CDK1 complex. Eukaryotic cells have evolved strategies to counteract a G2 DNA damage signal and may enter senescence or continue to grow through endoreplication (60, 69, 75, 76). Endoreplication (also called endocycling and endomitosis) refers to a process when cells successively alternate between S and G phases without chromosome segregation (60, 77). Interestingly, we have observed that NAFLD polyploid hepatocytes can undergo two successive S phases, suggesting that endoreplication might be preferentially performed in this context. Previous studies have shown an evolutionary conserved link between ATM/ATR-dependent pathways and polyploidy-inducing endoreplication cycles (60, 69). In Arabidopsis, root tip and sepal cells activate ATM and ATR orthologs and undergo endoreplication following the induction of double-stranded DNA breaks (78). In mammals, telomere shortening appears to be a potent signal for endoreplication, and Davoli et al. showed that p53-deficient cells undergo endoreplication, which requires ATM/ATR (79). Interestingly, these polyploid cells resume cell division cycles upon the restoration of telomere protection (79). Endoreplication is now well known and considered as an alternative division method in the context of genomic stress (60). Hepatocytes have extraordinary regenerative capabilities and respond strongly to both physiological and pathological proliferative signals. These cells must therefore have efficient mechanisms to cope with genomic alterations. In fatty liver, we suggest that genomic alterations, induced by oxidative stress, could be responsible for pathological polyploidization. We have already shown that oxidative stress in NAFLD liver directly activates a DNA damage checkpoint (ATR activation) (see above). Remarkably, prevention of oxidative stress was sufficient to restore a physiological hepatic ploidy status. Future studies will elucidate the precise mechanism linking genomic stress to pathological polyploidy.
The relevance of these highly polyploid hepatocytes to the pathogenesis of NAFLD is unclear. It is tempting to speculate that fatty hepatocytes with specific alterations of cell division participate in the progression of NAFLD to NASH and HCC. Interestingly, we observed that alteration of polyploid profile takes place before HCC development in the livers of patients. Additionally, a highly polyploid contingent was present in the HCC nodules in the livers of Pten-null mice, suggesting its implication in the tumorigenesis process. Future studies should aim to trace the mononuclear polyploid population and determine both its fate and role in liver carcinogenesis. Current data suggest that polyploid hepatocytes can be considered to act as a kind of “Dr. Jekyll and Mr. Hyde.” Diril and collaborators demonstrated that Cdk1–/– livers regenerate through endoreplication cycles. In this context, M phase kinase deficiency confers a total resistance against tumorigenesis induced by activated RAS and the silencing of p53, suggesting that endoreplication drives hepatocytes to senescence (80). By contrast, polyploid hepatocytes generate progenies with reduced ploidy by a process called “ploidy reversal” (2, 12). Uniquely, this cellular process generates daughter cells that are mostly aneuploid. Recent data suggest that aneuploid hepatocytes generated in physiological conditions are beneficial and these cells even promote adaptation to chronic injury in a tyrosinemia mouse model (12). In the context of NAFLD, it is possible that highly polyploid hepatocytes with DNA damage give rise to pathological aneuploid progenies that could contribute to progression to NASH and HCC in this circumstance.
In conclusion, the present study demonstrates for what we believe to be the first time a clear link between oxidative stress and pathological polyploidization during NAFLD. Future studies should be aimed at understanding the role of the population of highly polyploid hepatocytes in the emergence of HCC during NAFLD, which is a major concern for public health.
Methods
Animals care and diets.
C57BL/6J lean (WT) and ob/ob (B6.V-Lepob/J) male mice purchased from Janvier Laboratories were housed in a temperature-controlled environment with 12-hour-light/dark cycles. Animals had free access to water and a control diet (D12492, Research Diet), providing 60% carbohydrate, 20% fat, and 20% protein in terms of energy. For HFD-induced NAFLD experiments, 21-day-old C57BL/6J mice were assigned randomly to 2 groups fed for 12 to 16 weeks with the control diet or a HFD (D07051001, Research Diet), providing 10% carbohydrate, 70% fat, and 20% protein in terms of energy. For MCD diet–induced fatty liver, 10-week-old mice were fed for 3 to 5 weeks with a MCD diet (Ssniff EF R/M, MCD mod) purchased from Ssniff Spezialdiäten GmbH. Alb-Cre Ptenfl/fl (Pten KO) mice were obtained from the laboratory of M. Pende (Inserm U1151/CNRS UMR 8253, Necker Enfants Malades Institute) (52). For investigations with the antioxidant NAC, heterozygous male and female ob/+ mice were mated and had a free access to water with or without 10 mM NAC. Progenies were kept with their parents for 21 days and then weaned and had free access to water with or without 10 mM NAC. For all experiments, animals were sacrificed and livers were immediately flash frozen and stored at –80°C or fixed in phosphate-buffered 4% formalin.
Patients.
The study group included 32 male patients who underwent liver biopsy or resection for HCC. These patients were part of a previously published cohort, which was characterized for all parameters linked to CLD and MS (27, 81). The first group included 24 patients with MS without HCC (8 patients) or with HCC (16 patients); MS was the only risk factor for CLD. MS was defined as increased waist circumference (waist-to-hip ratio >0.9 in men) or body mass index >30 kg/m2 and at least two of the following risk factors: fasting plasma glucose >6.1 mM, dyslipidemia (triglycerides ≥1.7 mM or high-density lipoprotein cholesterol <0.9 mM), and hypertension (blood pressure >140/90 mm Hg). All other potential causes of CLD were ruled out. For all patients, pathological analysis was performed to assess the different lesions of the nontumoral liver, including steatosis and fibrosis (82). Using a semiquantitative score (Kleiner score, ref. 82; METAVIR score, ref. 83), fibrosis was determined for patients with CLD and MS as follows: F0, no fibrosis; F1, enlarged portal tracts without extensive septa; F2, presence of a few fibrous septa; F3, presence of numerous fibrous septa; and F4, cirrhosis. Diagnosis of steatohepatitis was based on the NAFLD activity score. Cases with an NAFLD activity score ranging from 0 to 2, 3 to 4, or >5 were considered as “not NASH,” probable, or “definite NASH,” respectively. For comparison, we also selected a second group of 8 patients with HCC as a consequence of HCV cirrhosis, with no evident causes of MS and absent or mild steatosis. Histologic examination of lesions was performed in a blinded fashion by surgical pathologists.
Liver tissue labeling with CldU and IdU.
CldU and IdU were purchased from Sigma-Aldrich and dissolved in drinking water at a concentration of 1 mg/ml. Four-week-old C57BL/6J mice were fed MCD diet for 4 weeks. For the experiments, CldU treatment was initiated at day 15, after the beginning of the diet, for 5 days. Animals had a free access to unlabeled water to clear unincorporated CldU during the following 2 days. Thereafter, IdU treatment was performed using the same method as that for CldU. Labeled drinking water was stored in the dark and changed every 24 hours. Immunofluorescence labeling was performed as described previously (84).
Cell isolation, culture of primary hepatocytes, and FACS analysis.
Hepatocytes were isolated from mouse livers by in situ perfusion and were seeded in complete medium, as described previously (20); briefly, hepatocytes were isolated in 6- to 7-week-old ob/ob mice and in 6- to 7-week-old MCD diet–fed mice (following 3 weeks of diet) and in 16-week-old HFD-fed mice (following 13 weeks of diet). Cell viability after liver perfusion was equivalent (≥90%) in all mouse models (WT, ob/ob, MCD diet, HFD). After cell spreading, the culture medium was deprived of fetal bovine serum and proliferation was induced with treatment with 50 ng/ml mitogenic EGF (Sigma-Aldrich). For rescue experiments, primary hepatocytes were treated with 7.5 mM NAC after seeding and during all of the culture time. Incorporation of the thymidine analog BrdU was used as an index of cell proliferation (Roche Mannheim). Freshly isolated hepatocytes were fixed in 70% ethanol overnight at 4°C. Fixed hepatocytes were loaded with 7-aminoactinomycin D (Invitrogen), and DNA content was determined with a LSR2 cytometer (BD Biosciences). Date files were analyzed using FlowJo software.
Gene expression analysis.
Total RNA was isolated from frozen livers or frozen primary hepatocytes using a Nucleo-Spin RNA II Kit (Macherey-Nagel), and 2 μg were used as a template for cDNA synthesis (MMLV, Life Technologies). PCR reactions containing the cDNA were set up in triplicate using FastStart SYBR Green Master (Roche) or the QuantiTect SYBR Green PCR Kit (Qiagen). Quantitative PCR was performed in real time using the LightCycler instrument (Roche Applied Science). Primer sequences were 5′-ACCCGGTCAACTTCAAGC-3′ (forward) and 5′-AACGGTATTTGGAGGTCAGC-3′ (reverse) for Hba1 and 5′-GTCCGCCAGTATGCTGCCAGGAA-3′ (forward) and 5′-GCTTTGGTCCTGGGCTTCTTACC-3′ (reverse) for 6S sense. Others primers were predesigned QuantiTect Primers purchased from Qiagen. Expression of mouse ribosomal protein 6S (6S) or hypoxanthine guanine phosphoribosyl transferase (Hprt) (Qiagen) was used as reference.
Preparation of protein and chromatin extracts.
Total proteins were extracted from snap-frozen livers or from primary hepatocytes as described previously (20). Hepatocytes nuclear extracts were prepared using the NE-PER Nuclear and Cytoplasmic Extraction Reagent Kit (Thermo Fisher Scientific). The nuclear fraction was centrifuged for 5 minutes at 1,700 g, and the pellet (corresponding to the chromatin fraction) was washed with 3 mM EDTA/0.2 mM EGTA/1 mM fresh DTT/Protease Inhibitor Cocktail (Roche) and finally sonicated for 30 minutes. Protein concentration was determined using the Bio-Rad Protein Assay.
Western blot analysis.
Proteins (about 50 μg) were resolved by SDS-PAGE and then transferred onto nitrocellulose membranes (0.45-μm pore size), which were incubated overnight at 4°C with antibodies. Rabbit anti-p21 and mouse anti-MCM7 antibodies were purchased from Santa Cruz Biotechnology Inc. Rabbit anti-CCNB1, anti-phosphorylated ATR (Ser428), anti-phosphorylated CDK1 (Tyr15), and anti-phosphorylated p53 (Ser15) antibodies and mouse anti-lamin A/C (4C11) antibody were purchased from Cell Signaling Technology. Mouse γ-tubulin-GTU88 antibody was purchased from Sigma-Aldrich. The protein-bound primary antibodies were detected with an appropriate horseradish peroxidase–conjugated secondary antibody (ThermoFisher Scientific). Immunoreactive bands were revealed with a chemiluminescence kit (Supersignal West Pico Chemiluminescent Substrate) purchased from ThermoFisher Scientific, and blots were exposed to Amersham Hyperfilm(GE Healthcare). In all Western blots, γ-tubulin was used to normalize the results.
Immunohistochemistry.
Animal and human livers were fixed overnight in formalin, embedded in paraffin, and cut into 3- to 7-μm-thick slices. Primary hepatocytes were fixed in –20°C methanol for 5 minutes for PHH3 staining or in –20°C ethanol 75%/acetic acid 25% for 20 minutes for the BrdU labeling. Immunohistochemistry was performed with the BrdU Detection Kit I (Roche), mouse anti–β-catenin antibody (1:200) (BD Biosciences), rabbit anti-PHH3 antibody (1:200) (Millipore), or mouse anti–pan cytokeratin KL-1 antibody (1:50) (Clinisciences). Anti-mouse or -rabbit IgG antibodies (1:500) conjugated with Alexa Fluor 488 or Alexa Fluor 594 (Invitrogen) were used as the secondary antibodies. Hoechst 33342 (0.2 μg/ml) purchased from Sigma-Aldrich was included in the final wash to counterstain nuclei.
In situ detection of ROS.
In the presence of ROS, DHE (Invitrogen) was oxidized to ethidium bromide, which stains nuclei bright red by intercalating with the DNA (85). Fresh cross sections (10 μm) of unfixed, frozen mouse livers were immediately incubated with 5 μM DHE at 37°C for 30 minutes in a humidified chamber, subsequently washed twice with ice-cold phosphate-buffered saline, and coverslipped. Primary hepatocytes were washed twice with ice-cold phosphate-buffered saline, incubated with 5 μM DHE at 37°C for 30 minutes, subsequently washed twice with ice-cold phosphate-buffered saline, and coverslipped. The fluorescence intensity of DHE staining was measured with ImageJ software.
Image acquisition and analysis.
For BrdU/PHH3/DHE staining and ploidy experiments (Hoechst 33342/β-catenin/KL1), images were taken using a LEICA DMI 6000 microscope at ×20 or ×40 magnification, PL APO objectives, a MicroMAX-1300Y/HS Princeton Instruments camera, and Metamorph 7 software (Molecular Devices). Z-axis stacks were collected using a piezoelectric device mounted at the base of the objective. For BrdU/PHH3 staining, at least 500 hepatocytes were counted in at least 10 different areas at each culture time (12, 24, 36, 48, 60 hours after plating). For ploidy experiments, at least 250 randomly selected fields of liver sections were imaged, corresponding to the analysis of more than 8,000 cells for nuclear ploidy analysis and more than 1,000 cells for cellular analysis.
To perform ploidy experiments, Hoechst 33342 staining was used to recognize nuclei with a roundness >0.8, and then β-catenin (mouse models) or KL1 (patients) staining was used to discriminate mononuclear and binuclear hepatocytes. Nuclear ploidy was detected automatically by a specific macro developed with ImageJ software (pixels ranging from 200 to 2,500 px2). Adobe Photoshop CS (Adobe Systems Software) was used for figure construction.
Statistics.
Statistical significance was determined with a 2-tailed Student’s t test performed using GraphPad Prism 5.0 (GraphPad Software Inc.). All data are representative of 3 to 8 animals of each genotype or 3 to 5 cultures and are expressed as mean ± SEM. A P value of less than 0.05 was considered statistically significant.
Study approval.
All procedures were carried out according to the French guidelines for the care and use of experimental animals. All animal studies were approved by the regional veterinary services of the Paris police headquarters (agreement no. 75-956) and by the Mouse Facility Core laboratory (Institut Cochin, Inserm U1016, Université Paris Descartes, Paris, France). All patients gave written informed consent, and the study protocol was approved by the ethics committee of the Beaujon Hospital.
Supplementary Material
Acknowledgments
The authors are grateful to Jean Pierre Couty, Sabine Colnot, and Catherine Postic for their critical evaluation of the work and to all members of the lab for fruitful discussion. We also thank the facilities of Histology, Immunostaining, Laser Microdissection and Cell Imaging and Cytometry Immuno-Biology (Institut Cochin, Inserm U1016, Paris, France). This study was supported by grants from INSERM, the Agence Nationale de la Recherche (ANR 2010 BLANC 1123 02), the Fondation ARC pour la recherche contre le Cancer (Fondation ARC no. SFI20111203568), the Association Française sur l’Etude du Foie, and Janssen Cilag laboratory. Géraldine Gentric was a recipient of grants from DIM Région Ile de France “Cardiovasculaire - Obésité - Rein - Diabète” and from Fondation ARC.
Footnotes
Conflict of interest: The authors have declared that no conflict of interest exists.
Reference information:J Clin Invest. 2015;125(3):981–992. doi:10.1172/JCI73957.
References
- 1.Si-Tayeb K, Lemaigre FP, Duncan SA. Organogenesis and development of the liver. Dev Cell. 2010;18(2):175–189. doi: 10.1016/j.devcel.2010.01.011. [DOI] [PubMed] [Google Scholar]
- 2.Duncan AW, et al. The ploidy conveyor of mature hepatocytes as a source of genetic variation. Nature. 2010;467(7316):707–710. doi: 10.1038/nature09414. [DOI] [PMC free article] [PubMed] [Google Scholar]
- 3.Guidotti JE, Bregerie O, Robert A, Debey P, Brechot C, Desdouets C. Liver cell polyploidization: a pivotal role for binuclear hepatocytes. J Biol Chem. 2003;278(21):19095–19101. doi: 10.1074/jbc.M300982200. [DOI] [PubMed] [Google Scholar]
- 4.Duncan AW, et al. Frequent aneuploidy among normal human hepatocytes. Gastroenterology. 2012;142(1):25–28. doi: 10.1053/j.gastro.2011.10.029. [DOI] [PMC free article] [PubMed] [Google Scholar]
- 5.Toyoda H, et al. Changes to hepatocyte ploidy and binuclearity profiles during human chronic viral hepatitis. Gut. 2005;54(2):297–302. doi: 10.1136/gut.2004.043893. [DOI] [PMC free article] [PubMed] [Google Scholar]
- 6.Celton-Morizur S, Desdouets C. Polyploidization of liver cells. Adv Exp Med Biol. 2010;676:123–135. doi: 10.1007/978-1-4419-6199-0_8. [DOI] [PubMed] [Google Scholar]
- 7.Gentric G, Desdouets C. Polyploidization in liver tissue. Am J Pathol. 2014;184(2):322–331. doi: 10.1016/j.ajpath.2013.06.035. [DOI] [PubMed] [Google Scholar]
- 8.Gupta S. Hepatic polyploidy and liver growth control. Semin Cancer Biol. 2000;10(3):161–171. doi: 10.1006/scbi.2000.0317. [DOI] [PubMed] [Google Scholar]
- 9.Chen HZ, et al. Canonical and atypical E2Fs regulate the mammalian endocycle. Nat Cell Biol. 2012;14(11):1192–1202. doi: 10.1038/ncb2595. [DOI] [PMC free article] [PubMed] [Google Scholar]
- 10.Margall-Ducos G, Morizur-Celton S, Couton D, Bregerie O, Desdouets C. Liver tetraploidization is controlled by a new process of incomplete cytokinesis. J Cell Sci. 2007;120(pt 20):3633–3639. doi: 10.1242/jcs.016907. [DOI] [PubMed] [Google Scholar]
- 11.Pandit SK, et al. E2F8 is essential for polyploidization in mammalian cells. Nat Cell Biol. 2012;14(11):1181–1191. doi: 10.1038/ncb2585. [DOI] [PubMed] [Google Scholar]
- 12.Duncan AW, et al. Aneuploidy as a mechanism for stress-induced liver adaptation. J Clin Invest. 2012;122(9):3307–3315. doi: 10.1172/JCI64026. [DOI] [PMC free article] [PubMed] [Google Scholar]
- 13.Duncan AW. Aneuploidy, polyploidy and ploidy reversal in the liver. Semin Cell Dev Biol. 2013;24(4):347–356. doi: 10.1016/j.semcdb.2013.01.003. [DOI] [PubMed] [Google Scholar]
- 14.Gerlyng P, et al. Binucleation and polyploidization patterns in developmental and regenerative rat liver growth. Cell Prolif. 1993;26(6):557–565. doi: 10.1111/j.1365-2184.1993.tb00033.x. [DOI] [PubMed] [Google Scholar]
- 15.Yamada T, et al. Increased polyploidy, delayed mitosis and reduced protein phosphatase-1 activity associated with excess copper in the Long Evans Cinnamon rat. Res Commun Mol Pathol Pharmacol. 1998;99(3):283–304. [PubMed] [Google Scholar]
- 16.Takeda K, Eguchi H, Soeda S, Shirahata A, Kawamura M. Fe(II)/Cu(I)-dependent P-type ATPase activity in the liver of Long-Evans cinnamon rats. Life Sci. 2005;76(19):2203–2209. doi: 10.1016/j.lfs.2004.10.041. [DOI] [PubMed] [Google Scholar]
- 17.Hasmall SC, Roberts RA. Hepatic ploidy, nuclearity, and distribution of DNA synthesis: a comparison of nongenotoxic hepatocarcinogens with noncarcinogenic liver mitogens. Toxicol Appl Pharmacol. 1997;144(2):287–293. doi: 10.1006/taap.1997.8133. [DOI] [PubMed] [Google Scholar]
- 18.Gorla GR, Malhi H, Gupta S. Polyploidy associated with oxidative injury attenuates proliferative potential of cells. J Cell Sci. 2001;114(pt 16):2943–2951. doi: 10.1242/jcs.114.16.2943. [DOI] [PubMed] [Google Scholar]
- 19.Celton-Morizur S, Merlen G, Couton D, Desdouets C. Polyploidy and liver proliferation: central role of insulin signaling. Cell Cycle. 2010;9(3):460–466. doi: 10.4161/cc.9.3.10542. [DOI] [PubMed] [Google Scholar]
- 20.Celton-Morizur S, Merlen G, Couton D, Margall-Ducos G, Desdouets C. The insulin/Akt pathway controls a specific cell division program that leads to generation of binucleated tetraploid liver cells in rodents. J Clin Invest. 2009;119(7):1880–1887. doi: 10.1172/JCI38677. [DOI] [PMC free article] [PubMed] [Google Scholar]
- 21.Cusi K. Role of insulin resistance and lipotoxicity in non-alcoholic steatohepatitis. Clin Liver Dis. 2009;13(4):545–563. doi: 10.1016/j.cld.2009.07.009. [DOI] [PubMed] [Google Scholar]
- 22.Fabbrini E, Sullivan S, Klein S. Obesity and nonalcoholic fatty liver disease: biochemical, metabolic, and clinical implications. Hepatology. 2010;51(2):679–689. doi: 10.1002/hep.23280. [DOI] [PMC free article] [PubMed] [Google Scholar]
- 23.Angulo P. NAFLD, obesity, and bariatric surgery. Gastroenterology. 2006;130(6):1848–1852. doi: 10.1053/j.gastro.2006.03.041. [DOI] [PubMed] [Google Scholar]
- 24.Farrell GC, Larter CZ. Nonalcoholic fatty liver disease: from steatosis to cirrhosis. Hepatology. 2006;43(2):S99–S112. doi: 10.1002/hep.20973. [DOI] [PubMed] [Google Scholar]
- 25.Michelotti GA, Machado MV, Diehl AM. NAFLD, NASH and liver cancer. Nat Rev Gastroenterol Hepatol. 2013;10(11):656–665. doi: 10.1038/nrgastro.2013.183. [DOI] [PubMed] [Google Scholar]
- 26.Baffy G, Brunt EM, Caldwell SH. Hepatocellular carcinoma in non-alcoholic fatty liver disease: an emerging menace. J Hepatol. 2012;56(6):1384–1391. doi: 10.1016/j.jhep.2011.10.027. [DOI] [PubMed] [Google Scholar]
- 27.Paradis V, et al. Hepatocellular carcinomas in patients with metabolic syndrome often develop without significant liver fibrosis: a pathological analysis. Hepatology. 2009;49(3):851–859. doi: 10.1002/hep.22734. [DOI] [PubMed] [Google Scholar]
- 28.Park EJ, et al. Dietary and genetic obesity promote liver inflammation and tumorigenesis by enhancing IL-6 and TNF expression. Cell. 2010;140(2):197–208. doi: 10.1016/j.cell.2009.12.052. [DOI] [PMC free article] [PubMed] [Google Scholar]
- 29.Starley BQ, Calcagno CJ, Harrison SA. Nonalcoholic fatty liver disease and hepatocellular carcinoma: a weighty connection. Hepatology. 2010;51(5):1820–1832. doi: 10.1002/hep.23594. [DOI] [PubMed] [Google Scholar]
- 30.Day CP, James OF. Hepatic steatosis: innocent bystander or guilty party? Hepatology. 1998;27(6):1463–1466. doi: 10.1002/hep.510270601. [DOI] [PubMed] [Google Scholar]
- 31.Polyzos SA, Kountouras J, Zavos C. Nonalcoholic fatty liver disease: the pathogenetic roles of insulin resistance and adipocytokines. Curr Mol Med. 2009;9(3):299–314. doi: 10.2174/156652409787847191. [DOI] [PubMed] [Google Scholar]
- 32.Sanyal AJ, et al. Nonalcoholic steatohepatitis: association of insulin resistance and mitochondrial abnormalities. Gastroenterology. 2001;120(5):1183–1192. doi: 10.1053/gast.2001.23256. [DOI] [PubMed] [Google Scholar]
- 33.Seki S, Kitada T, Yamada T, Sakaguchi H, Nakatani K, Wakasa K. In situ detection of lipid peroxidation and oxidative DNA damage in non-alcoholic fatty liver diseases. J Hepatol. 2002;37(1):56–62. doi: 10.1016/S0168-8278(02)00073-9. [DOI] [PubMed] [Google Scholar]
- 34.Aubert J, Begriche K, Knockaert L, Robin MA, Fromenty B. Increased expression of cytochrome P450 2E1 in nonalcoholic fatty liver disease: mechanisms and pathophysiological role. Clin Res Hepatol Gastroenterol. 2012;35(10):630–637. doi: 10.1016/j.clinre.2011.04.015. [DOI] [PubMed] [Google Scholar]
- 35.Rolo AP, Teodoro JS, Palmeira CM. Role of oxidative stress in the pathogenesis of nonalcoholic steatohepatitis. Free Radic Biol Med. 2012;52(1):59–69. doi: 10.1016/j.freeradbiomed.2011.10.003. [DOI] [PubMed] [Google Scholar]
- 36.de Oliveira CP, et al. Combination of N-acetylcysteine and metformin improves histological steatosis and fibrosis in patients with non-alcoholic steatohepatitis. Hepatol Res. 2008;38(2):159–165. doi: 10.1111/j.1872-034X.2007.00215.x. [DOI] [PubMed] [Google Scholar]
- 37.Oliveira CP, et al. Vitamin C and vitamin E in prevention of nonalcoholic fatty liver disease (NAFLD) in choline deficient diet fed rats. Nutr J. 2003;2:9. doi: 10.1186/1475-2891-2-9. [DOI] [PMC free article] [PubMed] [Google Scholar]
- 38.Pacana T, Sanyal AJ. Vitamin E and nonalcoholic fatty liver disease. Curr Opin Clin Nutr Metab Care. 2012;15(6):641–648. doi: 10.1097/MCO.0b013e328357f747. [DOI] [PMC free article] [PubMed] [Google Scholar]
- 39.Menon SG, et al. Superoxide signaling mediates N-acetyl-L-cysteine-induced G1 arrest: regulatory role of cyclin D1 and manganese superoxide dismutase. Cancer Res. 2007;67(13):6392–6399. doi: 10.1158/0008-5472.CAN-07-0225. [DOI] [PubMed] [Google Scholar]
- 40.Storz P. Reactive oxygen species in tumor progression. Front Biosci. 2005;10:1881–1896. doi: 10.2741/1667. [DOI] [PubMed] [Google Scholar]
- 41.Yang SQ, Lin HZ, Mandal AK, Huang J, Diehl AM. Disrupted signaling and inhibited regeneration in obese mice with fatty livers: implications for nonalcoholic fatty liver disease pathophysiology. Hepatology. 2001;34(4):694–706. doi: 10.1053/jhep.2001.28054. [DOI] [PubMed] [Google Scholar]
- 42.Leclercq IA, et al. Defective hepatic regeneration after partial hepatectomy in leptin-deficient mice is not rescued by exogenous leptin. Lab Invest. 2006;86(11):1161–1171. doi: 10.1038/labinvest.3700474. [DOI] [PubMed] [Google Scholar]
- 43.Yang S, et al. Oval cells compensate for damage and replicative senescence of mature hepatocytes in mice with fatty liver disease. Hepatology. 2004;39(2):403–411. doi: 10.1002/hep.20082. [DOI] [PubMed] [Google Scholar]
- 44.Haluzik M, et al. Genetic background (C57BL/6J versus FVB/N) strongly influences the severity of diabetes and insulin resistance in ob/ob mice. Endocrinology. 2004;145(7):3258–3264. doi: 10.1210/en.2004-0219. [DOI] [PubMed] [Google Scholar]
- 45.Guigas B, et al. AMP-activated protein kinase-independent inhibition of hepatic mitochondrial oxidative phosphorylation by AICA riboside. Biochem J. 2007;404(3):499–507. doi: 10.1042/BJ20070105. [DOI] [PMC free article] [PubMed] [Google Scholar]
- 46.Trak-Smayra V, Paradis V, Massart J, Nasser S, Jebara V, Fromenty B. Pathology of the liver in obese and diabetic ob/ob and db/db mice fed a standard or high-calorie diet. Int J Exp Pathol. 2011;92(6):413–421. doi: 10.1111/j.1365-2613.2011.00793.x. [DOI] [PMC free article] [PubMed] [Google Scholar]
- 47.Nishina PM, Lowe S, Wang J, Paigen B. Characterization of plasma lipids in genetically obese mice: the mutants obese, diabetes, fat, tubby, and lethal yellow. Metabolism. 1994;43(5):549–553. doi: 10.1016/0026-0495(94)90194-5. [DOI] [PubMed] [Google Scholar]
- 48.Miyaoka Y, Ebato K, Kato H, Arakawa S, Shimizu S, Miyajima A. Hypertrophy and unconventional cell division of hepatocytes underlie liver regeneration. Curr Biol. 2012;22(13):1166–1175. doi: 10.1016/j.cub.2012.05.016. [DOI] [PubMed] [Google Scholar]
- 49.Hebbard L, George J. Animal models of nonalcoholic fatty liver disease. Nat Rev Gastroenterol Hepatol. 2011;8(1):35–44. doi: 10.1038/nrgastro.2010.191. [DOI] [PubMed] [Google Scholar]
- 50.Caballero F, et al. Specific contribution of methionine and choline in nutritional nonalcoholic steatohepatitis: impact on mitochondrial S-adenosyl-L-methionine and glutathione. J Biol Chem. 2010;285(24):18528–18536. doi: 10.1074/jbc.M109.099333. [DOI] [PMC free article] [PubMed] [Google Scholar]
- 51.Horie Y, et al. Hepatocyte-specific Pten deficiency results in steatohepatitis and hepatocellular carcinomas. J Clin Invest. 2004;113(12):1774–1783. doi: 10.1172/JCI20513. [DOI] [PMC free article] [PubMed] [Google Scholar]
- 52.Panasyuk G, et al. PPARγ contributes to PKM2 and HK2 expression in fatty liver. Nat Commun. 2012;3:672. doi: 10.1038/ncomms1667. [DOI] [PMC free article] [PubMed] [Google Scholar]
- 53.Kudryavtsev BN, Kudryavtseva MV, Sakuta GA, Stein GI. Human hepatocyte polyploidization kinetics in the course of life cycle. Virchows Arch B Cell Pathol Incl Mol Pathol. 1993;64(6):387–393. doi: 10.1007/BF02915139. [DOI] [PubMed] [Google Scholar]
- 54.Desdouets C, Thoresen GH, Senamaud-Beaufort C, Christoffersen T, Brechot C, Sobczak-Thepot J. cAMP-dependent positive control of cyclin A2 expression during G1/S transition in primary hepatocytes. Biochem Biophys Res Commun. 1999;261(1):118–122. doi: 10.1006/bbrc.1999.0575. [DOI] [PubMed] [Google Scholar]
- 55.Yam CH, Fung TK, Poon RY. Cyclin A in cell cycle control and cancer. Cell Mol Life Sci. 2002;59(8):1317–1326. doi: 10.1007/s00018-002-8510-y. [DOI] [PMC free article] [PubMed] [Google Scholar]
- 56.Norbury C, Blow J, Nurse P. Regulatory phosphorylation of the p34cdc2 protein kinase in vertebrates. EMBO J. 1991;10(11):3321–3329. doi: 10.1002/j.1460-2075.1991.tb04896.x. [DOI] [PMC free article] [PubMed] [Google Scholar]
- 57.Fisher D, Krasinska L, Coudreuse D, Novak B. Phosphorylation network dynamics in the control of cell cycle transitions. J Cell Sci. 2012;125(pt 20):4703–4711. doi: 10.1242/jcs.106351. [DOI] [PubMed] [Google Scholar]
- 58.Diffley JF. Quality control in the initiation of eukaryotic DNA replication. Philos Trans R Soc Lond B Biol Sci. 2011;366(1584):3545–3553. doi: 10.1098/rstb.2011.0073. [DOI] [PMC free article] [PubMed] [Google Scholar]
- 59.Blow JJ, Ge XQ, Jackson DA. How dormant origins promote complete genome replication. Trends Biochem Sci. 2011;36(8):405–414. doi: 10.1016/j.tibs.2011.05.002. [DOI] [PMC free article] [PubMed] [Google Scholar]
- 60.Fox DT, Duronio RJ. Endoreplication and polyploidy: insights into development and disease. Development. 2013;140(1):3–12. doi: 10.1242/dev.080531. [DOI] [PMC free article] [PubMed] [Google Scholar]
- 61.Ciccia A, Elledge SJ. The DNA damage response: making it safe to play with knives. Mol Cell. 2010;40(2):179–204. doi: 10.1016/j.molcel.2010.09.019. [DOI] [PMC free article] [PubMed] [Google Scholar]
- 62.Nam EA, Cortez D. ATR signalling: more than meeting at the fork. Biochem J. 2011;436(3):527–536. doi: 10.1042/BJ20102162. [DOI] [PMC free article] [PubMed] [Google Scholar]
- 63.Stracker TH, Roig I, Knobel PA, Marjanovic M. The ATM signaling network in development and disease. Front Genet. 2013;4:37. doi: 10.3389/fgene.2013.00037. [DOI] [PMC free article] [PubMed] [Google Scholar]
- 64.Begriche K, Massart J, Robin MA, Bonnet F, Fromenty B. Mitochondrial adaptations and dysfunctions in nonalcoholic fatty liver disease. Hepatology. 2013;58(4):1497–1507. doi: 10.1002/hep.26226. [DOI] [PubMed] [Google Scholar]
- 65.Liu W, Baker SS, Baker RD, Nowak NJ, Zhu L. Upregulation of hemoglobin expression by oxidative stress in hepatocytes and its implication in nonalcoholic steatohepatitis. PLoS One. 2011;6(9):e24363. doi: 10.1371/journal.pone.0024363. [DOI] [PMC free article] [PubMed] [Google Scholar]
- 66.Laurent G, et al. Oxidative stress contributes to aging by enhancing pancreatic angiogenesis and insulin signaling. Cell Metab. 2008;7(2):113–124. doi: 10.1016/j.cmet.2007.12.010. [DOI] [PubMed] [Google Scholar]
- 67.Naik A, Kosir R, Rozman D. Genomic aspects of NAFLD pathogenesis. Genomics. 2013;102(2):84–95. doi: 10.1016/j.ygeno.2013.03.007. [DOI] [PubMed] [Google Scholar]
- 68.Gentric G, Celton-Morizur S, Desdouets C. Polyploidy and liver proliferation. Clin Res Hepatol Gastroenterol. 2012;36(1):29–34. doi: 10.1016/j.clinre.2011.05.011. [DOI] [PubMed] [Google Scholar]
- 69.Davoli T, de Lange T. The causes and consequences of polyploidy in normal development and cancer. Annu Rev Cell Dev Biol. 2011;27:585–610. doi: 10.1146/annurev-cellbio-092910-154234. [DOI] [PubMed] [Google Scholar]
- 70.Pandit SK, Westendorp B, de Bruin A. Physiological significance of polyploidization in mammalian cells. Trends Cell Biol. 2013;23(11):556–566. doi: 10.1016/j.tcb.2013.06.002. [DOI] [PubMed] [Google Scholar]
- 71.Nadal C, Zajdela F. [Somatic polyploid cells in rat liver. I. The role of binuclear cells in the formation of the polyploid cells]. Exp Cell Res. 1966;42(1):99–116. doi: 10.1016/0014-4827(66)90324-7. [DOI] [PubMed] [Google Scholar]
- 72.Sigal SH, et al. Partial hepatectomy-induced polyploidy attenuates hepatocyte replication and activates cell aging events. Am J Physiol. 1999;276(5):G1260–1272. doi: 10.1152/ajpgi.1999.276.5.G1260. [DOI] [PubMed] [Google Scholar]
- 73.Toyoda H, Kumada T, Bregerie O, Brechot C, Desdouets C. Conserved balance of hepatocyte nuclear DNA content in mononuclear and binuclear hepatocyte populations during the course of chronic viral hepatitis. World J Gastroenterol. 2006;12(28):4546–4548. doi: 10.3748/wjg.v12.i28.4546. [DOI] [PMC free article] [PubMed] [Google Scholar]
- 74.Troadec MB, et al. Iron overload promotes cyclin D1 expression and alters cell cycle in mouse hepatocytes. J Hepatol. 2006;44(2):391–399. doi: 10.1016/j.jhep.2005.07.033. [DOI] [PubMed] [Google Scholar]
- 75.Aylon Y, Oren M. p53: guardian of ploidy. Mol Oncol. 2012;5(4):315–323. doi: 10.1016/j.molonc.2011.07.007. [DOI] [PMC free article] [PubMed] [Google Scholar]
- 76.Campisi J, d’Adda di Fagagna F. Cellular senescence: when bad things happen to good cells. Nat Rev Mol Cell Biol. 2007;8(9):729–740. doi: 10.1038/nrm2233. [DOI] [PubMed] [Google Scholar]
- 77.Edgar BA, Zielke N, Gutierrez C. Endocycles: a recurrent evolutionary innovation for post-mitotic cell growth. Nat Rev Mol Cell Biol. 2014;15(3):197–210. doi: 10.1038/nrm3756. [DOI] [PubMed] [Google Scholar]
- 78.Adachi M, Brenner DA. High molecular weight adiponectin inhibits proliferation of hepatic stellate cells via activation of adenosine monophosphate-activated protein kinase. Hepatology. 2008;47(2):677–685. doi: 10.1002/hep.21991. [DOI] [PubMed] [Google Scholar]
- 79.Davoli T, Denchi EL, de Lange T. Persistent telomere damage induces bypass of mitosis and tetraploidy. Cell. 2010;141(1):81–93. doi: 10.1016/j.cell.2010.01.031. [DOI] [PMC free article] [PubMed] [Google Scholar]
- 80.Diril MK, et al. Cyclin-dependent kinase 1 (Cdk1) is essential for cell division and suppression of DNA re-replication but not for liver regeneration. Proc Natl Acad Sci U S A. 2012;109(10):3826–3831. doi: 10.1073/pnas.1115201109. [DOI] [PMC free article] [PubMed] [Google Scholar]
- 81.Paradis V, et al. Cullin7: a new gene involved in liver carcinogenesis related to metabolic syndrome. Gut. 2013;62(6):911–919. doi: 10.1136/gutjnl-2012-302091. [DOI] [PubMed] [Google Scholar]
- 82.Kleiner DE, et al. Design and validation of a histological scoring system for nonalcoholic fatty liver disease. Hepatology. 2005;41(6):1313–1321. doi: 10.1002/hep.20701. [DOI] [PubMed] [Google Scholar]
- 83.Bedossa P, Poynard T. An algorithm for the grading of activity in chronic hepatitis C. The METAVIR Cooperative Study Group. Hepatology. 1996;24(2):289–293. doi: 10.1002/hep.510240201. [DOI] [PubMed] [Google Scholar]
- 84.Tuttle AH, et al. Immunofluorescent detection of two thymidine analogues (CldU and IdU) in primary tissue. J Vis Exp. 2010;(46):2166. doi: 10.3791/2166. [DOI] [PMC free article] [PubMed] [Google Scholar]
- 85.Nishina S, et al. Hepatitis C virus-induced reactive oxygen species raise hepatic iron level in mice by reducing hepcidin transcription. Gastroenterology. 2008;134(1):226–238. doi: 10.1053/j.gastro.2007.10.011. [DOI] [PubMed] [Google Scholar]
Associated Data
This section collects any data citations, data availability statements, or supplementary materials included in this article.