Abstract
Recombinant adenoviral vectors (rAds) are lead vaccine candidates for protection against a variety of pathogens, including Ebola, HIV, tuberculosis, and malaria, due to their ability to potently induce T cell immunity in humans. However, the ability to induce protective cellular immunity varies among rAds. Here, we assessed the mechanisms that control the potency of CD8 T cell responses in murine models following vaccination with human-, chimpanzee-, and simian-derived rAds encoding SIV-Gag antigen (Ag). After rAd vaccination, we quantified Ag expression and performed expression profiling of innate immune response genes in the draining lymph node. Human-derived rAd5 and chimpanzee-derived chAd3 were the most potent rAds and induced high and persistent Ag expression with low innate gene activation, while less potent rAds induced less Ag expression and robustly induced innate immunity genes that were primarily associated with IFN signaling. Abrogation of type I IFN or stimulator of IFN genes (STING) signaling increased Ag expression and accelerated CD8 T cell response kinetics but did not alter memory responses or protection. These findings reveal that the magnitude of rAd-induced memory CD8 T cell immune responses correlates with Ag expression but is independent of IFN and STING and provide criteria for optimizing protective CD8 T cell immunity with rAd vaccines.
Introduction
CD8 T cells play a critical role in mediating protection to a variety of intracellular pathogens, including Ebola, HIV, tuberculosis, and malaria. Replication-defective recombinant adenoviral vectors (rAds) are promising candidates for induction of such responses in humans, based on their potency, scalable manufacturing capacity, and favorable safety profile. Accordingly, a number of human-derived (1–3) and animal-derived (4–7) rAds has been developed for use as vaccines against such pathogens. rAd serotype 5 (rAd5) is the most potent vector in preclinical and clinical studies but has high seroprevalence in human populations due to natural infection (8, 9), which may limit optimal CD8 immunity. This led to the development of alternative rAds based on serotypes with low seroprevalence (2, 3, 7), but these vary substantially in their potency and protective capacity (7–10). Of note, a chimpanzee-derived rAd, chAd3, has recently entered accelerated phase I clinical trials for Ebola virus infection, after inducing a high level of protection in a preclinical nonhuman primate model (11). Given the potential of rAds to induce potent cellular immunity, an understanding of the in vivo mechanisms that initiate such responses is critical to facilitate targeted selection of adenovirus serotypes for vector generation and to guide further development of these clinically important vaccines.
Prior studies have shown that certain rAds can differ with respect to antigen (Ag) expression levels in vivo and their innate immunogenicity (3, 12–15) and suggest that these parameters affect each other and shape the resulting adaptive immune response. Additional in vitro and in vivo studies have examined early pathogen-recognition receptor (PRR) signaling and innate pathways induced after adenoviral infection or rAd exposure. In mice, deficiency of RIG-I–like receptor (RLR) or TLR adaptor proteins (mitochondrial antiviral signaling protein [MAVS], myeloid differentiation primary response gene 88 [MyD88], and TIR domain–containing adapter-inducing IFN-β [TRIF]) or individual TLRs can modestly reduce rAd-induced CD8 T cell responses (16–20). Adenoviral DNA also potentiates the NALP3-dependent inflammasome (21), but mice deficient in a critical component of the inflammasome generate normal CD8 T cell immunity after rAd5 vaccination (20). Although these studies suggest that PRR signaling and innate immune responses promote optimal CD8 T cell immunity after rAd vaccination, the in vivo mechanisms that influence induction of CD8 T cell immunity across a broad array of rAds are not well defined.
In this study, we assessed the mechanisms that underlie the hierarchy of protective CD8 T cell immune responses induced by human-, chimpanzee-, and simian-derived rAds (9). We performed correlative analyses of Ag expression, innate immunity, CD8 T cell immunity and protection after rAd vaccination. High and prolonged Ag expression was observed with rAd5 and chAd3, and this correlated with robust protective CD8 T cell immunity. In contrast, strong activation of innate genes, as determined by expression profiling in draining lymph nodes (dLNs) after rAd vaccination, was observed with other rAds and correlated with reduced Ag expression. Moreover, abrogating type I IFN and specifically stimulator of IFN genes (STING) signaling during rAd vaccination increased Ag expression but only accelerated the kinetic of CD8 T cell responses and did not alter the magnitude of memory responses. These data show that type I IFN and STING signaling are the major innate pathways induced by certain rAds, which limit Ag expression, but signaling is dispensable for induction of CD8 T cell memory. Thus, the amount and duration of Ag is the best predictor of protective CD8 T cell immunity with rAds, while IFN-driven innate responses have a limited role.
Results
Protective CD8 T cell responses after rAd vaccination correlate with Ag expression.
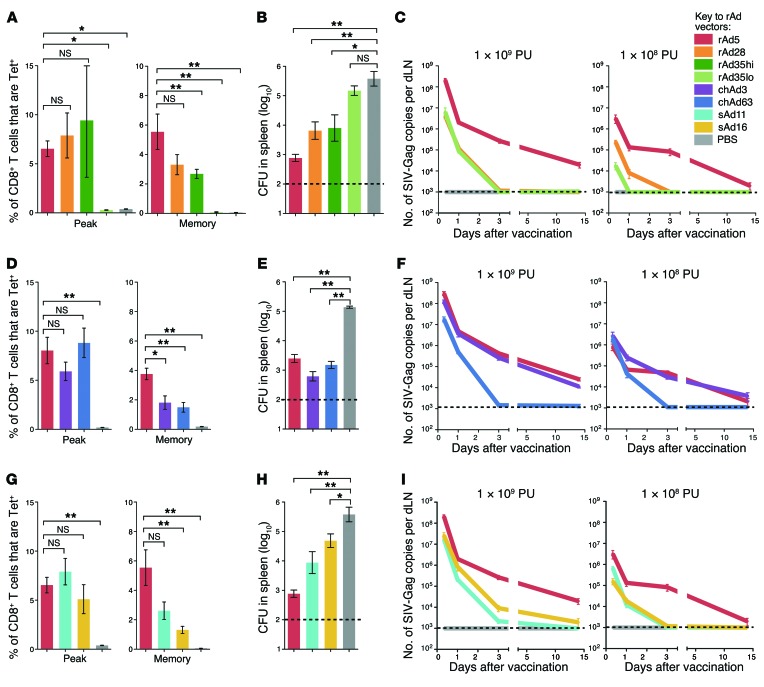
To define the potency and protective capacity of human-derived rAds, rAd5, rAd28, and rAd35 expressing the SIV-Gag as an Ag were compared. In a previous study, the magnitude, quality, and phenotype of CD8 T cell responses induced by rAds in C57BL/6 mice were characterized at several different doses (9). Based on these data, a dose of 1 × 10⁸ particle units (PU) given subcutaneously was chosen to provide a hierarchy of potency when memory CD8 T cell responses were established, 70 days after vaccination and hereafter referred to as “at memory.” For rAd35, which does not elicit detectable responses at this dose (Figure 1A), mice were vaccinated with 1 × 10⁹ PU (rAd35hi) and 1 × 10⁸ PU (rAd35lo). Gag-specific CD8 T cell responses were characterized in the spleen, blood, and lung using peptide-MHC I tetramer staining. Mice were then challenged with recombinant Listeria monocytogenes expressing Gag, as a CD8 T cell–dependent model of protection (9, 22). rAd5 induced the most potent and protective CD8 T cell responses, followed by rAd28 and rAd35 (Figure 1, A and B). rAd35 only induced detectable and protective CD8 T cell responses at the 1 × 10⁹ PU dose (Figure 1, A and B).
Figure 1. Hierarchy of protective CD8 T cell responses and Ag expression after rAd vaccination.
(A) Frequency of tetramer+ CD8+ T cells in spleens at peak (day 23) or once memory CD8+ T cell responses were established (day 70) after vaccination with human-derived rAds. (B) Bacterial load in spleens at day 108 after challenge with L. monocytogenes expressing Gag. (C) Ag transcript expression in dLNs after vaccination with human-derived rAds at 1 × 10⁹ PU or 1 × 10⁸ PU. (D) Tetramer+ CD8+ T cell responses at peak or memory, (E) bacterial load, and (F) Ag expression for chimpanzee-derived rAds. (G) Tetramer+ CD8+ T cell responses at peak or once memory CD8+ T cell responses were established, (H) bacterial load, and (I) Ag expression for simian-derived rAds. For CD8 T cell responses and bacterial load analysis, mice received all rAds at 1 × 10⁸ PU; rAd35 was administered at both 1 × 10⁹ PU (rAd35hi) and 1 × 10⁸ PU (rAd35lo). For Ag expression, mice received rAds at 1 × 10⁹ PU or 1 × 10⁸ PU as indicated. Error bars indicate mean ± SEM. *P ≤ 0.05, **P ≤ 0.01, Mann-Whitney test. Dashed lines indicate the limit of detection (LOD). Data represent at least 2 independent experiments (n = 3–6).
To examine whether Ag dose and duration corresponded with induction of protective CD8 T cell immunity, Gag mRNA expression was assessed over time in the dLNs by quantitative real-time PCR analysis (qRT-PCR). rAd5 produced substantially more Gag transcript at each time point compared with rAd28 or rAd35, with transcript still detected 14 days after vaccination (Figure 1C), and lower but persistent expression was also detected with 1 × 10⁷ PU rAd5 (K.M. Quinn, unpublished observations). In contrast, no transcript could be detected beyond 72 hours after vaccination with rAd28 or rAd35 at 1 × 10⁸ PU (Figure 1C). Moreover, rAd35 produced less transcript than rAd28 at 1 × 10⁸ PU and lost detectable expression earlier after vaccination (Figure 1C). Thus, the amount and duration of Gag transcript expression correlated with the hierarchy of protective CD8 T cell immunity for human rAds.
To extend this analysis, CD8 T cell immunity and transcript expression were assessed using rAds from other species, such as chimpanzee-derived (chAd3 and chAd63) and simian-derived (sAd11 and sAd16) vectors. Chimpanzee-derived rAds induced lower CD8 T cell responses compared with rAd5 at memory (Figure 1D) but conferred similar degrees of protection (Figure 1E). At a lower dose (1 × 10⁷ PU), chAd3 maintains protection at a similar level to rAd5, whereas chAd63 loses protective efficacy (9). Thus, chAd3 is more protective than chAd63 and as protective as rAd5 in this model. Consistent with these findings, chAd3 and rAd5 produced similar levels of transcript, while chAd63 lost expression rapidly (Figure 1F). Simian-derived rAds also induced significantly lower CD8 T cell responses and protection compared with rAd5 once memory CD8+ T cell responses were established (Figure 1, G and H). Consistent with this, sAd11 and sAd16 produced markedly less transcript than rAd5 at 1 × 10⁹ and 1 × 10⁸ PU (Figure 1I). Of note, similar hierarchies for CD8 T cell response magnitude across the rAds were observed in blood and lung once memory CD8+ T cell responses were established (Supplemental Figure 1; supplemental material available online with this article; doi:10.1172/JCI78280DS1). To conclude, the highest levels of sustained Ag transcript expression were observed after vaccination with the most protective vectors: rAd5 and chAd3.
Ag is expressed in multiple DC subsets with all rAds.
While there were clear differences in transcript level across rAds, expression of transcript may not reflect protein expression. Additionally, different adenovirus serotypes can use different receptors to enter target cells (2, 3, 7, 23), which could alter the distribution of Ag across DC subsets and affect CD8 T cell immunity. To assess this directly, mice were vaccinated with rAd5, rAd35, chAd3, and chAd63 encoding EGFP. For this analysis, a higher dose of rAd (1 × 10¹⁰ PU) was used to enable detection of a sufficient number of events by flow cytometry to define Ag distribution to specific DC subsets. At 24 hours after vaccination, EGFP expression was assessed in 6 major DC subsets in murine skin dLNs (Supplemental Figure 2), including lymph node resident (CD8α+ DCs and plasmacytoid DCs) and migratory populations (monocyte-derived DCs, langerin+ and langerin– dermal DCs [dDCs], and Langerhans cells).
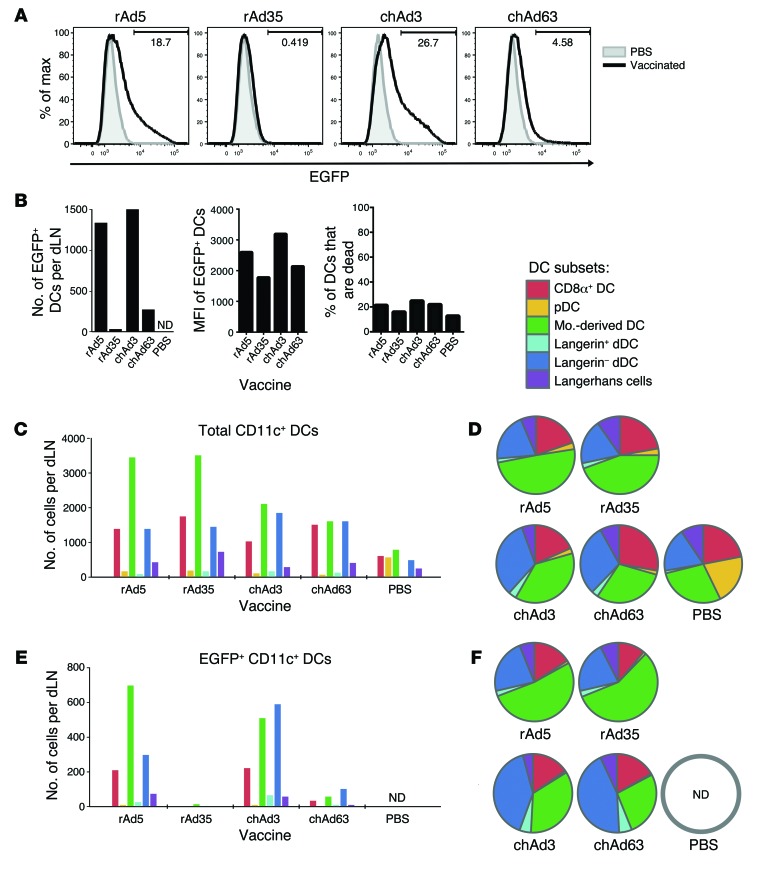
Vaccination with rAd5 or chAd3 generated a comparably high frequency and number of total CD11c+ DCs expressing EGFP in the dLNs (Figure 2, A and B). More modest levels were observed with chAd63, and EGFP+ DCs were low to undetectable after rAd35 vaccination (Figure 2, A and B). Similar data were obtained at 10 hours after vaccination (K.M. Quinn, unpublished observations). The median fluorescence intensity (MFI) of EGFP+ DCs was consistently higher after rAd5 and chAd3 vaccination compared with that after chAd63 or rAd35 vaccination, but DC viability was equivalent across groups (Figure 2B). This illustrates that rAd5 and chAd3 induce higher Ag expression on a per cell basis and suggests that the lower number of Ag+ DCs after rAd35 or chAd63 vaccination is not due to differential kinetics of Ag expression or cell death across the rAds. Collectively, these data demonstrate concordance between Gag transcript and Ag protein expression.
Figure 2. Ag expression and distribution to DC subsets in vivo after rAd vaccination.
(A) Histograms representing EGFP expression after rAd vaccination. (B) Number of EGFP+ DCs recovered per dLN, MFI of EGFP in EGFP+ DCs after rAd vaccination, and percentage of CD11c+ DCs that are nonviable per dLNs. (C) Number and (D) relative proportion of total CD11c+ DCs that distribute to each DC subset. pDC, plasmacytoid DC; mo.-derived DC, monocyte-derived DC. (E) Number and (F) relative proportion of EGFP+ CD11c+ DCs that distribute to each DC subset. Mice received rAd expressing EGFP at 1 × 10¹⁰ PU. ND, no events detected. Data are representative of results over 3 independent experiments and are derived from dLNs pooled from 10 individual mice.
The number and relative proportion of each subset among total DCs and EGFP+ DCs were then assessed. Among total DCs, the number in each subset varied modestly (Figure 2C), but the relative proportions were comparable across all rAd-vaccinated mice (Figure 2D), indicating that DC subsets were similarly recruited to the dLNs with all rAds. Among EGFP+ DCs, the number in each subset differed substantially (Figure 2E), but the distribution of EGFP expression across subsets was similar for all rAds (Figure 2F). The use of a relatively high dose of rAd may mask differences in tropism among the different rAds, so the same analysis was performed with lower doses (5 × 10⁹ PU and 5 × 10⁸ PU). While the distribution of Ag with chAd63 at 5 × 10⁹ PU and with rAd35 at 5 × 10⁸ PU began to differ from higher doses of these vectors, the number of EGFP+ DCs acquired was less than the detection limit (~500 events) (Supplemental Figure 3). Importantly, the pattern of Ag expression remained consistent across rAds and reflected transcript levels in Figure 1. Overall, DC recruitment to the dLNs and Ag distribution across DC subsets was similar, despite potential tropism effects, and rAds differed primarily in the number of Ag-loaded DCs present in the dLNs.
CD8 T cell responses are dependent on cross-presenting DC populations.
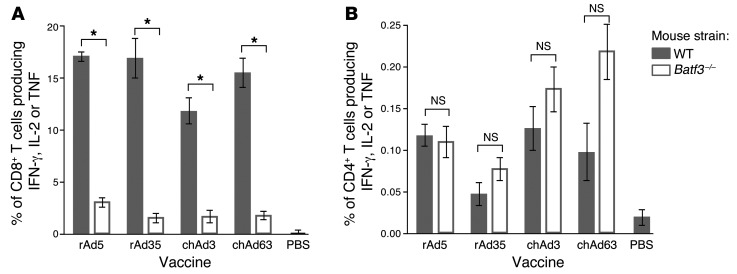
To determine whether specific DC subsets are required for Ag presentation to T cells in vivo, BATF3-deficient (Batf3–/–) mice were used. Deficiency of BATF3 prevents the development of CD8α+ DCs and langerin+ dDCs (24, 25), which are critical for cross-presentation of Ag to CD8 T cells. CD8 T cell responses after vaccination with rAd5, rAd35, chAd3, or chAd63 were significantly lower (~80%) in Batf3–/– mice (Figure 3A); however, Gag-specific CD4 T cell responses were comparable to those of WT mice (Figure 3B). Thus, CD8α+ DCs and/or langerin+ dDCs are essential for optimal CD8 T cell responses after vaccination for all rAds tested.
Figure 3. Ag presentation by DC subsets in vivo after rAd vaccination.
Frequency of (A) CD8 T cells or (B) CD4 T cells from the spleen that produce IFN, IL-2, or TNF in response to AL11 peptide or Gag protein restimulation at 23 days after vaccination in WT or Batf3–/– mice. Mice received rAd expressing Gag at 1 × 10⁸ PU for rAd5, chAd3, or chAd63 and 1 × 10⁹ PU for rAd35. Error bars represent mean ± SEM. *P ≤ 0.05, Mann-Whitney test. Data represents 2 independent experiments (n = 4–5).
rAds induce robust local innate responses in the dLNs.
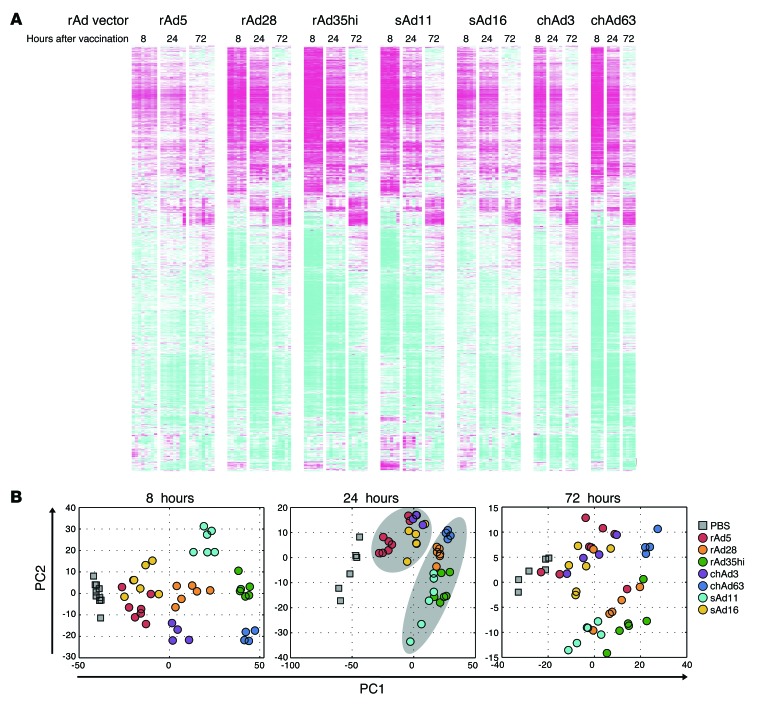
After defining Ag dose, duration, and localization, we next assessed innate immune responses after rAd vaccination. Since rAds may engage multiple innate signaling pathways, gene expression profiling of the dLNs was performed to provide a global and unbiased characterization of innate immunity at the site of T cell priming in vivo (26, 27). A total of 3,888 differentially regulated transcripts responsive to rAd28, rAd35, chAd3, chAd63, sAd11, or sAd16 were identified at 8, 24, or 72 hours after vaccination (Figure 4A and Supplemental Table 1). Principal components analysis revealed that the rAd5, sAd16, and chAd3 vectors and rAd28, rAd35hi, sAd11, and chAd63 vectors grouped together at 8 hours through to 72 hours, with the clearest distinction between these 2 groups at 24 hours (Figure 4B).
Figure 4. Characterization of innate gene activation in vivo after rAd vaccination.
(A) Heat map analysis of all genes that were significantly upregulated or downregulated in the dLNs at 8, 24, and 72 hours after vaccination with each rAd. Colors indicate scaled fold changes (magenta, upregulated; white, no change; cyan, downregulated) compared with the average response in mice vaccinated with PBS control. (B) Principal components analysis of gene expression changes at 8, 24, and 72 hours after rAd vaccination. Grouping of rAd5, sAd16, and chAd3 and grouping of rAd28, rAd35, sAd11, and chAd63 at 24 hours is indicated by the light gray ovals.
Functional analysis of innate gene activation identifies significant modulation of IFN signaling-related genes.
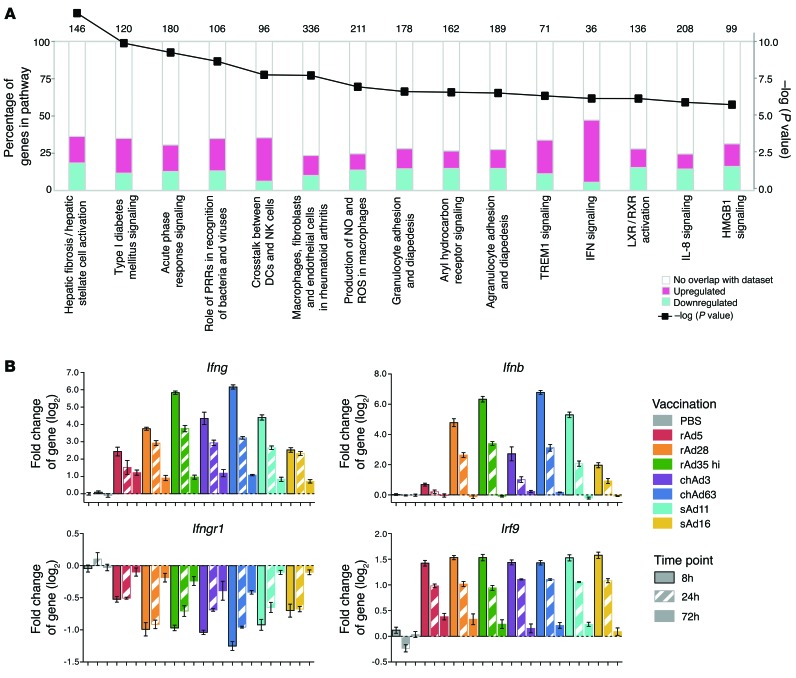
To define differences in innate gene activation between rAds that could lead to different functional outcomes, ingenuity pathway analysis was used to identify known innate pathways that are enriched within the set of rAd-regulated transcripts. In the top 15 pathways identified, IFN signaling was among the most significant (Figure 5A) and included alterations in levels of Ifng, Ifnb, the IFN-γ receptor subunit 1 (Ifngr1), IFN regulatory factor 9 (Irf9), and many other transcripts (Figure 5B). Some IFN-associated transcripts, such as Irf9, were uniformly modulated in response to all rAds, whereas other transcripts, such as Ifng, Ifnb, and Ifngr1, were differentially regulated across rAds (Figure 5B).
Figure 5. Ingenuity pathway analysis of innate gene activation in vivo after rAd vaccination.
(A) Analysis of canonical pathway enrichment in genes differentially expressed 8 hours after rAd vaccination. The left axis (bar plots) shows percentage of genes annotated to a given canonical pathway that were upregulated (magenta) or downregulated (cyan) in dLNs at 8 hours after rAd vaccination. The right axis (line graph) shows log10 probability (P value) that an equivalent number of genes in the indicated pathways could be obtained by randomly selecting gene groups of the same size. Results are shown for the top 15 pathways with P < 1 × 10⁻⁴. Numbers above bars indicate the number of genes included each pathway. (B) Fold change (log2) in expression of type I and type II IFN signaling transcripts Ifng, Ifnb, Ifngr1, and Irf9 over time after vaccination with each rAd compared with the PBS control. Error bars represent mean ± SEM (n = 4–8).
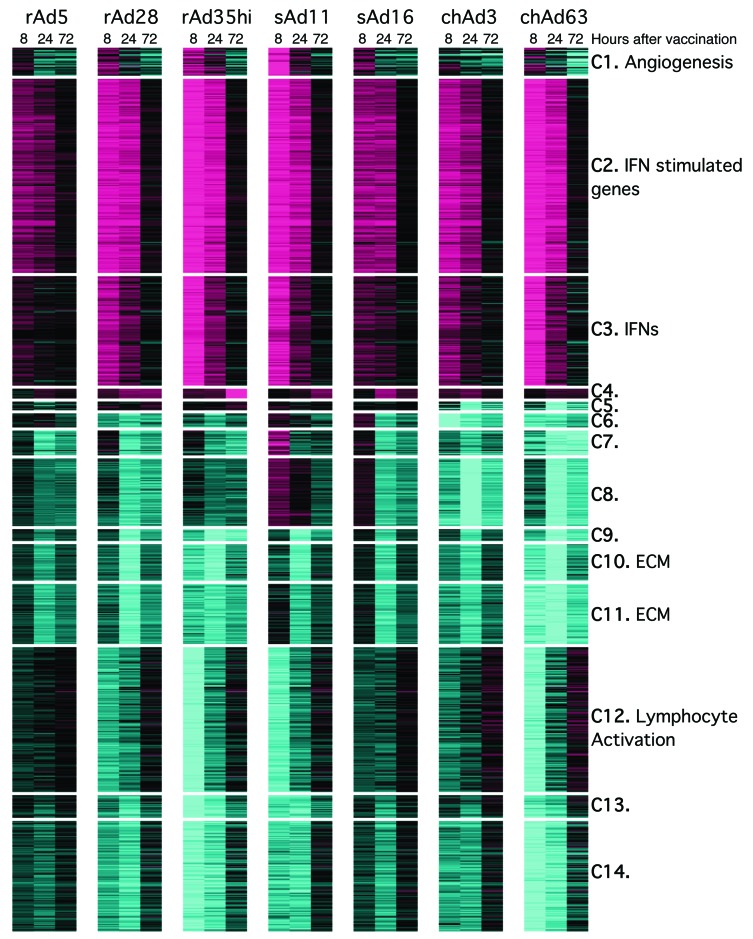
As an alternative approach, gene coexpression modules were identified. These modules are groups of genes that exhibit concordant regulation across rAds and time points and offer an alternative unbiased approach to identify pathways induced by rAd vaccination. Fourteen modules were identified and annotated by functional enrichment analysis (Figure 6 and Supplemental Tables 2 and 3). Additionally, rAd regulation of previously defined coexpression modules (refs. 28, 29, and Supplemental Table 3) was investigated. The most significantly differentially regulated modules from both our study and other studies contained IFNs and IFN-stimulated genes (ISGs) (modules C3 and C2 from our study; module M1.2/1.3/5.12 from Obermoser et al., ref. 28; and module 52 from Jojic et al., ref. 29). Thus, both ingenuity pathway analysis and an unbiased module-based analysis identified IFN signaling as the major innate pathway triggered by rAds.
Figure 6. Definition of modules responsive to rAd vaccination.
Heat map analysis and coexpression clustering of genes that were coordinately upregulated or downregulated at 8, 24, and 72 hours after vaccination with each rAd. Fourteen modules were delineated, and genes comprising each module are described in Supplemental Tables 2 and 3. Colors indicate scaled fold changes (magenta, upregulated; black, no change; cyan, downregulated) compared with the average response in mice vaccinated with PBS control.
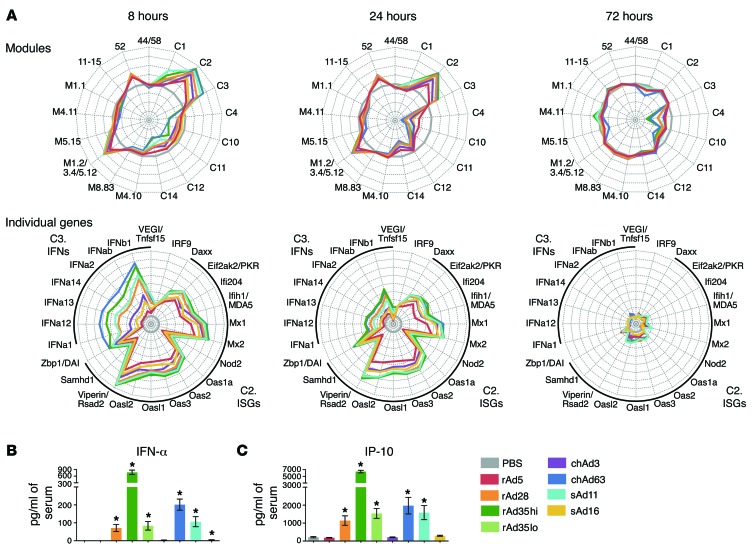
Gene expression kinetics involved robust upregulation of type I and type II IFNs (module C3) early after vaccination at 8 hours, followed by the induction of ISGs by 24 hours (modules C2, M1.2/1.3/5.12, and 52) and near complete resolution by 72 hours. This occurred alongside complex patterns of gene downregulation. Radar plots of module expression and representative genes illustrate these dynamics (Figure 7A). Generally, the rAds regulate a common set of modules and genes but to different degrees. They differed substantially in the magnitude of IFN-driven innate gene induction, with the most protective vectors, rAd5 and chAd3, inducing transcription of such genes to the weakest extent compared with other vectors (Figure 7A).
Figure 7. Module analysis over time after rAd vaccination.
(A) Radar plots comparing the kinetics of innate gene activation: either upregulation or downregulation of each module or individual genes from modules C2 and C3 relative to the PBS control with each rAd at 8, 24, and 72 hours after vaccination. Axes represent (top) maximum = +4, minimum = –4, circles = +4 (outside), +3, +2, +1, 0 (gray circle), –1, –2, –3, and –4 or (bottom) maximum = +8, minimum = –1, circles = +8 (outside), +7, +6, +5, +4, +3, +2, +1, 0 (gray circle), and –1. (B and C) Amount detected in serum of (B) IFN-α at 10 hours and (C) IP-10 at 24 hours after vaccination with rAds. On radar plots, each plot partition represents ± 1 log2 fold change relative to PBS. Error bars represent mean ± SEM. *P ≤ 0.05, for each rAd compared with PBS, Mann-Whitney test. Data in B and C represent 2 independent experiments (n = 4–6).
For protein-level validation of the transcriptional patterns, serum levels of IFN-α and IP-10 were measured, representing a type I IFN from module C3 and an ISG from module C2, respectively. Vaccination with rAd28, rAd35, sAd11, or chAd63 resulted in high serum levels of IFN-α and IP-10 at 10 hours after vaccination, but there was no detectable induction of these cytokines after either rAd5 or chAd3 vaccination (Figure 7, B and C), confirming the relative magnitude of IFN responses across the different rAds.
Last, rAd-regulated transcriptional responses were interrogated for differential dynamics. From the 3,888 rAd-regulated genes (Figure 4A and Supplemental Table 1), 526 upregulated and 758 downregulated genes were identified that were responsive to all rAds but that showed differences in terms of the first time point and/or persistence of induction or repression (Supplemental Table 4). Sets of genes showing similar patterns of differential dynamics among the rAds were overrepresented for several functional annotations (refs. 28, 30, and Supplemental Table 5). IFN response genes exhibited robust induction by all rAds at 8 and 24 hours but showed striking differences in persistence at 72 hours, with sAd16 responses being particularly transient, followed by those of chAd3 and rAd5. A subset of killer cell lectin-like receptor subfamily A (KLRA) genes was identified that was markedly and preferentially induced by rAd5 or chAd3 at 24 hours and later induced by all vectors at 72 hours. These results demonstrate that rAds differ in terms of gene regulation kinetics, although the differences in terms of response magnitudes are more striking.
Local and peripheral responses reflect distinct biological processes but preserve innate hierarchy.
Currently, most human studies profiling innate activation after vaccination in vivo, including previous analysis of responses to the Merck rAd5 (MRKAd5), assess transcriptional changes in whole blood or peripheral blood mononuclear cells (PBMCs), as these are the most accessible tissue for analysis in human subjects (26, 28, 31, 32). Such analyses have provided critical insights, linking systemic innate activation to vaccine-induced responses, but how the systemic responses relate to innate gene activation at local sites of T cell priming has not been assessed directly. To this end, rAd-induced innate immune responses in vivo in dLNs (all rAds) and PBMCs (rAd5 and rAd28) were compared and integrated with human in vivo responses to MRKAd5 (26). As systemic human responses to MRKAd5 peaked at 24 hours (26), the analysis focused on this time point.
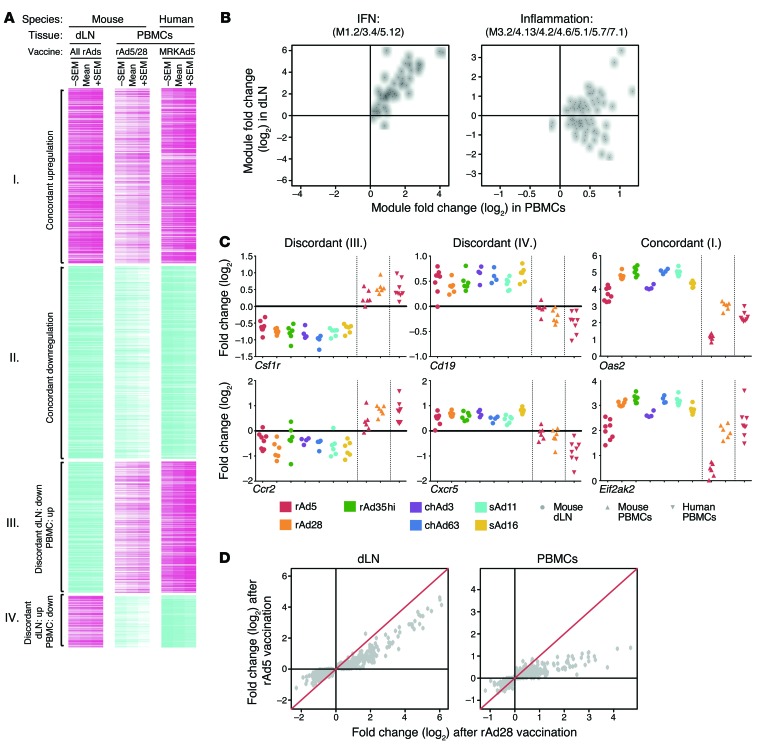
Significant overlap between the 2 compartments was observed. Between the 2,133 and 813 genes upregulated in dLNs and PBMCs, respectively, there was an intersection of 262 genes (P = 3 × 10–47). Between the 3,781 and 818 genes downregulated in dLNs and PBMCs, respectively, there was an intersection of 285 genes (P = 3 × 10–14). Unexpectedly, there also was appreciable overlap among genes upregulated in dLNs and downregulated in PBMCs (77 genes) and genes downregulated in dLNs and upregulated in PBMCs (194 genes). In this manner, 4 clusters of genes based on concordant (groups I and II) or discordant (groups III and IV) regulation in the 2 tissues were defined (Figure 8A).
Figure 8. Comparison of local (dLNs) and systemic (PBMCs) innate gene activation.
(A) Heat map of 818 genes significantly responsive to rAd vaccination in dLNs or PBMCs, for mice or humans, at 24 hours after vaccination. Genes are clustered into concordantly (group I, 262 genes; group II, 285 genes) or discordantly (group III, 194 genes; group IV, 77 genes) regulated genes. Colors indicate scaled fold changes (magenta, upregulated; white, no change; cyan, downregulated) for the mean – SEM, mean, and mean + SEM response compared with the average response to PBS control (mice) or levels before vaccination. (B) Median expression fold changes across all vectors and species in dLNs plotted against the median expression fold changes in PBMCs for all genes comprising the IFN response module or inflammation module. Each point represents a unique gene. (C) Fold changes in gene expression as compared with PBS control mice for select genes that are discordantly (Csf1r and Ccr2 or Cd19 and Cxcr5) or concordantly (Oas2 and Eif2ak2) regulated. (D) Average gene expression fold changes (compared with PBS) induced by rAd5 are plotted against fold changes induced by rAd28 in dLNs or PBMC samples for all genes that were found to be concordantly regulated between the 2 tissues. Each point represents a unique gene. The red line indicates y = x.
Concordantly upregulated genes (group I) were most strongly enriched for IFN-related modules (Table 1; M1.2/3.4/5.12; ref. 28), with nearly every gene from groups I to IV with this annotation falling into group I (Figure 8B). Of note, both group I and group III were strongly enriched for inflammatory module genes (Table 1; M3.2/4.13/4.2/4.6/5.1/5.7/7.1; ref. 28). While nearly every gene from groups I to IV with this annotation was upregulated in the PBMCs, they were split evenly between being upregulated and downregulated in dLNs (Figure 8B). These data highlight a complex relationship between vaccine-induced innate immune responses that are measured locally (in the dLNs, at the site of Ag presentation) and systemically (in PBMCs). While peripheral induction of IFN responses reflects induction of such responses in the dLNs, induction of inflammatory genes in PBMCs may actually be opposite of local responses.
Table 1. Gene enrichment analysis for clusters defined by tissue-specific expression.
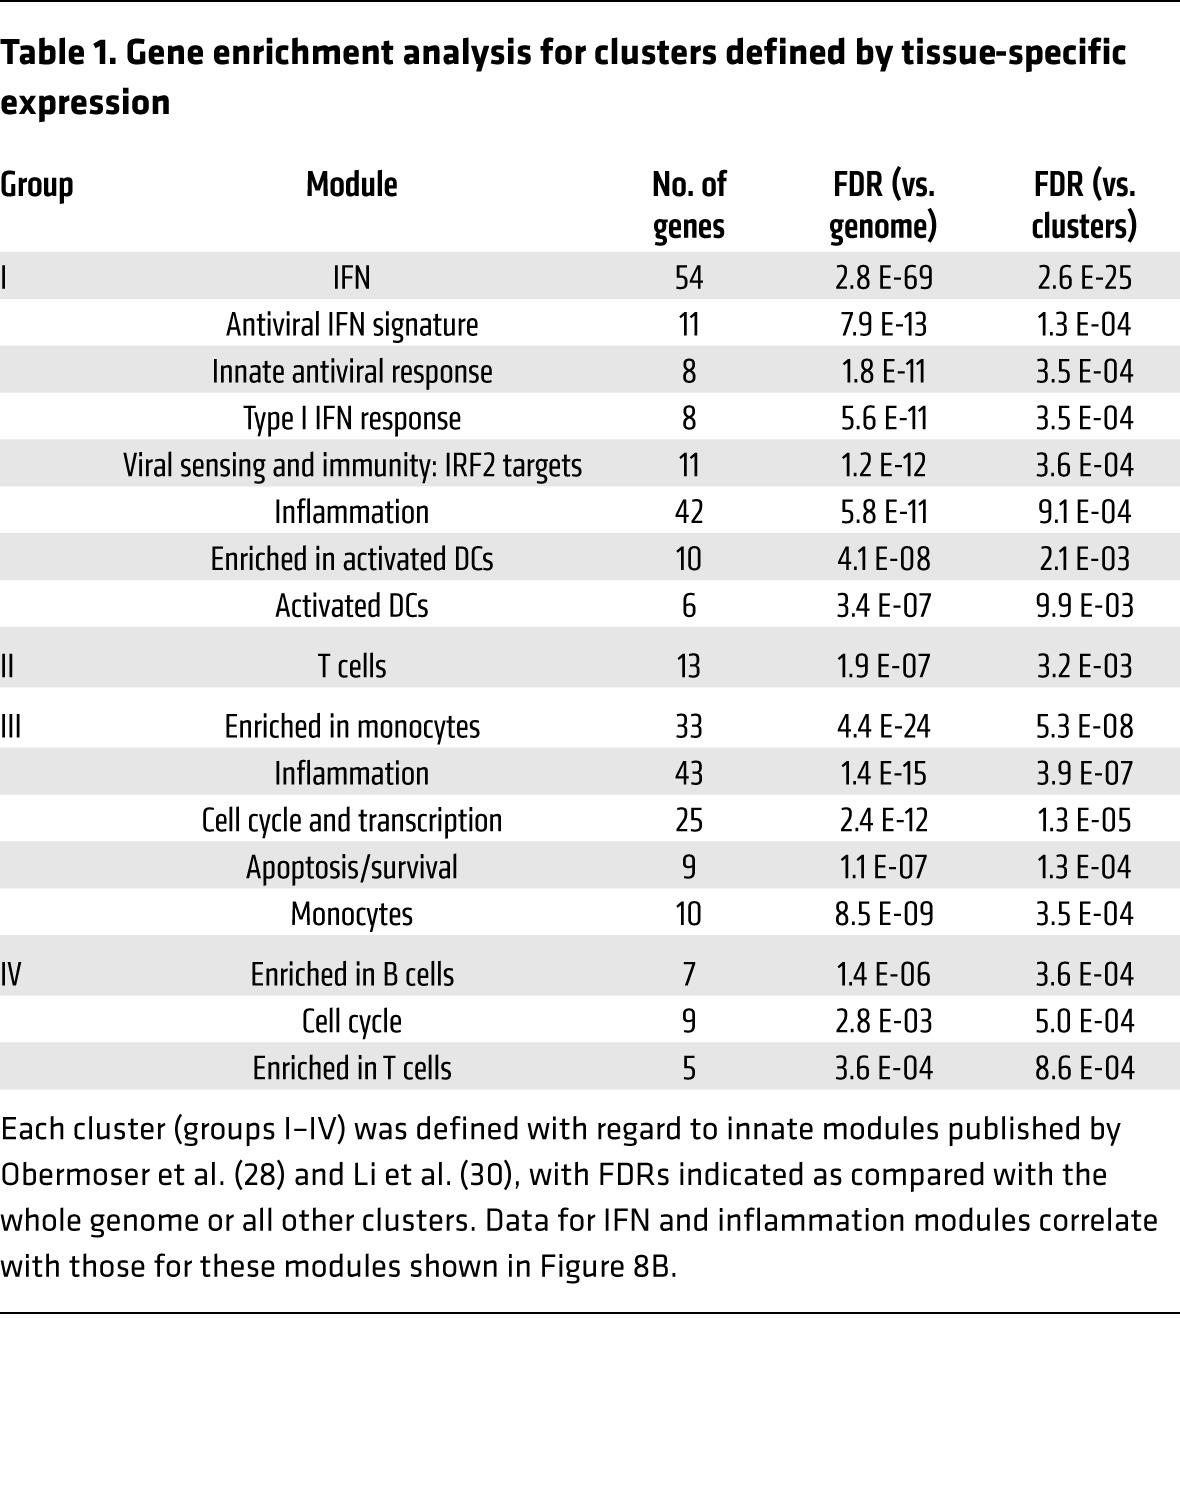
Significant overrepresentation of cell-type associated modules was observed in discordantly regulated groups (III and IV). Genes upregulated in PBMCs but downregulated in dLNs (group III) were enriched for associations with monocytes (Table 1), including colony-stimulating factor 1 receptor (Csf1r) and Ccr2 (Figure 8C), consistent with decreased proportions of monocytes found in the dLNs after rAd vaccination at 24 hours (Supplemental Figure 4A). Genes downregulated in PBMCs but upregulated in dLNs (group IV) were enriched for associations with B cells (Table 1), including Cd19 and Cxcr5 (Figure 8C), consistent with increased proportions of B cells after rAd vaccination (Supplemental Figure 4A). This illustrates that a discordant transcriptional response can result from reciprocal trafficking between 2 compartments, with dilution of monocytes but recruitment of B cells to the dLNs after rAd vaccination.
Finally, the hierarchy of murine responses to rAds for the 547 concordantly regulated genes (groups I and II) was compared in the 2 compartments for rAd5 and rAd28. While responses to the 2 vectors correlated in both tissues (with correlation coefficients of RdLN = 0.95, RPBMC = 0.86), responses to rAd5 were nearly uniformly weaker than responses to rAd28 in both dLNs (P = 1.5 × 10⁻⁹) and PBMCs (P = 2 × 10–20) (Figure 8, C and D, in which most points are below the red line). Even though transcriptional analysis of dLNs and PBMCs detects a mixture of overlapping and distinct biological processes, these results demonstrate that profiles from both tissues can be used to comparably rank the innate stimulatory potency of different rAds, although IFN responses may be more pronounced in the local environment.
The magnitude of innate responses correlate inversely with Ag expression.
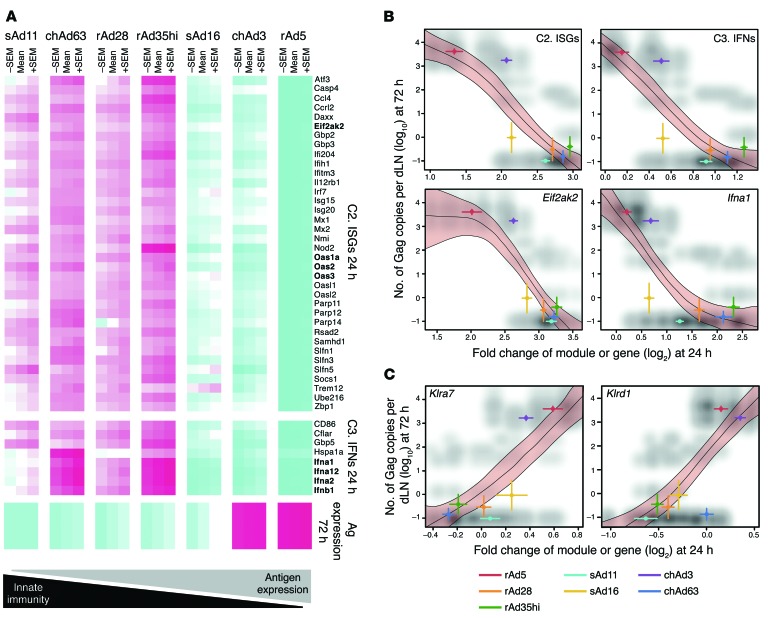
We then analyzed whether expression of specific genes or modules correlated with specific outcomes, such as Ag expression, magnitude of CD8 T cell immunity, and protection. Although a number of associations between innate and adaptive immunity were detected, the most striking correlation was induction of modules C2 and C3 at 24 hours after vaccination and Ag expression at 72 hours after vaccination (r < –0.75, P < 1 × 10–28, ANOVA; Supplemental Table 6). Persistent Ag expression correlated inversely with module C2, consistent with antiviral mechanisms that are controlled by many ISGs, such as 2′-5′-oligoadenylate synthetase 1a, 2, or 4, which activates RNase L to eliminate viral transcripts, and eukaryotic translation initiation factor-α kinase 2 (EIFAK2; also known as PKR), which inhibits protein synthesis (Figure 9, A and B, and refs. 33, 34). Persistent Ag expression also correlated inversely with module C3, containing the type I IFN genes Ifna1, Ifna2, Ifna12, and Ifnb1 (Figure 9, A and B), and with the IFN-related M1.2/3.4/5.12 and 52 modules defined by other studies (Supplemental Table 6). Thus, more robust upregulation of IFN-driven modules at 24 hours was associated with impaired Ag expression at 72 hours after rAd vaccination, suggesting that IFN-driven signaling reduced Ag expression.
Figure 9. Correlation of Ag expression with innate gene expression.
(A) Heat map representation of genes from module C2 and C3 that exhibit differential regulation at 24 hours that is significantly negatively associated with Ag expression at 72 hours after rAd vaccination in the dLNs. Colors indicate scaled fold changes (magenta, upregulated; white, no change; cyan, downregulated) for the mean – SEM, mean, and mean ± SEM response compared with the average response in mice vaccinated with PBS control. (B) Scatter plots of negative correlations between Ag expression at 72 hours and module C2 or genes derived from C2, such as Eif2ak2, and with module C3 or genes derived from C3, such as Ifna1, with gene expression assessed at 24 hours. (C) Scatter plots of positive correlations between Ag expression at 72 hours and NK-related gene expression (Klra7 and Klrd1) at 24 hours. Red shading bounded by black lines represents 99% confidence intervals (from stratified bootstrap resampling of spline fits between innate gene expression and Ag), colored lines in x and y planes are SEM for each vaccine group (for genes or Ag), and shading in gray scale represents the scatter plot for combining all possible innate data with all possible Ag data for each vector.
The full complement of innate immune responses associated with differences in rAd Ag expression was then determined by integrating the Ag expression data with all genes on the microarrays. This analysis identified 4,285 genes exhibiting significant (false discovery rate [FDR] <1%) associations with Ag expression (Supplemental Table 7). Module (28, 30) and immunologically focused MSIGDB (35) enrichment analyses identified 773 modules and gene sets that were significantly (FDR <1%) overrepresented in genes positively or negatively associated with Ag expression (Supplemental Table 8). The top 10 enriched modules and gene sets (FDR = 10–61 to 10–38) involve negative associations between Ag expression and IFN response or responses to viruses or viral vectors. While this analysis revealed that many biological processes are associated with Ag expression, it showed that the negative association with the IFN response is the strongest.
Integrating the 4,285 genes associated with Ag expression (Supplemental Table 7) with the 3,888 differentially expressed genes (Figure 4A and Supplemental Table 1) revealed that a small group of rAd-induced genes were positively correlated with Ag expression. Over half of these genes were associated with NK cell functions, including KLRA genes Klra7 (Figure 9C); Klra4, Klra15, Klra16, and Klra23 (D.E. Zak, unpublished observations); Klrd1 (Figure 9C); and granzyme M (D.E. Zak, unpublished observations). This suggests that high and persistent Ag expression by rAd5 and chAd3 may not only result from attenuated IFN induction by these vectors but also from specific and positive regulation of the NK cell compartment. Accordingly, the impact of NK cells on induction of CD8 T cell immunity with rAd5 and rAd35 vaccination was assessed through depletion of NK1.1+ cells (Supplemental Figure 4B), but this did not affect CD8 T cell responses (Supplemental Figure 4C). Thus, there is highly specific regulation of NK-associated genes, but the functional implication of this observation is unclear.
Exogenous induction of type I IFN by poly I:C administration limits Ag expression and CD8 T cell immunity.
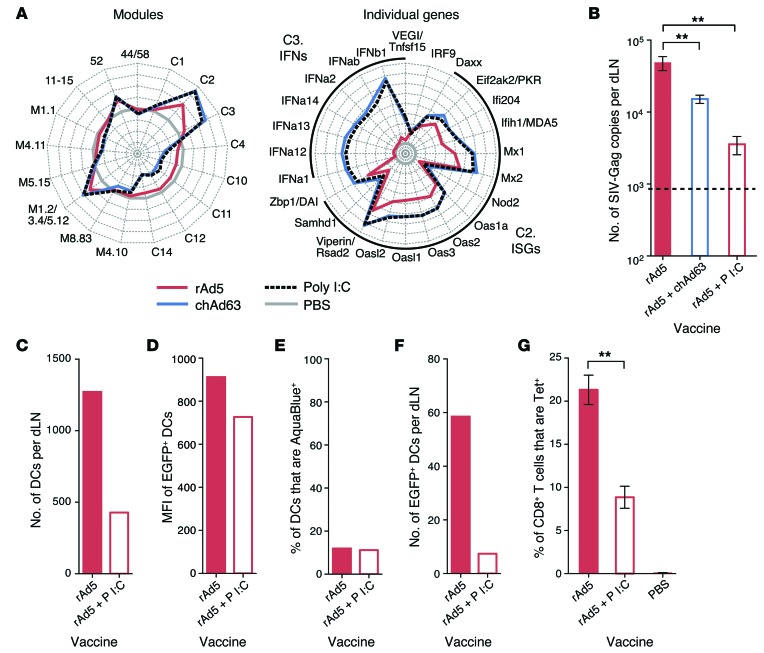
Due to the inverse correlation between type I IFN induction and Ag expression following rAd vaccination, we determined whether type I IFN directly affects Ag expression and CD8 T immunity. Since rAd5 had the lowest induction of type I IFN and highest expression of Ag, mice were vaccinated with rAd5 alone or received codelivery of rAd5 with chAd63 containing an irrelevant Ag (HIV-Env) or the adjuvant polyinosinic/polycytidylic acid I:C (poly I:C), both potent inducers of type I IFN in vivo (Figure 10A). Codelivery of chAd63 or poly I:C significantly reduced Gag transcript expression (Figure 10B). Codelivery of poly I:C also reduced the number of total DCs in dLNs (Figure 10C) and their MFI for EGFP (Figure 10D), while there was no change in the frequency of nonviable cells (Figure 10E). Thus, exogenous induction of type I IFN by codelivery of poly I:C with rAd5 decreased DC recruitment and Ag expression on a per cell basis, leading to fewer Ag-loaded DCs in the dLNs (Figure 10F) and reducing the peak CD8 T cell response (Figure 10G).
Figure 10. Effect of enhancing type I IFN signaling on Ag expression and CD8 T cell immunity.
(A) Radar plots of modules and individual genes within modules C2 and C3 at 24 hours after vaccination with rAd5, chAd63, or poly I:C. Axes represent (left) maximum = +4, minimum = –4, circles = +4 (outside), +3, +2, +1, 0 (gray circle), –1, –2, –3, and –4 or (right) maximum = +8, minimum = –1, circles = +8 (outside), +7, +6, +5, +4, +3, +2, +1, 0 (gray circle), and –1 log2 fold change relative to PBS. (B) Ag expression at 40 hours after vaccination with 1 × 10⁷ PU rAd5 with or without 1 × 10⁸ PU chAd63 or 50 μg poly I:C. (C) The number of total CD11c+ DCs, (D) the MFI of EGFP in EGFP+ DCs, (E) the frequency of nonviable CD11c+ DCs, and (F) the number of live EGFP+ CD11c+ DCs per dLN at 24 hours after vaccination with 5 × 10⁸ PU rAd5-EGFP with or without 50 μg poly I:C. (G) Tetramer+ CD8+ T cell responses at day 28 after vaccination with 1 × 10⁷ PU rAd5 with or without 50 μg poly I:C. Error bars represent mean ± SEM. **P ≤ 0.01, Mann-Whitney test. The dashed line indicates the LOD. Data represent (B and G) 3 independent experiments with n = 3–6 or (C–F) 5 to 10 pooled dLNs per group.
Abrogation of type I IFN signaling increases Ag expression and accelerates induction of CD8 T cell immunity.
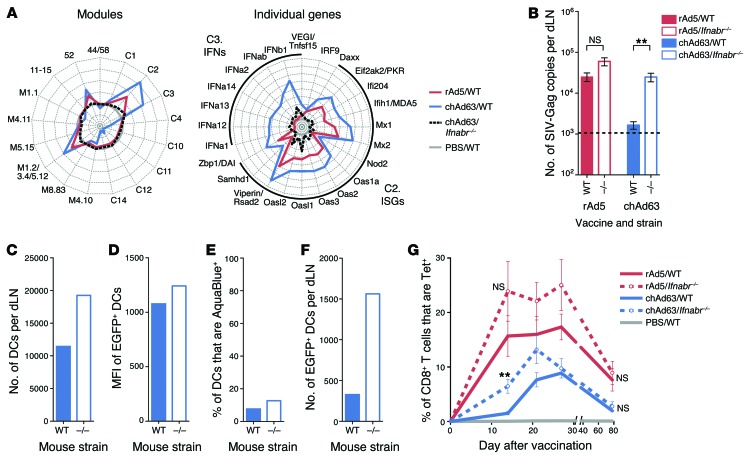
To further examine how endogenous type I IFN influences Ag expression and CD8 T cell immunity, mice deficient in IFN-αR1 (Ifnabr–/– mice) (36), a receptor subunit essential for type I IFN signaling, were vaccinated with rAd5 or chAd63, since these rAds showed the largest difference in the magnitude of their innate immune response. Activation of innate modules and genes was markedly higher after chAd63 vaccination compared with that after rAd5 vaccination in WT mice (Figure 11A). Such responses were strikingly reduced in Ifnabr–/– mice relative to those in WT mice after chAd63 vaccination, although low-level residual induction of individual IFN genes and ISGs in modules C2 and C3 was still evident relative to the PBS control (Figure 11A). Expression of Gag transcript was similar between WT and Ifnabr–/– mice after rAd5 vaccination, as expected based on the limited induction of IFNs and ISGs by rAd5, but Ifnabr–/– mice produced significantly more transcript than WT mice after chAd63 vaccination (Figure 11B). A higher number of total DCs in the dLNs (Figure 11C) with higher EGFP MFI (Figure 11D) was observed in dLNs from Ifnabr–/– mice, while the frequency of nonviable cells was similar in both strains (Figure 11E), again suggesting that type I IFN limits DC recruitment and Ag expression, without affecting cell viability. Consistent with this, Ifnabr–/– mice had consistently higher numbers of EGFP+ DCs in the dLNs after chAd63 vaccination (Figure 11F).
Figure 11. Effect of abrogating type I IFN signaling on Ag expression and CD8 T cell immunity.
(A) Radar plots of modules and individual genes within modules C2 and C3 24 hours after vaccination of WT or Ifnabr–/– mice with rAd5 or chAd63. Axes represent (left) maximum = +4, minimum = –2, circles = +4 (outside), +3, +2, +1, 0 (gray circle), –1 and –2, or (right) maximum = +8, minimum = –1, circles = +8 (outside), +7, +6, +5, +4, +3, +2, +1, 0 (gray circle), and –1 log2 fold change relative to PBS. (B) Ag expression at 40 hours after vaccination of WT or Ifnabr–/– mice with 1 × 10⁸ PU rAd5 or chAd63. (C) The number of total CD11c+ DCs per dLN, (D) the MFI of EGFP in EGFP+ DCs, (E) the frequency of nonviable CD11c+ DCs, and (F) the number of live EGFP+ CD11c+ DCs at 24 hours after vaccination of WT or Ifnabr–/– mice with 1 × 10¹⁰ PU of chAd63-EGFP. (G) Tetramer+ CD8+ T cell responses after vaccination of WT or Ifnabr–/– mice with 3 × 10⁷ PU rAd5 or chAd63. Error bars represent mean ± SEM. **P ≤ 0.01, Mann-Whitney test. The dashed line indicates the LOD. Data represent (B and G) 3 independent experiments with n = 3–6 or (C–F) 5 to 10 pooled dLNs per group.
In concordance with the ability of rAds to induce type I IFN in vivo, CD8 T cell responses induced by rAd5 were not significantly different between WT and Ifnabr–/– mice but were significantly higher in Ifnabr–/– mice early (up to day 21) after chAd63 vaccination (day 14; Figure 11G). Of note, such responses were comparable at day 28 and once memory responses were established (day 56) (Figure 11G). These data show that type I IFN signaling with rAds reduces Ag expression and alters the kinetics of CD8 T cell immunity but is dispensable for CD8 T cell memory.
Signaling through distinct PRRs can promote or suppress adaptive immunity after rAd vaccination.
To identify specific PRRs potentially responsible for the differences in rAd-induced innate immune responses and type I IFN induction, mice deficient in 2 major adaptor proteins, MAVS and STING, were used. MAVS mediates RLR signaling, whereas STING localizes to the membrane of the endoplasmic reticulum, where it is indirectly activated by cytosolic DNA via the action of DNA sensors, such as cyclic GMP-AMP synthase (37–39), or directly activated by bacterially generated cyclic dinucleotides (39, 40) and may detect viral fusion events (41). Recent in vitro studies have shown that STING activates innate pathways after adenoviral infection (42, 43) and mediates a key innate signaling pathway for sensing a variety of viruses with dsDNA or RNA genomes (44).
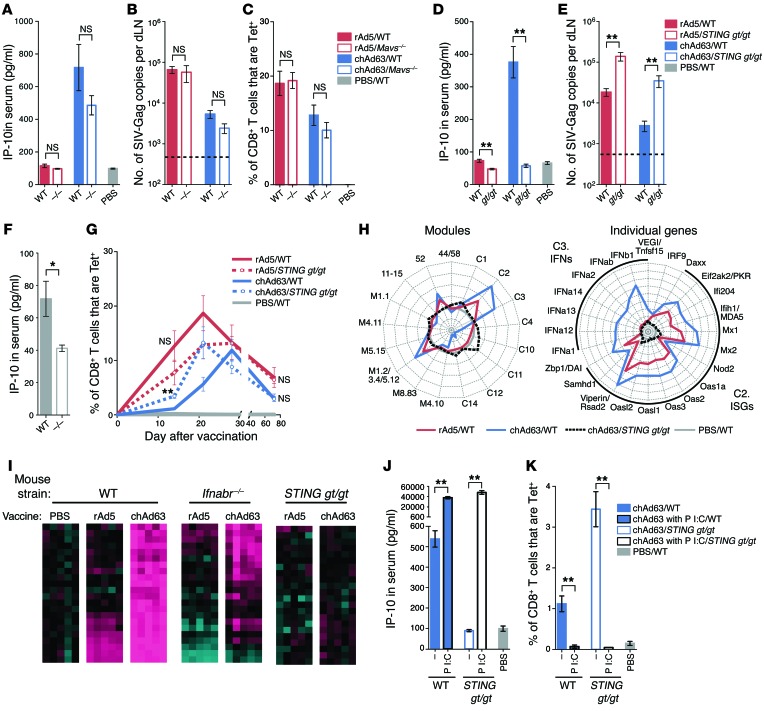
Mice were vaccinated with rAd5 or chAd63 at a low dose (3 × 10⁷ PU) to focus on innate regulation of CD8 T cell responses in the context of more limiting Ag, as high doses of rAds can mask the influence of innate pathways in mice (18, 19). Mavs–/– mice did not differ significantly from WT mice in terms of IP-10 production (Figure 12A), Ag expression (Figure 12B), or CD8 T cell response magnitude (Figure 12C) with either rAd5 or chAd63. In contrast, IP-10 production was abrogated after chAd63 vaccination of mice with a missense inactivating point mutation in STING (Tmem173gt/gt mice, herein referred to as STING gt/gt mice) (ref. 45 and Figure 12D), and Ag expression was significantly higher as compared with that in WT mice after vaccination with chAd63 (Figure 12E). Surprisingly, serum levels of IP-10 were also significantly lower and Ag expression was significantly higher in STING gt/gt mice after rAd5 vaccination (Figure 12, D and E). This may be due to the lower baseline IP-10 levels in naive STING gt/gt mice (Figure 12F), which may render such mice more permissive for Ag expression with viral vectors in general. IP-10 production was also abrogated in STING gt/gt mice after rAd28 and rAd35 vaccination (Supplemental Figure 5), demonstrating that a requirement for STING in innate sensing is generalizable to other rAds.
Figure 12. Effect of PRR signaling on innate immunity, Ag expression, and CD8 T cell responses.
(A) IP-10 production in serum (14 hours), (B) Ag expression in the dLNs (40 hours), and (C) tetramer+ CD8+ T cell responses in peripheral blood (28 days) after vaccination of WT or Mavs–/– mice with 3 × 10⁷ PU of rAd5 or chAd63. (D) IP-10 and (E) Ag expression after vaccination of WT or STING gt/gt mice. (F) IP-10 in naive serum. (G) CD8+ T cell responses after vaccination of WT or STING gt/gt mice. (H) Radar plots of modules and individual genes at 24 hours after vaccination of WT mice with rAd5 or WT and STING gt/gt mice with chAd63. Axes represent (left) maximum = +4, minimum = –2, circles = +4 (outside), +3, +2, +1, 0 (gray circle), –1 and –2 or (right) maximum = +8, minimum = –1, circles = +8 (outside), +7, +6, +5, +4, +3, +2, +1, 0 (gray circle), and –1 log2 fold change relative to PBS. (I) Heat map analysis of IFN-driven genes in Ifnabr–/– and STING gt/gt mice after rAd5 or chAd63 vaccination. Colors indicate scaled fold changes (magenta, upregulated; black, no change; cyan, downregulated) compared with the average response in PBS control. (J) IP-10 and (K) CD8+ T cell responses after chAd63 vaccination with or without 50 μg poly I:C. Error bars represent mean ± SEM. *P ≤ 0.05, **P ≤ 0.01, Mann-Whitney test. Dashed lines indicate LOD. Data represent 3 independent experiments (n = 3–6).
The kinetics of primary CD8 T cell responses were accelerated after chAd63 vaccination in STING gt/gt mice (Figure 12G), similar to that observed after vaccination of Ifnabr–/– mice (Figure 11G). However, STING was dispensable for early rAd5-induced (Figure 12G) and rAd28-induced (Supplemental Figure 6) CD8 T cell responses, highlighting that STING’s impact can differ across rAds. STING was also dispensable for CD8 T cell memory induction (Figure 12G), protective capacity (Supplemental Figure 7, A–D), and expansion in response to secondary Ag using a peptide subunit vaccine to boost (Supplemental Figure 7E), providing additional evidence that the functional potential of such cells is independent of STING signaling.
Finally, we directly compared gene expression in WT, Ifnabr–/–, and STING gt/gt mice after rAd vaccination to identify STING-independent IFN-driven pathways. Unexpectedly, the profile of STING gt/gt mice for all IFN-driven modules and the individual genes identified by module-based analysis was indistinguishable from that of mice administered PBS control (Figure 12H). This contrasted with the profile of Ifnabr–/– mice, in which innate immune responses after vaccination with rAds were not completely suppressed, resulting in residual gene expression (Figure 12I). STING gt/gt mice therefore have a more profound deficiency in rAd-induced innate immune responses than Ifnabr–/– mice. Nevertheless, STING gt/gt mice were capable of type I IFN production through STING-independent innate pathways. Bypassing STING signaling through coadministration of poly I:C with chAd63 induced robust IP-10 production in STING gt/gt mice (Figure 12J) and limited the peak CD8 T cell responses in STING gt/gt mice (Figure 12K). Collectively, these data suggest that STING is a proximal and dominant innate sensor of rAds in vivo and acts upstream of IFN production.
Discussion
Vaccines that induce robust and durable CD8 T cells will be critical for preventative and therapeutic vaccines against a range of infections and tumors. In this regard, due to their safety profile, potency, manufacturing scalability, and number of different serotypes, rAds provide a useful platform for clinical translation. An important aspect of optimizing immunity and protection with rAds is the striking variability in potency among different serotypes. The data presented here, showing that CD8 T cell immunity with a variety of human, chimpanzee, and simian rAds is correlated with the amount and duration of Ag expression, provide a mechanistic basis for understanding differences among the serotypes. Remarkably, there was an inverse correlation between the amount of Ag expressed and the magnitude of innate immunity and, specifically, pathways driven by type I IFN and STING signaling.
This study used a systems biology approach to assess innate mechanisms of rAd immunogenicity in the dLNs, which demonstrated that rAds differ profoundly in terms of the innate response magnitude, dynamics, and pathways triggered. The dLNs are generally not accessible for profiling in humans, in which similar analyses during clinical vaccine trials have relied on profiling of PBMCs (26, 28, 31, 32). To put the current study in the context of this growing body of work, murine dLN responses were integrated with in vivo PBMC responses measured after vaccination with rAds in mice and humans (26). The induction of IFN responses and the hierarchy of innate stimulation among rAds were found to be consistent between dLNs and the periphery, but important differences were also observed, particularly in transcripts associated with specific cell types. This illustrates that reciprocal cellular trafficking, in the case of this study with monocytes and B cells, can greatly affect the gene expression profile of different tissues. Given the similarities and differences observed across the 2 compartments, the results highlight key considerations for the mechanistic interpretation of peripheral transcriptomes defined in human studies.
The systems biology approach was complemented by an assessment of the role of DC subsets in CD8 T cell responses. Indeed prior studies have shown that rAd-transfected hematopoietic and nonhematopoietic cells control expansion and maintenance of CD8 T cells, respectively, after rAd5 vaccination (20, 46). Here, we show that Batf3 expression, which is required for generation of CD8α+ DCs and langerin+ dDCs (24, 25), is critical for induction of optimal CD8 T cell responses to all rAds tested. This highlights a key commonality across rAds with regard to mechanisms of Ag presentation and CD8 T cell priming.
In terms of innate signaling pathways, type I IFN-related genes were upregulated by many of the rAd vaccines in vivo, but the corresponding rAd-derived pathogen-associated molecular patterns (PAMPs) that trigger this pathway remain to be identified. A number of candidate PAMPs have been suggested for adenoviruses, including virally associated RNAs (47), CpG motifs (48), and the adenoviral DNA itself (21). A key finding shown here was that STING acts as a PRR for all human rAds (rAd5, rAd28, and rAd35) and most notably chAd63. Indeed for rAd5 and chAd63, the IFN-driven gene expression profile was abrogated entirely in the absence of STING, leading us to hypothesize that STING acts as a proximal and dominant PRR after vaccination with certain rAds. STING likely senses rAd-derived DNA exposed as the viral particles uncoat in transfected cells (37, 38, 41–43). We speculate that accessibility of rAd-derived DNA to DNA sensors may differ due to different uncoating processes across adenoviral serotypes, leading to differential ISG induction observed in our study. Once activated by way of an unidentified DNA sensor, STING mediates phosphorylation of IRF3 to predominantly drive IFN production (49). Signaling via TLR- and RLR-triggered pathways drives IFN production through the action of IRFs but also drives proinflammatory cytokine production through NF-κB activation, and these pathways augment CD8 T cell immunity after rAd vaccination (16, 18–20). The relative threshold and efficiency for driving IFN production and subsequent ISG activation across STING, RLR, and TLR pathways is not known. The impact of STING, RLR, and TLR signaling may also differ across different cell types, due to differential expression of each receptor and their downstream adaptors. While PRR signaling in the transfected cell is important, cells that phagocytose defective rAd particles may also sense PAMPs, and IFN production by a transfected cell leads to further production by surrounding cells, which results in the overall antiviral response. Thus, the data presented here and from other studies show that innate immunity following rAd vaccination depends on the interplay of STING-, RLR-, TLR-, and possibly other PRR-mediated signaling pathways, in both hematopoietic and nonhematopoietic cells, both directly transfected by rAd and indirectly exposed. Remarkably, durable and functional CD8 T cell immunity appears independent of each of these intracellular innate signaling pathways in isolation and suggests that redundancy and crosstalk is critical to PRR-mediated regulation of innate and adaptive immunity.
A broader finding of this study is that early type I IFN production is not a general requirement for viral vector-induced CD8 T cell immunity. Prior studies have shown that type I IFN can signal CD8 T cells directly during the expansion phase to promote their survival in memory populations (50, 51). It is required for induction of CD8 T cell responses with certain infections, such as lymphocytic choriomeningitis virus (52, 53), and this effect was recently shown to be through type I IFN signaling to CD8 T cells in the early phases of proliferation, which prevents expression of the NCR1 receptor that would otherwise facilitate NK cell–mediated killing of these cells (54, 55). In contrast, infection-induced CD8 T cell responses can be partially or entirely independent of type I IFN, such as with vesicular stomatitis virus, L. monocytogenes, and vaccinia virus (52, 53). During vaccination, the presence of type I IFN typically enhances induction of CD8 T cell responses, such as with the modified vaccinia virus Ankara, an attenuated viral vaccine (56), and with protein subunit vaccination, in which adjuvants that induce robust IFN increase Ag uptake, promote cross-presentation, and thereby enhance T cell immunity (22, 57, 58). In contrast, the data presented herein demonstrate that type I IFN signaling limits Ag expression with rAd vaccination and can limit the initial expansion of CD8 T cell responses. These data suggest that rAd vaccination mimics natural viral infection, in which IFN-driven antiviral mechanisms limit viral replication through suppression of transcription or translation or through active mechanisms of elimination, such as NK-mediated killing. Other studies have shown that in vitro infection of human DCs with rAd28 and rAd35, but not rAd5, leads to increased susceptibility of those DCs to NK cell–mediated killing and loss of transgene expression (59). We observed differential expression of NK-related markers in the dLNs after rAd vaccination, but depletion of NK cells during rAd5 and rAd35 vaccination had no effect on CD8 T cell responses. Furthermore, we show that robust induction of type I IFN production suppresses Ag translation in DCs rather than affecting DC viability after rAd vaccination. Thus, while type I IFN signaling is not required for induction of CD8 T cell immunity with rAds, the role of NK cells in vivo remains unclear.
STING-mediated signaling has also recently been shown to affect induction of CD8 T cell responses to infection. STING gt/gt mice challenged with L. monocytogenes exhibited similar primary but augmented secondary CD8 T cell responses to Ag stimulation (60). We did not observe such a difference with secondary Ag exposure after rAd vaccination, either with live infection or with a peptide/poly I:C boost. We also show that STING signaling had a striking effect on Ag load during priming of rAd vaccination, but this differs from the L. monocytogenes infection model, in which no effect on pathogen load is seen (45). STING may be activated directly by cyclic dinucleotides with cytosolic bacterial infection (45) but requires the action of a DNA sensor for viral DNA (39), with both mechanisms having potentially different thresholds for activation, highlighting that STING may have subtly different roles in bacterial and viral models. Differences in the impact of STING signaling on induction of CD8 T cell immunity between listerial infection and rAd vaccination settings may reflect the threshold of the innate response induced in combination with the amount, kinetic, and localization of Ag produced in each model.
In conclusion, the data presented here provide fundamental criteria for downselection from the array of available adenoviral serotypes to clinical development of rAd vaccines. Historically, selection for rAds has been based on a variety of factors, which include potency in preclinical animal models, low seroprevalence in humans (2, 3, 7, 8), and strong induction of innate cytokine in in vitro culture conditions (3). Indeed, human in vitro studies show that type I IFN production by DCs is strikingly higher with rAd35 than rAd5 (61) and rAd35 also induces higher levels of innate serum cytokines than rAd5 in nonhuman primates (15). However, in all species tested, rAd5 induces T cell responses of significantly greater magnitude compared with rAd35. Here, we show that robust in vitro and in vivo innate cytokine production is not predictive for rAd potency in vivo, and there is a broadly applicable inverse relationship between innate immunity and Ag expression across human-, chimpanzee-, and simian-derived rAds. The finding that chAd3 and rAd5 induce comparable CD8 T cell immunity through similar innate mechanisms provides strong evidence that chAd3 may be an appropriate replacement for rAd5, which would be important for use in regions with high natural seroprevalence for rAd5. Indeed, chAd3 is now being tested for prevention of Ebola in Africa, based on nonhuman primate studies that show that rAd5 and chAd3 confer a high level of protection (11, 62). Generation of a diverse collection of rAds for clinical use is important, as rAds are lead vaccine candidates for several infections and therapeutic tumor vaccines, but rAd administration induces Ad-specific antibodies that can limit the efficacy of subsequent vaccination with a homologous serotype (63). Therefore, development of a serotypically diverse array of rAds with understanding of their mechanisms of action will be critical for optimizing rAd use in multiple vaccine strategies.
Methods
Mice.
C57BL/6 WT, Batf3–/–, and STING gt/gt mice were obtained from The Jackson Laboratory. Ifnabr–/– mice were originally derived by Müller et al. (36). Mavs–/– mice were a gift from Zhijian Chen (University of Texas Southwestern, Dallas, Texas, USA) and were backcrossed to C57BL/6 mice for 9 generations at Seattle BioMed. All mice used in the present experiments were housed at the Vaccine Research Center Biomedical Research Unit. Mice were 6 to 12 weeks old at the time of vaccination.
Vectors, vaccinations, and listerial infections.
Vectors were grown and purified as described previously (9). rAd5, rAd28, rAd35, sAd11, and sAd16 expressing SIV-Gag were obtained from GenVec Inc. chAd3 and chAd63 backbones were obtained from Okairos Srl (6, 7). All rAds were rendered replication deficient through targeted deletion of the E1 adenoviral gene; the E3 gene was additionally deleted in chAd3 and chAd63, and both the E3 and E4 genes were additionally deleted in rAd5. The target transgene was inserted into the E1 locus for all constructs under the control of the CMV promoter. All vectors contained a codon-optimized version of Gag/Pol from SIV strain mac239 or EGFP. Poly I:C was formulated with poly-lysine and carboxymethylcellulose (64) to increase in vivo stability and used at a dose of 50 μg, given in the same inoculum as the rAd5.
Attenuated L. monocytogenes (ΔactA, ΔintB) expressing Gag from SIV strain mac239 was used for infectious challenge. L. monocytogenes expressing Gag was provided by ANZA Therapeutics and administered intravenously at a dose of 2 × 10⁷ colony-forming units in a volume of 300 μl. Spleens were processed as described previously (9) and back calculated to yield values for total colony-forming units per spleen.
Tetramer staining.
Splenocytes or peripheral blood lymphocytes were harvested and stained with a tetramer panel (LIVE/DEAD Fixable Red Viability Dye; Life Technologies), anti–CD8-APC-Cy7 (clone 53-6.7; BioLegend), anti–CD62L-PE-Cy7 (clone MEL-14; Abcam), anti–KLRG1-FITC (clone 2F1; Southern Biotech), anti–CD127-AF647 (clone A7R34; eBioscience), and anti–CD3-PerCP-Cy5.5 (clone 145-2C11; BD Pharmingen) after SIV-Gag AL11 tetramer labeling as described previously (9). Lung-derived lymphocytes were isolated by incubating dissected lung tissue in 5 ml RPMI containing DNase I (20 μg/ml; Roche) with collagenase type I (2.25 mg/ml; Life Technologies) for 30 minutes before agitation and washing. Red blood cells were then lysed using ACK lysis buffer (Lonza), and the remaining cells were washed before staining as above (9).
Intracellular cytokine staining.
Spleens were harvested and restimulated as described previously (9), using the immunodominant SIV-Gag peptides AL11 and DD13 (DRFYKSLRAEQTD) (65) restricted by MHC class I and class II, respectively (each at 2 μg/ml), or (b) full-length SIV-Gag protein (20 μg/ml). Samples were also incubated with anti-CD28 (clone 37.51; BD Pharmingen) and brefeldin A (BFA) alone to establish background cytokine production. BFA was withheld from samples undergoing protein stimulation for 2 hours to permit Ag processing. Cells were then stained with an ICS panel (LIVE/DEAD Fixable Violet Viability Dye; Life Technologies), anti–CD8-APC-Cy7 (clone 53-6.7; BioLegend), anti–CD4-AF700 (clone RM4-5; BD Pharmingen), anti–CD3-PerCP-Cy5.5 (clone 145-2C11; BD Pharmingen), anti–IFN-γ-APC (clone XMG1.2; BD Pharmingen), anti–IL-2-PE (clone JES6-5H4; BD Pharmingen), anti–TNF-APC-Cy7 (clone MP6-XT22; BD Pharmingen), and anti–IL-10-AF488 (clone JES5-16E3; eBioscience) as described previously (9).
dLN DC and leukocyte subset staining.
For DC subset identification, both popliteal LNs were harvested and pooled from 10 mice for each EGFP-expressing rAd and processed and stained as described previously (22). Briefly, DCs were isolated by enzymatic digestion of dLNs and enriched by CD11c+ positive selection according to the manufacturer’s instructions (Miltenyi Biotec). Cells were then stained with the DC panel (LIVE/DEAD Fixable AquaBlue Viability Dye (Life Technologies), B220-PE-Cy7 (clone RA3-6B2; BD Pharmingen), CD8-APC-Cy7 (clone 53-6.7; Biolegend), CD11b-AF700 (clone M1/70; BioLegend), pan-NK-Pacific Blue (clone DX5; BioLegend), CD19-Pacific Blue (clone 6D5; BioLegend), CD11c-PE (clone HL3; BD Pharmingen), CD103-PerCP-Cy5.5 (clone 2E7; BioLegend), CD3-PE-Cy5 (clone 145-2C11; BD Pharmingen), Langerin-AF647 (clone 929F3.01; Dendritics), and DEC205-biotin (clone NLDC-145; Miltenyi Biotec), followed by streptavidin-Texas Red-PE (BD Pharmingen). DC numbers were back calculated to represent cells per dLNs.
For leukocyte subset identification, dLNs were processed as above and then stained with a LN subsetting panel (LIVE/DEAD Fixable AquaBlue Viability Dye; Life Technologies), CD8-APC-Cy7 (clone 53-6.7; Biolegend), CD4-PerCP-Cy5.5 (clone RM4-5; BD Pharmingen), CD19-APC (clone 6D5; BD Pharmingen), B220-PE-Cy7 (clone RA3-6B2; BD Pharmingen), CD11c-PE (clone HL3; BD Pharmingen), CD11b-AF700 (clone M1/70; BioLegend), pan-NK-Pacific Blue (clone DX5; BioLegend), CD3-PE-Cy5 (clone 145-2C11; BD Pharmingen), Gr1-FITC (clone RB6-8C5; eBioscience), and F4-80-Biotin (clone BM8; eBioscience), followed by streptavidin-Qdot-655 (Life Technologies). Leukocyte populations were calculated to represent the proportion of the total dLN population.
Serum cytokine ELISAs.
Cytokine was quantified in serum after rAd vaccination using the Verikine Mouse IFN-α ELISA Kit (PBL Assay Science) or the Quantikine Mouse CXCL-10/IP-10/CRG-2 ELISA Kit (R&D Systems), according to the manufacturer’s instructions.
NK1.1+ cell depletion.
To deplete NK cells, mice were administered 100 μg NK1.1 antibody (clone PK136) intraperitoneally 2 days before vaccination and a further 25 μg the day after vaccination with rAd5 or rAd35. A control antibody (clone GL113, rat IgG) was given to a parallel group of mice. Effective depletion was checked the day before vaccination using the pan-NK antibody (clone DX5).
Flow cytometry.
Samples were resuspended in 0.5% paraformaldehyde before acquisition using a modified LSR II flow cytometer (BD Biosciences). Results were analyzed using FlowJo version 9.3, Pestle version 1.6.2, and SPICE version 5.22 software. Background cytokine staining was subtracted, based on control samples incubated with anti-CD28 and BFA in the absence of peptide or protein.
Microarrays and quantitative analysis of Ag expression.
Draining popliteal lymph nodes were mechanically processed into single-cell suspensions in RNAlater (for Ag expression by qRT-PCR) (Invitrogen) or RNAprotect Cell Reagent (for mRNA analysis by microarray) (Qiagen). RNA was isolated using the RNAqueous 4PCR Kit (Ambion) as per the manufacturer’s instructions, and yield and quality was checked using the RNA6000 Chip on a 2100 Bioanalyzer (Agilent). Ag transcripts were quantified via 1-step qRT-PCR using the iScript system (Ambion) as per the manufacturer’s instructions, with SIV-Gag mac239-specific forward (5′-agagcctgctggagaacaag-3′) and reverse (5′-ctcggtgtgcttcaccttct-3′) primers and a FRET probe (5′-dFAM-tctggtgcatccacgccgag-BHQ-3′) on a 7900HT Sequence Detection System (ABI Prism). Expression was measured against a standard curve of full-length SIV-Gag and calculated as the number of transcripts per whole dLN. RNA microarray analysis was conducted using the Agilent SurePrint G3 Mouse GE 8 × 60K microarray platform as described previously (66). Labeling was performed using the One-Color Microarray-Based Gene Expression Analysis v.6.5 protocol (Agilent). Details regarding microarray data analysis are provided in the Supplemental Methods. All microarray data are publically available through the Gene Expression Omnibus (67) (accession no. GSE64548).
Statistics.
Statistical significance for basic biological data was calculated using a 2-tailed Mann-Whitney test using PRISM software. The Mann-Whitney test was chosen given the small number of replicates with biological data that may not be parametrically distributed, and 2 individual groups were compared in each analysis. At least 3 biological replicates are depicted in all figures, although we generally included 4–5 individual mice per treatment group for short-term (1–28 days) experiments and 5–6 mice per treatment group for longer-term (>28 days) studies, and 10 mice were pooled for DC experiments, with all experiments repeated at least twice. A P value of 0.05 was considered significant.
Statistical techniques used for microarray-derived data and correlative analyses are described specifically in the Supplemental Methods.
Study approval.
All experimental mouse protocols were approved by the Vaccine Research Center Animal Care and Use Committee, under ethics protocols VRC-08-220, VRC-10-314, and VRC-11-376.
Supplementary Material
Acknowledgments
We thank Pamela Troisch from the microarray core at the Institute for Systems Biology (Seattle, Washington, USA) for processing of the microarrays. This research has been supported in part by a grant from the Foundation for the NIH, with support from the Collaboration for AIDS Vaccine Discovery award (OPP1039775) from the Bill & Melinda Gates Foundation. D.A. Price is a Wellcome Trust Senior Investigator.
Kylie M. Quinn’s present address is: Department of Microbiology and Immunology, University of Melbourne, Parkville, Australia.
Andreia Costa’s present address is: Fred Hutchinson Cancer Research Center, Seattle, Washington, USA.
Kathrin Kastenmuller’s present address is: Institutes of Experimental Immunology, University of Bonn, Bonn, Germany.
Ross W.B. Lindsay’s present address is: International AIDS Vaccine Initiative, New York, New York, USA.
Conflict of interest: Alfredo Nicosia, Antonella Folgori, and Stefano Colloca are employees of ReiThera Srl (formerly Okairos Srl). Riccardo Cortese was an employee of Okairos Srl. Jason G.D. Gall was an employee of GenVec Inc.
Reference information:J Clin Invest. 2015;125(3):1129–1146. doi:10.1172/JCI78280.
References
- 1.Xiang ZQ, Yang Y, Wilson JM, Ertl HC. A replication-defective human adenovirus recombinant serves as a highly efficacious vaccine carrier. Virology. 1996;219(1):220–227. doi: 10.1006/viro.1996.0239. [DOI] [PubMed] [Google Scholar]
- 2.Vogels R, et al. Replication-deficient human adenovirus type 35 vectors for gene transfer and vaccination: efficient human cell infection and bypass of preexisting adenovirus immunity. J Virol. 2003;77(15):8263–8271. doi: 10.1128/JVI.77.15.8263-8271.2003. [DOI] [PMC free article] [PubMed] [Google Scholar]
- 3.Kahl CA, et al. Potent immune responses and in vitro pro-inflammatory cytokine suppression by a novel adenovirus vaccine vector based on rare human serotype 28. Vaccine. 2010;28(35):5691–5702. doi: 10.1016/j.vaccine.2010.06.050. [DOI] [PMC free article] [PubMed] [Google Scholar]
- 4.Farina SF, et al. Replication-defective vector based on a chimpanzee adenovirus. J Virol. 2001;75(23):11603–11613. doi: 10.1128/JVI.75.23.11603-11613.2001. [DOI] [PMC free article] [PubMed] [Google Scholar]
- 5.Xiang Z, et al. Novel, chimpanzee serotype 68-based adenoviral vaccine carrier for induction of antibodies to a transgene product. J Virol. 2002;76(6):2667–2675. doi: 10.1128/JVI.76.6.2667-2675.2002. [DOI] [PMC free article] [PubMed] [Google Scholar]
- 6.Peruzzi D, et al. A novel chimpanzee serotype-based adenoviral vector as delivery tool for cancer vaccines. Vaccine. 2009;27(9):1293–1300. doi: 10.1016/j.vaccine.2008.12.051. [DOI] [PMC free article] [PubMed] [Google Scholar]
- 7.Colloca S, et al. Vaccine vectors derived from a large collection of simian adenoviruses induce potent cellular immunity across multiple species. Sci Trans Med. 2012;4(115):115ra112. doi: 10.1126/scitranslmed.3002925. [DOI] [PMC free article] [PubMed] [Google Scholar]
- 8.Abbink P, et al. Comparative seroprevalence and immunogenicity of six rare serotype recombinant adenovirus vaccine vectors from subgroups B and D. J Virol. 2007;81(9):4654–4663. doi: 10.1128/JVI.02696-06. [DOI] [PMC free article] [PubMed] [Google Scholar]
- 9.Quinn KM, et al. Comparative analysis of the magnitude, quality, phenotype, and protective capacity of simian immunodeficiency virus gag-specific CD8+ T cells following human-, simian-, and chimpanzee-derived recombinant adenoviral vector immunization. J Immunol. 2013;190(6):2720–2735. doi: 10.4049/jimmunol.1202861. [DOI] [PMC free article] [PubMed] [Google Scholar]
- 10.Liu J, et al. Immune control of an SIV challenge by a T-cell-based vaccine in rhesus monkeys. Nature. 2009;457(7225):87–91. doi: 10.1038/nature07469. [DOI] [PMC free article] [PubMed] [Google Scholar]
- 11.Stanley DA, et al. Chimpanzee adenovirus vaccine generates acute and durable protective immunity against ebolavirus challenge. Nat Med. 2014;20(10):1126–1129. doi: 10.1038/nm.3702. [DOI] [PubMed] [Google Scholar]
- 12.Hensley SE, et al. Type I interferon inhibits antibody responses induced by a chimpanzee adenovirus vector. Mol Ther. 2007;15(2):393–403. doi: 10.1038/sj.mt.6300024. [DOI] [PubMed] [Google Scholar]
- 13.Varnavski AN, Schlienger K, Bergelson JM, Gao G-P, Wilson JM. Efficient transduction of human monocyte-derived dendritic cells by chimpanzee-derived adenoviral vector. Hum Gene Ther. 2003;14(6):533–544. doi: 10.1089/104303403764539323. [DOI] [PubMed] [Google Scholar]
- 14.Johnson MJ, et al. Type I IFN induced by adenovirus serotypes 28 and 35 has multiple effects on T cell immunogenicity. J Immunol. 2012;188(12):6109–6118. doi: 10.4049/jimmunol.1103717. [DOI] [PMC free article] [PubMed] [Google Scholar]
- 15.Teigler JE, Iampietro MJ, Barouch DH. Vaccination with adenovirus serotypes 35, 26, and 48 elicits higher levels of innate cytokine responses than adenovirus serotype 5 in rhesus monkeys. J Virol. 2012;86(18):9590–9598. doi: 10.1128/JVI.00740-12. [DOI] [PMC free article] [PubMed] [Google Scholar]
- 16.Shoji M, et al. Type-I IFN signaling is required for the induction of antigen-specific CD8(+) T cell responses by adenovirus vector vaccine in the gut-mucosa. Biochem Biophys Res Commun. 2012;425(1):89–93. doi: 10.1016/j.bbrc.2012.07.056. [DOI] [PubMed] [Google Scholar]
- 17.Hartman ZC, et al. Adenovirus infection triggers a rapid, MyD88-regulated transcriptome response critical to acute-phase and adaptive immune responses in vivo. J Virol. 2007;81(4):1796–1812. doi: 10.1128/JVI.01936-06. [DOI] [PMC free article] [PubMed] [Google Scholar]
- 18.Appledorn DM, Patial S, Godbehere S, Parameswaran N, Amalfitano A. TRIF, and TRIF-interacting TLRs differentially modulate several adenovirus vector-induced immune responses. J Innate Imm. 2009;1(4):376–388. doi: 10.1159/000207194. [DOI] [PMC free article] [PubMed] [Google Scholar]
- 19.Rhee EG, et al. Multiple innate immune pathways contribute to the immunogenicity of recombinant adenovirus vaccine vectors. J Virol. 2011;85(1):315–323. doi: 10.1128/JVI.01597-10. [DOI] [PMC free article] [PubMed] [Google Scholar]
- 20.Lindsay RWB, et al. CD8+ T cell responses following replication-defective adenovirus serotype 5 immunization are dependent on CD11c+ dendritic cells but show redundancy in their requirement of TLR and nucleotide-binding oligomerization domain-like receptor signaling. J Immunol. 2010;185(3):1513–1521. doi: 10.4049/jimmunol.1000338. [DOI] [PubMed] [Google Scholar]
- 21.Muruve DA, et al. The inflammasome recognizes cytosolic microbial and host DNA and triggers an innate immune response. Nature. 2008;452(7183):103–107. doi: 10.1038/nature06664. [DOI] [PubMed] [Google Scholar]
- 22.Quinn KM, et al. Coadministration of polyinosinic:polycytidylic acid and immunostimulatory complexes modifies antigen processing in dendritic cell subsets and enhances HIV gag-specific T cell immunity. J Immunol. 2013;191(10):5085–5096. doi: 10.4049/jimmunol.1301730. [DOI] [PMC free article] [PubMed] [Google Scholar]
- 23.Gaggar A, Shayakhmetov DM, Lieber A. CD46 is a cellular receptor for group B adenoviruses. Nat Med. 2003;9(11):1408–1412. doi: 10.1038/nm952. [DOI] [PubMed] [Google Scholar]
- 24.Hildner K, et al. Batf3 deficiency reveals a critical role for CD8alpha+ dendritic cells in cytotoxic T cell immunity. Science. 2008;322(5904):1097–1100. doi: 10.1126/science.1164206. [DOI] [PMC free article] [PubMed] [Google Scholar]
- 25.Edelson BT, et al. Peripheral CD103+ dendritic cells form a unified subset developmentally related to CD8α+ conventional dendritic cells. J Exp Med. 2010;207(4):823–836. doi: 10.1084/jem.20091627. [DOI] [PMC free article] [PubMed] [Google Scholar]
- 26.Zak DE, et al. Merck Ad5/HIV induces broad innate immune activation that predicts CD8+ T-cell responses but is attenuated by preexisting Ad5 immunity. Proc Natl Acad Sci U S A. 2012;109(50):E3503–E3512. doi: 10.1073/pnas.1208972109. [DOI] [PMC free article] [PubMed] [Google Scholar]
- 27.Nakaya HI, Pulendran B. Systems vaccinology: its promise and challenge for HIV vaccine development. Curr Opin HIV AIDS. 2012;7(1):24–31. doi: 10.1097/COH.0b013e32834dc37b. [DOI] [PMC free article] [PubMed] [Google Scholar]
- 28.Obermoser G, et al. Systems scale interactive exploration reveals quantitative and qualitative differences in response to influenza and pneumococcal vaccines. Immunity. 2013;38(4):831–844. doi: 10.1016/j.immuni.2012.12.008. [DOI] [PMC free article] [PubMed] [Google Scholar]
- 29.Jojic V, et al. Identification of transcriptional regulators in the mouse immune system. Nat Immunol. 2013;14(6):633–643. doi: 10.1038/ni.2587. [DOI] [PMC free article] [PubMed] [Google Scholar]
- 30.Li S, et al. Molecular signatures of antibody responses derived from a systems biology study of five human vaccines. Nat Immunol. 2014;15(2):195–204. doi: 10.1038/ni.2789. [DOI] [PMC free article] [PubMed] [Google Scholar]
- 31.Querec TD, et al. Systems biology approach predicts immunogenicity of the yellow fever vaccine in humans. Nat Immunol. 2009;10(1):116–125. doi: 10.1038/ni.1688. [DOI] [PMC free article] [PubMed] [Google Scholar]
- 32.Nakaya HI, et al. Systems biology of vaccination for seasonal influenza in humans. Nat Immunol. 2011;12(8):786–795. doi: 10.1038/ni.2067. [DOI] [PMC free article] [PubMed] [Google Scholar]
- 33.Li XL, Blackford JA, Hassel BA. RNase L mediates the antiviral effect of interferon through a selective reduction in viral RNA during encephalomyocarditis virus infection. J Virol. 1998;72(4):2752–2759. doi: 10.1128/jvi.72.4.2752-2759.1998. [DOI] [PMC free article] [PubMed] [Google Scholar]
- 34.Offermann MK, et al. Activation of the double-stranded-RNA-activated protein kinase and induction of vascular cell adhesion molecule-1 by poly (I).poly (C) in endothelial cells. Eur J Biochem. 1995;232(1):28–36. doi: 10.1111/j.1432-1033.1995.tb20777.x. [DOI] [PubMed] [Google Scholar]
- 35.Liberzon A, et al. Molecular signatures database (MSigDB) 3.0. Bioinformatics. 2011;27(12):1739–1740. doi: 10.1093/bioinformatics/btr260. [DOI] [PMC free article] [PubMed] [Google Scholar]
- 36.Müller U, et al. Functional role of type I and type II interferons in antiviral defense. Science. 1994;264(5167):1918–1921. doi: 10.1126/science.8009221. [DOI] [PubMed] [Google Scholar]
- 37.Ishikawa H, Barber GN. STING is an endoplasmic reticulum adaptor that facilitates innate immune signalling. Nature. 2008;455(7213):674–678. doi: 10.1038/nature07317. [DOI] [PMC free article] [PubMed] [Google Scholar]
- 38.Ishikawa H, Ma Z, Barber GN. STING regulates intracellular DNA-mediated, type I interferon-dependent innate immunity. Nature. 2009;461(7265):788–792. doi: 10.1038/nature08476. [DOI] [PMC free article] [PubMed] [Google Scholar]
- 39.Ablasser A, et al. cGAS produces a 2′-5′-linked cyclic dinucleotide second messenger that activates STING. Nature. 2013;498(7454):380–384. doi: 10.1038/nature12306. [DOI] [PMC free article] [PubMed] [Google Scholar]
- 40.Burdette DL, et al. STING is a direct innate immune sensor of cyclic di-GMP. Nature. 2011;478(7370):515–518. doi: 10.1038/nature10429. [DOI] [PMC free article] [PubMed] [Google Scholar]
- 41.Holm CK, et al. Virus-cell fusion as a trigger of innate immunity dependent on the adaptor STING. Nat Immunol. 2012;13(8):737–743. doi: 10.1038/ni.2350. [DOI] [PMC free article] [PubMed] [Google Scholar]
- 42.Stein SC, Falck-Pedersen E. Sensing adenovirus infection: activation of interferon regulatory factor 3 in RAW 264.7 cells. J Virol. 2012;86(8):4527–4537. doi: 10.1128/JVI.07071-11. [DOI] [PMC free article] [PubMed] [Google Scholar]
- 43.Lam E, Stein S, Falck-Pedersen E. Adenovirus detection by the cGAS/STING/TBK1 DNA sensing cascade. J Virol. 2013;88(2):974–981. doi: 10.1128/JVI.02702-13. [DOI] [PMC free article] [PubMed] [Google Scholar]
- 44.Schoggins JW, et al. Pan-viral specificity of IFN-induced genes reveals new roles for cGAS in innate immunity. Nature. 2013;505(7485):691–695. doi: 10.1038/nature12862. [DOI] [PMC free article] [PubMed] [Google Scholar]
- 45.Sauer J-D, et al. The N-ethyl-N-nitrosourea-induced Goldenticket mouse mutant reveals an essential function of Sting in the in vivo interferon response to Listeria monocytogenes and cyclic dinucleotides. Infect Imm. 2011;79(2):688–694. doi: 10.1128/IAI.00999-10. [DOI] [PMC free article] [PubMed] [Google Scholar]
- 46.Bassett JD, et al. CD8+ T-cell expansion and maintenance after recombinant adenovirus immunization rely upon cooperation between hematopoietic and nonhematopoietic antigen-presenting cells. Blood. 2011;117(4):1146–1155. doi: 10.1182/blood-2010-03-272336. [DOI] [PubMed] [Google Scholar]
- 47.Aparicio O, et al. Adenovirus VA RNA-derived miRNAs target cellular genes involved in cell growth, gene expression and DNA repair. Nucleic Acids Res. 2010;38(3):750–763. doi: 10.1093/nar/gkp1028. [DOI] [PMC free article] [PubMed] [Google Scholar]
- 48.Perreau M, et al. The number of Toll-like receptor 9-agonist motifs in the adenovirus genome correlates with induction of dendritic cell maturation by adenovirus immune complexes. J Virol. 2012;86(11):6279–6285. doi: 10.1128/JVI.00123-12. [DOI] [PMC free article] [PubMed] [Google Scholar]
- 49.Tanaka Y, Chen ZJ. STING specifies IRF3 phosphorylation by TBK1 in the cytosolic DNA signaling pathway. Sci Signal. 2012;5(214):ra20. doi: 10.1126/scisignal.2002521. [DOI] [PMC free article] [PubMed] [Google Scholar]
- 50.Kolumam GA, Thomas S, Thompson LJ, Sprent J, Murali-Krishna K. Type I interferons act directly on CD8 T cells to allow clonal expansion and memory formation in response to viral infection. J Exp Med. 2005;202(5):637–650. doi: 10.1084/jem.20050821. [DOI] [PMC free article] [PubMed] [Google Scholar]
- 51.Starbeck-Miller GR, Xue H-H, Harty JT. IL-12 and type I interferon prolong the division of activated CD8 T cells by maintaining high-affinity IL-2 signaling in vivo. J Exp Med. 2014;211(1):105–120. doi: 10.1084/jem.20130901. [DOI] [PMC free article] [PubMed] [Google Scholar]
- 52.Thompson LJ, Kolumam GA, Thomas S, Murali-Krishna K. Innate inflammatory signals induced by various pathogens differentially dictate the IFN-I dependence of CD8 T cells for clonal expansion and memory formation. J Immunol. 2006;177(3):1746–1754. doi: 10.4049/jimmunol.177.3.1746. [DOI] [PubMed] [Google Scholar]
- 53.Keppler SJ, Rosenits K, Koegl T, Vucikuja S, Aichele P. Signal 3 cytokines as modulators of primary immune responses during infections: the interplay of type I IFN and IL-12 in CD8 T cell responses. PLoS One. 2012;7(7):e40865. doi: 10.1371/journal.pone.0040865. [DOI] [PMC free article] [PubMed] [Google Scholar]
- 54.Crouse J, et al. Type I interferons protect T cells against NK cell attack mediated by the activating receptor NCR1. Immunity. 2014;40(6):961–973. doi: 10.1016/j.immuni.2014.05.003. [DOI] [PubMed] [Google Scholar]
- 55.Xu HC, et al. Type I interferon protects antiviral CD8+ T cells from NK cell cytotoxicity. Immunity. 2014;40(6):949–960. doi: 10.1016/j.immuni.2014.05.004. [DOI] [PubMed] [Google Scholar]
- 56.Frenz T, et al. Concomitant type I IFN receptor-triggering of T cells and of DC is required to promote maximal modified vaccinia virus Ankara-induced T-cell expansion. Eur J Immunol. 2010;40(10):2769–2777. doi: 10.1002/eji.201040453. [DOI] [PubMed] [Google Scholar]
- 57.Kastenmüller K, et al. Protective T cell immunity in mice following protein-TLR7/8 agonist-conjugate immunization requires aggregation, type I IFN, and multiple DC subsets. J Clin Invest. 2011;121(5):1782–1796. doi: 10.1172/JCI45416. [DOI] [PMC free article] [PubMed] [Google Scholar]
- 58.Le Bon A, et al. Cross-priming of CD8+ T cells stimulated by virus-induced type I interferon. Nat Immunol. 2003;4(10):1009–1015. doi: 10.1038/ni978. [DOI] [PubMed] [Google Scholar]
- 59.Johnson MJ, et al. Type I interferon-dependent activation of NK cells by rAd28 or rAd35, but not rAd5, leads to loss of vector-insert expression. Vaccine. 2014;32(6):717–724. doi: 10.1016/j.vaccine.2013.11.055. [DOI] [PMC free article] [PubMed] [Google Scholar]
- 60.Archer KA, Durack J, Portnoy DA. STING-dependent type I IFN production inhibits cell-mediated immunity to Listeria monocytogenes. PLoS Pathog. 2014;10(1):e1003861. doi: 10.1371/journal.ppat.1003861. [DOI] [PMC free article] [PubMed] [Google Scholar]
- 61.Loré K, et al. Myeloid and plasmacytoid dendritic cells are susceptible to recombinant adenovirus vectors and stimulate polyfunctional memory T cell responses. J Immunol. 2007;179(3):1721–1729. doi: 10.4049/jimmunol.179.3.1721. [DOI] [PMC free article] [PubMed] [Google Scholar]
- 62.Geisbert TW, et al. Vector choice determines immunogenicity and potency of genetic vaccines against Angola Marburg virus in nonhuman primates. J Virol. 2010;84(19):10386–10394. doi: 10.1128/JVI.00594-10. [DOI] [PMC free article] [PubMed] [Google Scholar]
- 63.Small JC, Haut LH, Bian A, Ertl HCJ. The effect of adenovirus-specific antibodies on adenoviral vector-induced, transgene product-specific T cell responses. J Leuk Biol. 2014;96(5):821–831. doi: 10.1189/jlb.1A0813-451RR. [DOI] [PMC free article] [PubMed] [Google Scholar]
- 64.Caskey M, et al. Synthetic double-stranded RNA induces innate immune responses similar to a live viral vaccine in humans. J Exp Med. 2011;208(12):2357–2366. doi: 10.1084/jem.20111171. [DOI] [PMC free article] [PubMed] [Google Scholar]
- 65.Liu J, et al. Modulation of DNA vaccine-elicited CD8+ T-lymphocyte epitope immunodominance hierarchies. J Virol. 2006;80(24):11991–11997. doi: 10.1128/JVI.01348-06. [DOI] [PMC free article] [PubMed] [Google Scholar]
- 66.Zak DE, et al. Systems analysis identifies an essential role for SHANK-associated RH domain-interacting protein (SHARPIN) in macrophage Toll-like receptor 2 (TLR2) responses. Proc Natl Acad Sci U S A. 2011;108(28):11536–11541. doi: 10.1073/pnas.1107577108. [DOI] [PMC free article] [PubMed] [Google Scholar]
- 67.Edgar R, Domrachev M, Lash AE. Gene Expression Omnibus: NCBI gene expression and hybridization array data repository. Nucleic Acids Res. 2002;30(1):207–210. doi: 10.1093/nar/30.1.207. [DOI] [PMC free article] [PubMed] [Google Scholar]
Associated Data
This section collects any data citations, data availability statements, or supplementary materials included in this article.


