

Abstract
Using single-stranded adeno-associated virus serotype 9 (ssAAV9) vectors containing the neuron-specific synapsin-I promoter, we examined whether different administration routes (direct cerebellar cortical (DC), intrathecal (IT) and intravenous (IV) injections) could elicit specific transduction profiles in the CNS. The DC injection route robustly and exclusively transduced the whole cerebellum, whereas the IT injection route primarily transduced the cerebellar lobules 9 and 10 close to the injection site and the spinal cord. An IV injection in neonatal mice weakly and homogenously transduced broad CNS areas. In the cerebellar cortex, the DC and IT injection routes transduced all neuron types, whereas the IV injection route primarily transduced Purkinje cells. To verify the usefulness of this method, we generated a mouse model of spinocerebellar ataxia type 1 (SCA1). Mice that received a DC injection of the ssAAV9 vector expressing mutant ATXN1, a protein responsible for SCA1, showed the intranuclear aggregation of mutant ATXN1 in Purkinje cells, significant atrophy of the Purkinje cell dendrites and progressive motor deficits, which are characteristics of SCA1. Thus, ssAAV9-mediated transduction areas, levels, and cell types change depending on the route of injection. Moreover, this approach can be used for the generation of different mouse models of CNS/neurodegenerative diseases.
Introduction
The cerebellum plays a crucial role in motor coordination, and impairment of the cerebellum results in cerebellar ataxia. The cerebellar cortex is subdivided into three layers: the molecular layer, the Purkinje cell (PC) layer and the granule cell layer. There are five principal morphologically and functionally distinct types of neurons in the cerebellar cortex: PCs, granule cells and three types of interneurons comprising stellate cells, basket cells and Golgi cells. Granule cells receive inputs from brain stem areas, such as the pontine and vestibular nuclei, and send axons, called parallel fibers, to the PCs. The three types of interneurons modulate excitatory transmission from granule cells to PCs in an inhibitory fashion. In addition to these five types of neurons, the cerebellar cortex has a large number of radial glia. These glia are a specific type of astrocyte called Bergmann glia, whose soma are localized in the PC layer and extend processes radially into the molecular layer. PCs receive one more excitatory input from neurons in the inferior olivary nucleus through the climbing fibers. PCs project out from the cortex and make inhibitory synapses onto neurons in the deep cerebellar nuclei (DCN).
PCs are highly susceptible to persistent adverse environmental exposure, vascular disorders and certain genetic defects.1–4 Hereditary spinocerebellar ataxia (SCA) is one representative disease that causes the degeneration of PCs. Hereditary SCA is currently classified into more than 30 types based on the genetic mutation.2 PCs are primarily affected in certain types of SCAs, such as SCA6, SCA7, SCA14, and SCA31, whereas more diverse regions, including the cerebellar nuclei, brainstem and spinal cord, are impaired in other types of SCAs, such as SCA1, SCA2, and SCA3.
Gene therapy is a promising therapeutic approach that has the potential to cure these diseases. Many preclinical studies using mouse models of SCA in combination with lentiviral5,6 or adeno-associated virus (AAV)7,8 vectors expressing therapeutic genes have been conducted. The aims of the studies were to decrease the levels of toxic mutant protein by enhancing degradation pathways6,9,10 or suppressing translation via the expression of shRNAs8 or miRNAs11 directed at the mRNA of the mutant genes. In some studies, these interventions led to the amelioration of the disease phenotype in the mouse model of the disease.6,8 However, as the mouse cerebellum is far smaller than that of humans, one challenge that must be met before proceeding to clinical trials is the expansion of the transduced areas of the cerebellum for PC-specific SCA types and broad transduction beyond the cerebellum to the brainstem and the spinal cord for SCA types that diffusely affect the CNS.
AAV vectors have a smaller particle size than lentiviral vectors and diffuse more extensively throughout brain tissue.12,13 In this study, we used single-stranded AAV (ssAAV) vectors because they have an advantage of approximately double the transgene capacity over self-complementary AAV (scAAV) vectors (5 kb versus 2.5 kbp).14 Using ssAAV serotype 9 (ssAAV9) vectors, we examined three different injection routes of viral administration (directly into the cerebellar cortex, intrathecally into the cisterna magna (located immediately caudal to the cerebellum) and intravenously through the superficial temporal vein close to the eye), and then assessed the extent of transduction in the CNS and the types of cells transduced in the cerebellar cortex. Based on the results obtained from the three different routes of viral administration, we generated a SCA mouse model using a ssAAV9 vector expressing mutant ATXN1 (~5 kb), a protein responsible for SCA1, and evaluated the utility of this approach for the generation of mouse models of neurodegenerative diseases in terms of the behavioral phenotype and neuronal degeneration.
Results
Distinct CNS expression profiles are dependent on the viral administration route
The ssAAV9 vectors expressing green fluorescent protein (GFP) were used to deliver a transgene into neurons in the brain. We used the enhanced neuron-specific synapsin I promoter with the minimal CMV promoter at the 3′ end as a promoter for transgene expression (Figure 1a), which was recently developed in our laboratory. Woodchuck hepatitis virus posttranscriptional regulatory element (WPRE) was placed in the main AAV plasmid downstream of the GFP gene, which helped to enhance the stabilization of the mRNA and eventually increased the expression levels of the transgene.15 The ssAAV9 vectors were injected into the cerebellar cortex (direct cortical (DC) injection), the intrathecal space (IT injection) or the superficial temporal vein (IV injection) as illustrated in Figure 1b–d. We used 4-week-old mice for DC and IT injections and postnatal day 1 (P1) pups for IV injection because the transduction efficiency in the brain after IV injection decreases rapidly as mice mature.12
Figure 1.

The ssAAV9 construct and a diagram showing the injection points. (a) Single-stranded adeno-associated virus serotype-9 (ssAAV9) DNA construct with its specific inverted terminal repeat (ITR) ends. We produced ssAAV9 vectors expressing the GFP under the control of the synapsin I promoter (Syn1) with the minimal CMV promoter at the 3′ end. Woodchuck hepatitis virus posttranscriptional regulatory element (WPRE) was placed downstream of the GFP gene. (b) Positions of the ssAAV9 vector injections relative to the mouse head. ssAAV9 vectors were injected directly into the cerebellar cortex (direct cortical (DC) injection), intrathecally into the cisterna magna (intrathecal (IT) injection) or into the superficial temporal vein (intravenous (IV) injection). (c) Illustration of a sagittal section of the cerebellum and brainstem showing the positions of the DC and IT injections. For DC injections, ssAAV9 vectors were injected into lobule 6. For IT injections, the vectors were administered into the cisterna magna. (d) The injection point for the IV route through the superficial temporal vein, which runs adjacent to the mouse eye. DCN, deep cerebellar nuclei; IO, inferior olivary nucleus; PN, pontine nuclei; VN, vestibular nuclei.
The mice were euthanized 2 weeks after DC or IT injection and 4 weeks after IV injection. Initially, the overall native GFP expression in the whole brains and spinal cords was examined under a fluorescent stereoscopic microscope, followed by the observation of the parasagittal sections of the brain. In the DC injected mice, we observed extremely high levels of GFP primarily in the cerebellum, whereas we observed almost no GFP fluorescence in the cerebrum, brainstem or spinal cord (Figure 2a–c). After IT injection into the cisterna magna, modest levels of GFP fluorescence were detected throughout the brain with exceedingly bright fluorescence in the spinal cord and lobules 9 and 10 of the cerebellum close to the viral injection site (Figure 2d–f). This result may have occurred because the ssAAV9 vectors infused into the cisterna magna and initially infected lobules 9–10, and then most remaining viral particles were pushed downward along the spinal cord by the cerebrospinal fluid draining from the 4th ventricle, which resulted in the efficient transduction of the spinal cord and sciatic nerves (Figure 2e). By contrast, IV injection caused weak and diffuse expression of GFP throughout the CNS, but with a relatively robust expression in the spinal cord and the sciatic nerves (Figure 2g–i).
Figure 2.
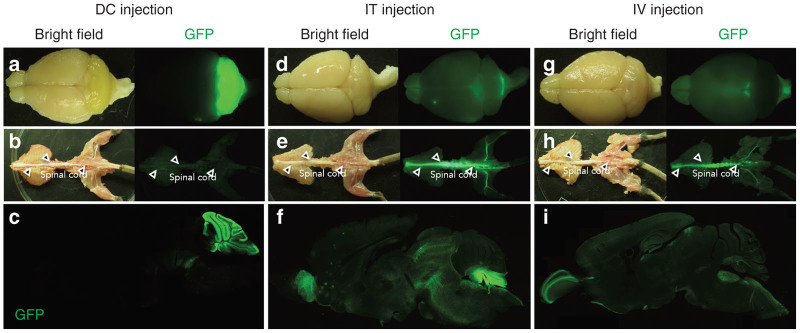
GFP expression profiles in the CNS resulting from the three different routes of administration of the ssAAV9 vector. Four-week-old mice received DC or IT injections of ssAAV9 vectors, while P1 mice received IV injections. The mice were sacrificed 2 weeks (DC and IT injections) or 4 weeks (IV injection) after the virus injection. Native GFP-fluorescent and bright field images of the brains and spinal cords are presented. (a–c) Mice that received DC injections. (d–f) Mice that received IT injections. (g–i) Mice that received IV injections. In each set of images, the upper, middle and lower images show the whole brains, spinal cords, and sagittal sections of the brain, respectively. The spinal cords are indicated by open arrowheads.
Broad GFP expression in the cerebellum after DC and IV, but not IT, injections
To examine the transduction profiles in the cerebellum, we made sagittal and transverse sections of the cerebellum and immunostained these sections for GFP and Nissl substance, a neuronal marker. The immunolabeled sections from mice that received DC or IV injections showed extensive transduction of the cerebellum that involved the entire vermal lobules (Figure 3a,g) and bilateral hemispheres (Figure 3b,h). We observed much higher GFP expression levels in the cerebella transduced by a DC injection than in those transduced by an IV injection (Figure 3a,b versus Figure 3e,f). The GFP expression resulting from a DC injection was centered on lobules 4–6 adjacent to the viral injection site (Figure 3a), while the highest expression levels produced by an IV injection were observed in lobule 10 (Figure 3e,g); this latter result most likely occurred because lobule 10 is immediately adjacent to the choroid plexus in which the cerebrospinal fluid containing the ssAAV9 particles is produced. By contrast, GFP expression produced by an IT injection was strong, but primarily confined to lobules 9 and 10 in the sagittal section (Figure 3c), which partly forms the ceil of the cisterna magna, i.e., the subarachnoidal cavity into which the ssAAV9 vectors were injected. On the transverse section, GFP was inhomogeneously and sparsely expressed in the vermis and bilateral hemispheres by the IT injections (Figure 3d).
Figure 3.

GFP expression profiles in the cerebellum resulting from the three different routes of administration of ssAAV9 vectors. (a,b) DC injection. (c,d) IT injection. (e–h) IV injection. Fluorescent images in the left and right rows are the sagittal and transverse sections of the cerebella, respectively, and were immunolabeled for GFP (green) and Nissl substance or calbindin (red). Images from (a) to (f) were acquired with same confocal laser strength, while images (g) and (h) were obtained with an enhanced laser intensity to make the transduction areas clearly visible. Note the wide-ranging transduction of the cerebellum that resulted from the DC and IV injections. Sagittal sections from mice that received IT injections showed high levels of GFP expression that were restricted to specific lobules (lobules 9 and 10). (i,j) Comparison of GFP expression levels through the three injection routes. Cerebellar lobules on a sagittal section of the cerebellar vermis were grouped into four parts, including lobules 1–3, 4–5, 6–8, and 9–10 as illustrated in (j). Each lobular group was traced, and the fluorescence intensity (arbitrary unit; A. U.) in each lobular group was measured using three slices from three mice in each group. Asterisks indicate statistically significant differences determined by one-way analysis of variance followed by Tukey’s post hoc test, **P < 0.01, ***P < 0.001.
We quantitatively assessed the relative expression levels achieved by the three injection routes by measuring the GFP fluorescence intensity on the sagittal sections of the cerebellum (Figure 3i). The sagittal section was separated into four regions, including lobules 1–3, lobules 4–5, lobules 6–8, and lobules 9–10, as illustrated in Figure 3j. Overall, the DC injection route caused intense GFP expression throughout the entire lobules, whereas the IT and IV injection routes resulted in significantly weaker GFP expression in the whole lobules except lobules 9–10.
Efficient transduction of neuronal cells in the cortex and nuclei of the cerebellum
We next examined the cerebellar cell types transduced by the three different routes of viral administration. PCs, the sole output neurons from the cerebellar cortex, have large somata with well-differentiated dendrites and play critical roles in the processing of motor coordination. To examine the transduction of PCs, the cerebellar sections were double immunostained for GFP and Nissl substance or calbindin D-28K (calbindin), a PC marker. We observed that all three routes of vector administration produced an efficient transduction of PCs (Figure 4a,e,i, thick arrows), and this finding was confirmed by immunolabeling PCs with anti-calbindin antibody (Figure 4b,f,j, thick arrows).
Figure 4.

Neuron-specific transduction in the cerebellar cortex and deep nuclei resulting from all three routes of viral administration. Sagittal (left images) and transverse (middle and right images) sections of the cerebellum immunostained for GFP and Nissl substance (left and right images) or calbindin D-28K (calbindin) (middle images). (a–d) Sections from the mice that received DC injections. (e–h) Sections from the mice that received IT injections. (i–l) Sections from the mice that received IV injections. Arrowheads show interneurons, which were transduced only by DC and IT injections. Thick and thin arrows indicate transduced PCs and projection neurons in the DCN, respectively. Interneurons in the DCN, which are labeled by asterisks, were not transduced by any of the three administration routes. (m) Quantitative analysis of transduction efficacy of PCs by three injection routes. Graph shows the % ratio of the transduced PCs to all PCs were determined in four cerebellar groups as shown in Figure 3j. Each value was obtained from three slices/mouse using three mice in each viral injection group. Scale bars, 50 µm, except for panels (d,h,l) which are 20 µm. Asterisks indicate statistically significant differences determined by one-way analysis of variance followed by Tukey’s post hoc test, **P < 0.01.
The DCN are located in the white matter of the cerebellum and are the main relay from the cerebellar cortex. Neurons in the DCN receive inhibitory inputs from PCs and excitatory inputs from the brainstem nuclei through mossy and climbing fibers. We examined the transduction of neurons in the DCN in transverse sections immunostained for Nissl substance and GFP. We observed robust GFP expression in the large projection neurons (Figure 4c,d,g,h,k,l, arrows), but not the interneurons (Figure 4c,d,g,h,k,l, asterisks), in the DCN after all three routes of viral administration.
We quantitatively assessed the transduction efficiency of PCs by measuring the ratio of GFP-positive PCs to whole PCs in each lobular group (Figure 4m). The DC and IV injection routes transduced ~60–80% of PCs in the three lobular groups comprising the lobules 4–10, whereas the IT injection route transduced ~10% of PCs in most lobules (lobules 1–8) except one lobular group (lobules 9–10), which was adjacent to the IT injection site and attained a similar transduction efficiency (~60%) as the DC injection route. In summary, the analysis of the sagittal sections of the cerebellum revealed that 52%, 23%, and 62% of the PCs were transduced by the DC, IT, and IV injection routes, respectively.
Next, we studied in further detail the transduced cell types in the cerebellar cortex by double immunolabeling sections for GFP and parvalbumin, which is a marker for inhibitory neurons, S100, which is a marker for astrocytes, or NeuN, which is a marker for granule cells. Immunolabeling for parvalbumin showed that numerous stellate and basket cells expressed GFP in the slices infected by the DC and IT injection routes (Figure 5a,d, arrows) but not by the IV injection route (Figure 5g, arrows). No GFP expression was observed in Bergmann glia, which were immunostained for S100, in the slices infected by any of the administration routes (Figure 5b,e,h). In the granule cell layer, numerous granule cells, which were immunostained for NeuN, were transduced by the DC and IT injection routes (Figure 5c,f) but not by the IV injection route (Figure 5i). In any administration routes, GFP-expressing cells with relatively large somata and several processes were observed in the granule cell layer (indicated by asterisks in Figure 5c,i). Based on the morphology, these cells are considered to be Golgi cells.16–18
Figure 5.

Cell types transduced in the cerebellar cortex after each of the three different administration routes. Slices were double-immunolabeled for GFP and parvalbumin (Parv) (left images), S100 (middle images), or NeuN (right images). (a–c) Sections from the mice treated with DC injections. (d–f) Sections from the mice treated with IT injections. (g–i) Sections from the mice treated with IV injections. Short and long arrows indicate stellate cells and basket cells, respectively. Stars and arrowheads indicate PCs and Bergmann glia, respectively. Golgi cells are marked by asterisks. GCL, granule cell layer. Scale bars, 50 µm.
Transduction of neurons in the brainstem nuclei connected to the cerebellum
Neurons in the pontine (Figure 6a,d,g) and vestibular nuclei (Figure 6b,e,h) send mossy fibers to the cerebellar cortex, while neurons in the inferior olivary nucleus located in the medulla oblongata (Figure 6c,f,i) send climbing fibers to the DCN and PCs. Thus, we examined the transduction of neurons in these brainstem nuclei. Sections were immunolabeled for GFP and Nissl substance. The expression of GFP was observed in neurons in the pontine nuclei of slices transduced by any injection routes (Figure 6a,d,g). However, neurons in the vestibular nuclei and inferior olivary nucleus were selectively transduced by the IV injection route (Figure 6b,c,e,f,h,i, arrows).
Figure 6.
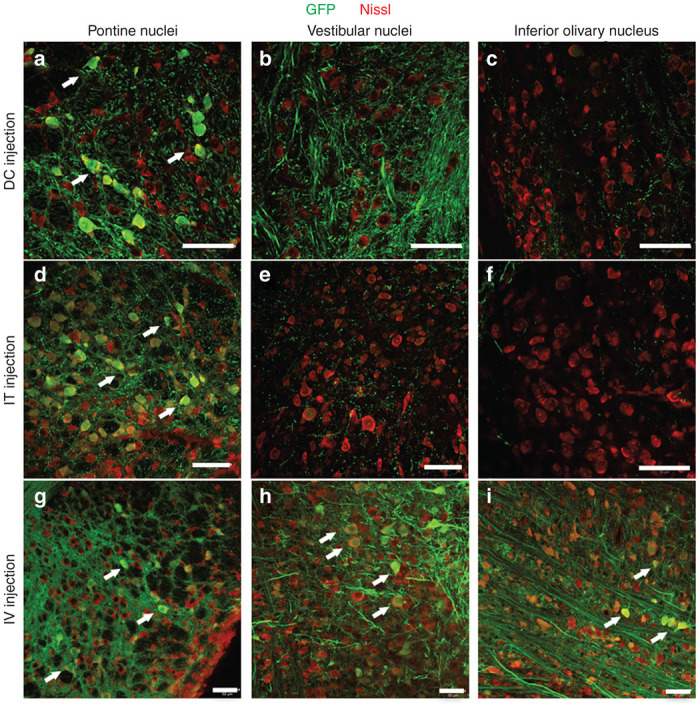
Transduction of neurons in the brainstem nuclei associated with the cerebellar cortex due to the three routes of administration. Sections of the brainstem were double-immunolabeled for GFP (green) and Nissl substance (red). The left, middle and right images show the pontine nuclei, vestibular nuclei and inferior olivary nucleus, respectively. (a–c) Sections from the mice that received DC injections. (d–f) Sections from the mice that received IT injections. (g–i) Sections from the mice that received IV injections. Some GFP-expressing neurons are highlighted by arrows. Scale bars, 50 µm.
Generation of a SCA1 mouse model by DC injection of ssAAV9 vectors expressing mutant ATXN1
To prove the utility of the present method for the production of SCA animal models, we used the DC injection route because the DC injection of ssAAV9 vectors elicited efficient and robust transgene expression throughout the whole cerebellum (Figures 3i and 4m). Four-week-old C57BL/6 mice that showed approximately similar rotarod performances received a DC injection of ssAAV9 vectors expressing GFP or human influenza hemagglutinin (HA)-tagged ATXN1 with an abnormally expanded (141 repeats) polyglutamine stretch under the control of the enhanced synapsin I promoter (ssAAV9-Syn1minCMV-GFP-WPRE or ssAAV9-Syn1minCMV-HA-ATXN1(Q141)-WPRE). Sham-operated mice received a DC injection of a similar volume (10 µl) of phosphate-buffered saline (PBS). Three mouse groups (six mice each), i.e., a PBS-injected group, a GFP-expressing group and a mutant ATXN1-expressing group, showed no statistically significant difference in rotarod performance until 4 weeks after the injection. However, the mutant ATXN1-expressing, but not the GFP-expressing, mice showed a significantly poorer performance than the control PBS-injected mice from 5 weeks after the injection (Figure 7a,b). The impaired performance of ATXN1-expressing mice became more evident thereafter and continued during the observation period (at least, up to 11 weeks after the injection). The weight of the mice did not change significantly among the three groups during the observation period (Figure 7c), suggesting that the poor rotarod performance was not due to the maldevelopment of ATXN1-expressing mice.
Figure 7.
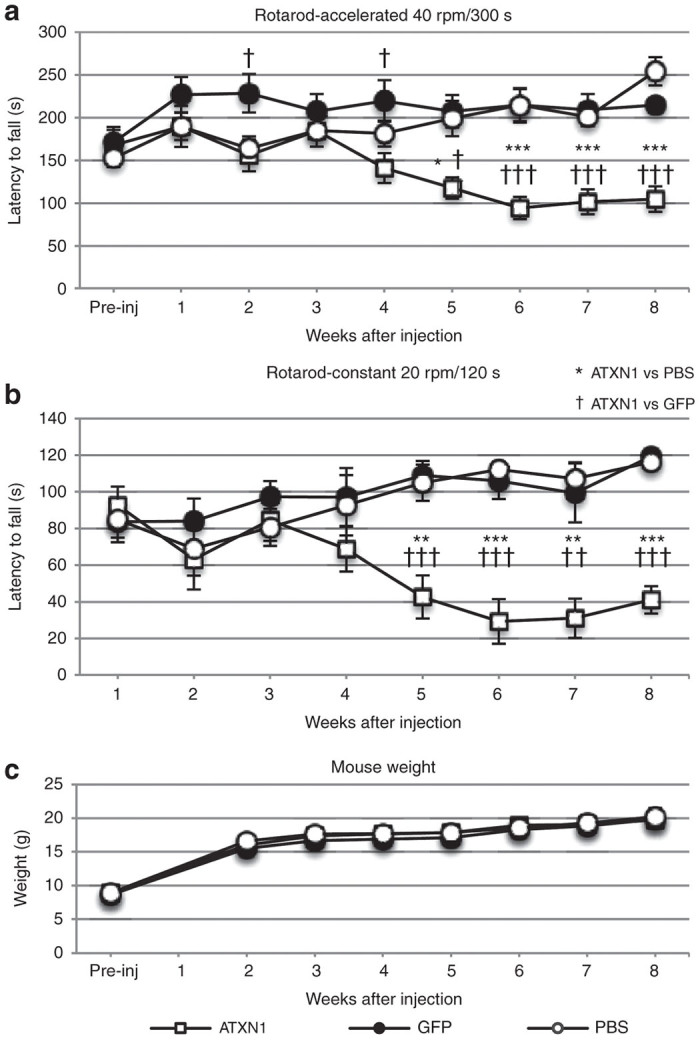
Progressive behavioral impairment in mice that received DC injection of ssAAV9 vectors expressing ATXN1(Q141). Four-week-old C57BL/6 mice received an injection of phosphate-buffered saline (PBS) or ssAAV9 vectors expressing ATXN1(Q141) or GFP. (a,b) The motor coordination of the mice was tested with a rotating rod. Mice underwent four trials per day on both the accelerating (a) (4–40 rpm) rotarod and subsequently the constant (b) (20 rpm) rotarod immediately before and every week up to 8 weeks after the injection. The rotarod performances of the mice expressing mutant ATXN1 (n = 6 mice) were compared with those of the mice treated with PBS (n = 6) or the mice expressing GFP (n = 6). (c) Body weights of mice from the three experimental groups. Asterisks and daggers indicate statistically significant differences compared with the PBS-injected mice and the mice injected with ssAAV9 vectors expressing GFP, respectively, as determined by one-way analysis of variance followed by Tukey’s post hoc test, *P < 0.05, **P < 0.01, ***P < 0.001, ††P < 0.01, and †††P < 0.001.
Significant atrophy of the PC dendrites 2 months after the DC injection of the ssAAV9 vectors expressing mutant ATXN1
The cerebella of ssAAV9-treated and PBS-injected control mice were examined by triple immunostaining with anti-calbindin, anti-HA and anti-expanded polyglutamine (clone 1C2) antibodies 8 weeks after the injection. The cerebellar cortices of PBS-injected mice and mice treated with ssAAV9 vectors expressing GFP showed homogenous immunolabeling for calbindin (Figure 8b,c,e,f), whereas inhomogeneous reduced immunostaining of the cerebellar cortex was observed in the cerebella treated with ssAAV9 vectors expressing ATXN1(Q141) (Figure 8a,d). A quantitative analysis showed that the immunostaining for calbindin was significantly decreased in the cerebellar cortices expressing mutant ATXN1(Q141), but not in those expressing GFP (Figure 8m). These findings suggest a decrease in the levels of calbindin in the mutant ATXN1-expressing PCs as reported in conventionally generated SCA1 mouse models expressing ATXN1(Q82) in PCs.19,20
Figure 8.
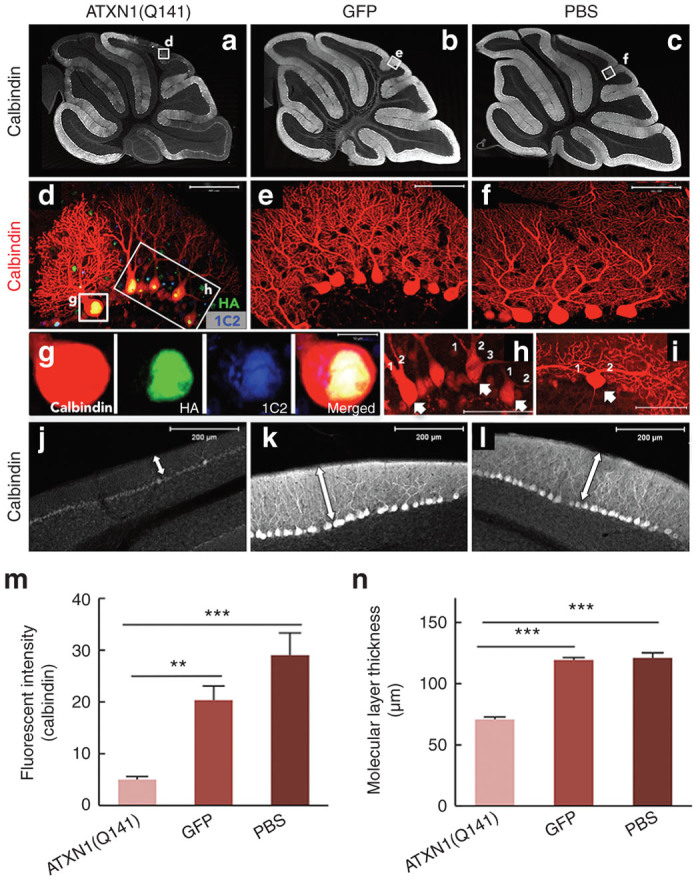
Neurodegenerative changes in the cerebellar cortex following the DC injection of ssAAV9 vectors expressing mutant ATXN1. (a–c) Sagittal section of the cerebellum of mice that received DC injection of (a) ssAAV9 vectors expressing ATXN1(Q141), (b) ssAAV9 expressing GFP or only (c) PBS. The sections were immunolabeled for calbindin. Note that calbindin immunoreactivity was diffusely decreased only in a section expressing mutant ATXN1(Q141), which is a finding characteristic of PC degeneration. (d–f) Impairment of PC dendrites after DC injection of the ssAAV9 vectors expressing mutant ATXN1. Cerebellar sections from the mice treated with the (d) ssAAV9 vectors expressing mutant ATXN1(Q141) were triple immunolabeled for calbindin (red), HA-tagged with mutant ATXN1 (green) and abnormally expanded polyglutamine (blue). Sections from the mice treated with (f) PBS or (e) ssAAV9 vectors expressing GFP were immunolabeled for calbindin. (d) PCs expressing mutant ATXN1, but not (e) PCs expressing GFP or (f) PBS-treated PCs, show aberrant dendritic morphology, such as two or more primary dendrites and markedly reduced branching. (g) An enlarged image of the PC soma in d shows nuclear localization of the mutant ATXN1 immunostained for HA, which was coimmunolabeled for abnormally expanded polyglutamine (1C2 immunostaining). (h,i) Aberrant multiple primary dendrites of PCs expressing mutant ATXN1(Q141). Arrows indicate PCs with double or triple primary dendrites as numbering. (j–l) Significant decrease in the immunoreactivity for calbindin and thickness of the molecular layer from the mice that received DC injection of the ssAAV9 vectors expressing ATXN1(Q141). Bidirectional arrows show the molecular layer of the lobule 6. (m) Significant decrease in the fluorescent intensity of calbindin in PCs by expression of mutant ATXN1. Graph shows the fluorescent intensity of calbindin, which were measured in the molecular and PC layers of the cerebellar lobule 6 from mice treated with ssAAV9 vectors expressing ATXN1(Q141), (b) ssAAV9 expressing GFP or only (c) PBS. (n) Quantitative analysis of the molecular layer thickness. The molecular layer thickness was measured as previously described by Furrer et al.21 at every 200 µm in lobule 6 using three to four sections/mouse (six mice in each group). The molecular layer thickness was significantly decreased only in the mice treated with the ssAAV9 vectors expressing mutant ATXN1. Scale bars, (d–f,h,j) 50 µm and (j–l) 200 µm. Asterisks indicate statistically significant differences determined by one-way analysis of variance followed by Tukey’s post hoc test, **P < 0.01, ***P < 0.001.
In the enlarged image of the cerebellar cortex expressing ATXN1(Q141), we observed 1C2-positive mutant ATXN1 aggregates in the PC nuclei (Figure 8g) and an aberrant dendrite morphology of the PCs, such as double or triple primary dendrites (Figure 8h,i, arrows), markedly decreased branching and reduced dendritic area (Figure 8d). These changes were not detected in the cerebellar cortex treated with ssAAV9 vectors expressing GFP or with PBS (Figure 8e,f). The extent of PC dendrite atrophy was quantitatively assessed by the molecular layer thickness. The molecular layer thickness of the cerebella in the three groups was evaluated at lobule 6 because it was uniformly degenerated in the mutant ATXN1 group as judged by the decreased immunoreactivity for calbindin. The thickness, which was measured according to a protocol used by Furrer et al.21 using six mice per group, was significantly decreased in the mice treated with ssAAV9 vectors expressing ATXN1(Q141) (70.8 ± 2.0 µm, ***P < 0.001) compared with the PBS-injected control mice (119.2 ± 2.2 µm) and the mice treated with ssAAV9 vectors expressing GFP (120.9 ± 4.4 µm) (Figure 8j,k,l,n). Because the intranuclear aggregation of mutant protein, a decreased immunoreactivity for calbindin, an aberrant PC dendrite morphology and a decrease in the molecular layer thickness were characteristic of conventional SCA1 mouse models,19,20 the present results indicate that a SCA1 mouse model can be reliably generated by the DC injection of a ssAAV9 vector expressing mutant ATXN1.
Discussion
Distinct transduction area and strength by three different injection routes
The route of administration of viral vectors is a critical factor that determines the tissues/organs transduced, the strength of the targeted transgene expression and the risk of tissue damage inherent to the injection procedure. However, there has been no report that directly compares DC, IT, and IV routes using the same AAV vector construct. In the present study, we compared these three administration routes and showed that the most invasive route, DC injection, resulted in a strong and diffuse transgene expression that was almost exclusively limited to the cerebellum. The next most invasive route (IT), which released vectors into the cisterna magna, caused a broad transgene expression in areas including the cerebrum, the brainstem and, most efficiently, the spinal cord; however, this route of administration only transduced a limited part of the cerebellum (lobules 9–10) near the injection site. Interestingly, we observed GFP expression in the olfactory bulb by the IT route (Figure 2f), which presumably occurred because of the combined effects of gravitation and cerebrospinal fluid flow on the viral vector spread. By contrast, the least invasive route of administration (IV injection) produced a relatively weak expression of the transgene, but the expression spanned the entire CNS.
Non-selective neuronal transduction by DC or IT injection and PC-predominant transduction through the IV route
In terms of the types of cells transduced in the cerebellum, there was no difference between the DC and IT injection routes; ssAAV9 vectors administered via either injection route transduced nearly all neuron types present in the cerebellum. By contrast, IV administration resulted in a selective transduction of PCs and projection neurons in the DCN and a small number of Golgi cells.16 There are at least three possible explanations for the differences in the types of neurons transduced by the DC and IT injection routes and the IV injection route. First, the PC-selective transduction through the IV route might be influenced by the low viral vector dose and the detection limit.22 A higher dose of viral vectors might increase transduction in various cell types, and more sensitive optical devices might be able to detect weaker transgene expression. Second, the difference in the ages of the mice that received ssAAV9 vectors via the DC and IT injection routes or via the IV injection route may account for the difference.23 The morphologies and the localizations of the cortical neurons in the cerebellum differ according to the maturity; therefore, it would not be surprising if the tropism of the ssAAV9 for cortical cells differs depending on the age of the mouse.24,25 Third, the immunity and the metabolism of the circulating blood may have affected the viral tropism. When viral vectors are injected via the IV route, they are subject to interact with immune factors and/or to receive modifications of the surface molecules by proteases, which could eventually alter the viral tropism.
Generation of a SCA1 mouse model by the DC injection of ssAAV9 vectors
Previously, de Almeida’s group has reported lentiviral vector-mediated expression of Mutant Huntingtin, a gene responsible for Huntington disease26 or mutant ATXN3, a gene responsible for SCA3,27 in the rat striatum. The injected animals showed neuropathology characteristic of the diseases including intranuclear inclusions and neuronal cell death. However, those animals failed to show progressive ataxia, probably because the areas of transgene expression by lentiviral vectors were spatially limited. In this study, we used diffusible ssAAV9 vectors, whose diameters are much smaller than those of lentiviral vectors, for expression of mutant ATXN1 in the cerebellum. As discussed above, a robust transgene expression in the whole cerebellum can be attained by the DC injection of ssAAV9 vectors. Therefore, we chose the DC injection of ssAAV9 vectors for expression of the disease-causing gene. Injection of ssAAV9 vectors containing mutant ATXN1 via the DC injection route caused a progressive motor deficit, which started at 5 weeks after injection. In the immunohistochemistry studies, we observed 1C2-immunolabeled mutant ATXN1 in the PC nuclei, a reduced calbindin immunostaining, an atrophy of the PC dendrites and a decrease in the molecular layer thickness. These findings are characteristic of the conventional SCA1 mouse models.19,20,28,29 Collectively, in terms of the use of AAV vectors and demonstration of progressive ataxia, our viral vector-based SCA1 model mouse is quite new and provides an alternative strategy for generation of disease model animals.
Here, we used the DC injection route to express a mutant gene in the cerebellum, but the IT injection route is available to express a transgene in neurons of the spinal cord. Moreover, the combination of the DC injection route with the IT injection route allows us to express a mutant gene strongly throughout the CNS, which may be useful to generate animal models of disease in which broad CNS regions are affected, such as the diffuse types of the SCAs.
We examined the behavioral phenotype of mice virally expressing mutant SCA gene for longer time and found that those mice continued to show poor rotarod performance stably during our observation period (~6 months, data not shown), consistent with previous studies demonstrating long-lasting and stable expression of a transgene by AAV vectors.30–32 Thus, our AAV-based SCA mouse model may be available also for a long-term study such as monitoring the effect of a therapeutic intervention on the ataxic behavior.
Advantages and disadvantages of the IV injection route
A big advantage of the IV injection route is an absence of the needle track damage in the brain tissue, which leads the adverse immune response via migration of microglia, in addition to the physical destruction of the neural tissue. Since the DC injection route, which was found to cause high levels of transgene expression, has a potential risk of inducing the endoplasmic reticulum stress in transduced cells, widespread low levels of transgene expression by the IV route may be safe and good for gene therapy.
One concern in systemically applying ssAAV9 vectors to target the CNS is the transduction of non-CNS organs. We examined several internal organs and the skeletal muscle of mice that received ssAAV9 vectors by the IV injection route. In accordance with the results of other groups,12,13 we observed a faint, but apparent, GFP expression, particularly in the liver and heart (data not shown), although we used a neuron-specific modified synapsin I promoter.33 Therefore, it would be a challenge to find a method or a promoter that transduces only the CNS.
Another disadvantage of the IV injection route is the failure of gene delivery with ssAAV vectors to the neurons of mature animals,12 which is most likely due to the development of the blood-brain barrier. Therefore, we used P1 pups to examine the transduction profile in the CNS after an IV injection of ssAAV9 vectors. Although the expression levels of the transgene after an IV injection were fairly low, we have previously confirmed that such low levels of transgene expression are functionally effective in facilitating the degradation of toxic polyglutamine protein in the PCs of a SCA3 animal model.34 Thus, the IV injection route could potentially be applied in newborn infants who are diagnosed with mucopolysaccharidosis during newborn screening. In such cases, the IV injection of ssAAV9 vectors expressing a deficient enzyme may help degrade the mucopolysaccharides that would otherwise accumulate and produce adverse effects in the brain. Intriguingly, scAAV transduced the CNS after a systemic injection until 3 years of age in the cynomolgus macaque,35 suggesting that the differences in the species and/or the genomic structure of AAV broadens the transduction window of the IV injection route to target the CNS.
Perspective of AAV vectors
Here, we demonstrated that the use of different ages of mice and different routes of administration to deliver ssAAV9 vectors resulted in distinct transgene expression profiles in the CNS. Moreover, the expression levels attained by the DC injection route were sufficient to induce a characteristic behavioral phenotype and pathological alteration in the infected neurons. Therefore, we believe that in addition to exploring the functions of unknown genes in the CNS, AAV vectors are increasingly used for the generation of animal models of neurological diseases and preclinical/clinical trials of gene therapy that aim to deliver a therapeutic gene to the affected CNS regions.
Materials and Methods
Animals
Animals were maintained on a 12-hour light/dark cycle with free access to food and water. All animal experiments were approved by the Animal Care and Experimental Committee of Gunma University (Gunma, Japan) (09-020) and were conducted in accordance with the institutional and national guides for the care and use of laboratory animals. All efforts were made to minimize animal suffering and reduce the number of animals used.
Production of ssAAV9 vectors
Recombinant ssAAV9 vectors were generated by the co-transfection of 293T cells with three plasmids, including pAAV/Syn1mCMV-GFP-WPRE or pAAV/Syn1mCMV-HA-ATXN1(Q141)-WPRE, pHelper (Stratagene, La Jolla, CA) and pAAV2/9 (kindly provided by James M Wilson of University of Pennsylvania). The viral particles were purified using ammonium sulfate precipitation and iodixanol continuous gradient centrifugation as described previously.36 The genomic titer of the purified ssAAV9 vector as determined by real-time PCR was 7.1 × 10¹³ − 3.2 × 10¹⁴ vector genomes (vg)/ml.
Direct cortical injection
The ssAAV9 vector solution was injected as described previously.16,37 Briefly, 4-week-old mice were anesthetized via an intra-peritoneal injection of ketamine (100 mg/kg weight) and xylazine (16 mg/kg weight). After a sufficient anesthesia level was attained, the mouse was mounted in a stereotactic frame, the skin on the mouse’s head was cut, and a burr-hole was made in the occipital bone 5 mm caudal to bregma. Then, the blunt-ended tip of a Hamilton syringe (33 gauge) attached to a micropump (UltramicroPump II; World Precision Instrument (WPI) Sarasota, FL) was placed below the pia mater at lobule 6 (Figure 1b,c). Ten microliters of ssAAV9 vector solution expressing GFP (titer: 7.1 × 10¹⁰ vg; 5 × 10⁹ vg for control experiments of mouse model generation), ssAAV9 vectors expressing mutant ATXN1 (titer: 5 × 10⁹ vg) or PBS was injected at a rate of 333 nl/minute (for 30 minutes) using a microprocessor-based controller (Micro4; WPI, Sarasota, FL). After suturing the scalp, the mouse was maintained on a heating pad and then returned to a standard cage.
Intrathecal injection
The mice were anesthetized with a mixture of ketamine and xylazine similar to that used for DC injection and then fixed in a stereotactic frame. For the injection of ssAAV9 vectors into the cisterna magna, the skin over the posterior atlanto-occipital membrane was cut, and the muscular layers were moved aside. The tip of a Hamilton syringe (30 or 33 gauge) was carefully inserted into the cisterna magna through the posterior atlanto-occipital membrane, and the ssAAV9 vector was introduced as depicted in Figure 1b,c. Similar to DC injection, 10 microliters of ssAAV9 vector solution containing 7.1 × 10¹⁰ vg was injected. The muscular layers and skin were closed by suture, and the mouse was kept on a heating pad and returned to the standard cage after it recovered from anesthesia.
Intravenous injection
The ssAAV9 vector solution was injected into the temporal superficial vein as illustrated in Figure 1b,d. One-day-old pups that weighed about 1.6 g were anesthetized by hypothermia on a latex covered petri-dish inside a Styrofoam box containing ice for 2–4 minutes. Then, the mice were positioned by hand to reveal the superficial temporal vein. The ssAAV9 vector solution (titer: 4.4 × 10¹¹ vg/g) was administered via the superficial-temporal vein using a 30-gauge insulin syringe as described by Foust et al.23
Immunohistochemistry
Mice were perfused transcardially with a fixative containing 4% paraformaldehyde in 0.1 mol/l PBS after being deeply anesthetized with ketamine/xylazine. The whole brain was removed and postfixed in the same fixative overnight. Sagittal and transverse sections were produced from the cerebellar vermis and the whole cerebellum, respectively, using a vibratome/microtome (Leica VT1000 S; Leica Microsystems, Wetzlar, Germany). The cerebellar sections were placed in a blocking solution, which contained 2% normal donkey serum and 0.4% Triton X-100 in PBS, for 1 hour. To evaluate the levels and expansion of GFP expression in the cerebellum, the cerebellar sections were immunolabeled for GFP and Nissl substance (Figure 3a,c,e,g) or calbindin (Figure 3b,d,f,h). For the primary antibody treatment, the sections were incubated with rat polyclonal anti-GFP (1:1,000; Cat. No. GF090R, Nacalai tesque, Kyoto, Japan) and mouse monoclonal anti-calbindin D-28K (1:500; Cat. No. 300, Swant, Bellinzona, Switzerland) antibodies overnight at 4 °C on a shaking table. After washing with PBS at room temperature (5 minutes × 3 times), the sections were treated with Neurotrace530/615 (1:250; Life Technologies, NY) and/or secondary antibodies in the blocking solution at room temperature for 4 hours. The secondary antibodies included Alexa Fluor 488-conjugated donkey anti-rat IgG (1:500; Life Technologies) and Alexa Fluor 568-conjugated donkey anti-mouse IgG (1:500; Life Technologies).
For determining the % ratio of the transduced PCs to the whole PCs, the cerebellar sections were immunolabeled for GFP and Nissl substance or calbindin (Figure 4) as described above. To identify the transduced cell types, the cerebellar sections were immunolabeled for GFP and parvalbumin, S100 or NeuN (Figure 5). The primary antibodies included rat polyclonal anti-GFP (1:1,000; Cat. No. GF090R, Nacalai tesque) and mouse monoclonal anti-parvalbumin (1:500; Cat. No. P3088, Sigma-Aldrich, St Louis, MO), mouse monoclonal anti-S100 (1:500; Cat. No. S2532, Sigma-Aldrich) or mouse monoclonal anti-neuron-specific nuclear protein (NeuN; Cat. No. MAB377; Millipore, Billerica, MA) antibodies. The secondary antibodies included Alexa Fluor 488-conjugated donkey anti-rat IgG (1:500; Life Technologies) and Alexa Fluor 568-conjugated donkey anti-mouse IgG (1:500; Life Technologies). Transduction of the brain stem was assessed by immunolabeling the brain stem sections for GFP and Nissl substance (Figure 6) as described above.
The expression of the mutant ATXN1 in the PCs was visualized by immunolabeling for calbindin and HA tagged with the ATXN1. An abnormally expanded polyglutamine stretch involved in the mutant ATXN1 was also detected by the monoclonal antibody (clone; 1C2). Thus, the cerebellar sections expressing mutant ATXN1 (Figure 8a,d,g,h) were triple immunostained with rabbit polyclonal anti-calbindin (1:500; Cat. No. C2724, Sigma-Aldrich), rat monoclonal anti-HA (1:500, Cat. No. 11867423001, Roche, IN) and mouse monoclonal anti-expanded polyglutamine (1:500, clone, 1C2, Cat. No. MAB1574, Millipore) antibodies, whereas the cerebellar sections from the control mice (Figure 8b,c,e,f,i,j) were single immunolabeled with rabbit polyclonal anti-calbindin (1:500; Cat. No. C2724, Sigma-Aldrich). For the sections that were immunostained by 1C2, to maximize the optimal exposure to buried 1C2 epitope, Formic Acid (98%) was applied following Osmand et al.28 (with modifications) for 20 seconds before the pretreatment by blocking solution. The secondary antibodies included Alexa Fluor 568-conjugated donkey anti-rabbit IgG (1:500; Life Technologies), Alexa Fluor 488-conjugated donkey anti-rat IgG (1:500; Life Technologies), and Alexa Fluor 680-conjugated donkey anti-mouse IgG (1:500; Life Technologies).
Bright-field and fluorescent images of the whole brains and spinal cords of the mice were captured using a fluorescent stereoscopic microscope (VB-7010, Keyence, Osaka, Japan). Images of the whole brain sections were obtained using a fluorescent microscope (BZ-9000; Keyence). Images of the cerebellar sections were obtained using a confocal laser-scanning microscope (LSM 5 PASCAL; Carl Zeiss, Oberkochen, Germany).
Transduction efficacy of PCs in the cerebellum
The difference of PC transduction efficiency in the three injection routes was examined in four classified lobular regions (lobules 1–3, 4–5, 6–8, and 9–10). Serial z-stack images were obtained from 15 designated locations on a sagittal section of the cerebellum immunolabeled for GFP and calbindin. Each cerebellar lobule was represented by one or more locations. Serial z-stack images consisting of 10 images (interval: 3 µm) were captured by a confocal microscope (LSM 510, Carl Zeiss) with a 20× objective that covers a 450 µm × 450 µm area. Cell counting was performed using the free software ImageJ (National Institute of Health, Bethesda, MD) using a “Cell counter” plugin. We first counted the calbindin-positive PCs and then the GFP-positive cells that concurred with calbindin. We carefully examined the serial images from different depths to ensure that all positive cells were counted and no cell was counted more than once. Truncated cells on the image margin were counted if they were located in the right and lower margins, but were ignored if they were located in the upper and left margins. We collected 15 locations/section, 3 sections/mouse and 3 mice/group, and thus determined the PC transduction efficiency in the four classified lobular regions of the cerebellum using 135 z-stack serial images/group. The transduction efficacy of the PCs was calculated by dividing the number of GFP and calbindin-double positive PCs by the calbindin-positive PCs. The data were then averaged in the four lobular groups.
Quantification of the fluorescent intensity of GFP and calbindin
To measure the GFP fluorescent intensity, nine sections from three mice (three sections/mouse) from each route were randomly selected. The GFP fluorescent images of those sections were captured using the same setting by a confocal microscope and then analyzed using ImageJ. The outline of the cerebellar lobular groups in each section was traced, and the fluorescence intensity in the enclosed areas was measured. The background intensity was subtracted from the fluorescence intensity. For examining the immunofluorescent intensity of calbindin, 24 sections from six mice (four sections/mouse) from each group were randomly selected and the fluorescence intensity in the lobule 6 was measured as described above.
Rotarod test for motor coordination and weight measurements in mice
The motor coordination ability was assessed using a rotarod (MK-610, Muromachi Kikai, Tokyo, Japan) with two different paradigms. In the accelerated paradigm, the rod accelerated from 4 rpm to 40 rpm in 300 seconds (cut off time = 300 seconds), while in the stable speed paradigm, the rod rotated at a stable speed of 20 rpm (cut off time = 120 seconds). Mice were assessed with both paradigms immediately before (only accelerated paradigm) and every week up to 8 weeks after the viral injection. In the accelerating and stably rotating tests, the mice were subjected to four trials each, with a 30 and 15 minutes rest, respectively, between the trials. The average latency to fall from the rod was examined. Changes in the body weight were measured by decigram precision every week. Six mice were examined in each group.
Molecular layer thickness
The thickness of the molecular layer was measured as previously described by Furrer et al.21 with some modifications. The molecular layer thickness was measured at every 200 µm in lobule 6 using three to four sections/mouse with a LSM Image browser (4.2 Service Pack 1, Carl Zeiss). Six mice were examined in each group.
Statistical analysis
Significant differences were analyzed by Tukey’s post hoc test after one-way analysis of variance using the R software statistical package (www.r-project.org). Data are expressed as the means ± SEM.
Acknowledgments
The authors thank our laboratory members for excellent technical assistance and constructive discussion, and James M. Wilson of the University of Pennsylvania for providing the pAAV2/9 vector for ssAAV9 production. This work was funded, in part, by the Funding Program for the Next Generation World-Leading Researchers (LS021) to H.H. and the Brain Science Program of the National Institutes of Natural Science (NINS) to A.K.
The authors declare no conflict of interest.
References
- Cavanagh JB, Holton JL, Nolan CC. Selective damage to the cerebellar vermis in chronic alcoholism: a contribution from neurotoxicology to an old problem of selective vulnerability. Neuropathol Appl Neurobiol. 1997;23:355–363. [PubMed] [Google Scholar]
- Seidel K, Siswanto S, Brunt ER, den Dunnen W, Korf HW, Rüb U. Brain pathology of spinocerebellar ataxias. Acta Neuropathol. 2012;124:1–21. doi: 10.1007/s00401-012-1000-x. [DOI] [PubMed] [Google Scholar]
- Mellon SH, Gong W, Schonemann MD. Endogenous and synthetic neurosteroids in treatment of Niemann-Pick Type C disease. Brain Res Rev. 2008;57:410–420. doi: 10.1016/j.brainresrev.2007.05.012. [DOI] [PMC free article] [PubMed] [Google Scholar]
- Sarna JR, Hawkes R. Patterned Purkinje cell death in the cerebellum. Prog Neurobiol. 2003;70:473–507. doi: 10.1016/s0301-0082(03)00114-x. [DOI] [PubMed] [Google Scholar]
- Hirai H. Basic research on cerebellar gene therapy using lentiviral vectors. Cerebellum. 2012;11:443–445. doi: 10.1007/s12311-011-0330-x. [DOI] [PubMed] [Google Scholar]
- Torashima T, Koyama C, Iizuka A, Mitsumura K, Takayama K, Yanagi S. Lentivector-mediated rescue from cerebellar ataxia in a mouse model of spinocerebellar ataxia. EMBO Rep. 2008;9:393–399. doi: 10.1038/embor.2008.31. [DOI] [PMC free article] [PubMed] [Google Scholar]
- Rodriguez-Lebron E, Denovan-Wright EM, Nash K, Lewin AS, Mandel RJ. Intrastriatal rAAV-mediated delivery of anti-huntingtin shRNAs induces partial reversal of disease progression in R6/1 Huntington’s disease transgenic mice. Mol Ther. 2005;12:618–633. doi: 10.1016/j.ymthe.2005.05.006. [DOI] [PMC free article] [PubMed] [Google Scholar]
- Xia H, Mao Q, Eliason SL, Harper SQ, Martins IH, Orr HT. RNAi suppresses polyglutamine-induced neurodegeneration in a model of spinocerebellar ataxia. Nat Med. 2004;10:816–820. doi: 10.1038/nm1076. [DOI] [PubMed] [Google Scholar]
- Qin Q, Inatome R, Hotta A, Kojima M, Yamamura H, Hirai H. A novel GTPase, CRAG, mediates promyelocytic leukemia protein-associated nuclear body formation and degradation of expanded polyglutamine protein. J Cell Biol. 2006;172:497–504. doi: 10.1083/jcb.200505079. [DOI] [PMC free article] [PubMed] [Google Scholar]
- Miller VM, Nelson RF, Gouvion CM, Williams A, Rodriguez-Lebron E, Harper SQ. CHIP suppresses polyglutamine aggregation and toxicity in vitro and in vivo. J Neurosci. 2005;25:9152–9161. doi: 10.1523/JNEUROSCI.3001-05.2005. [DOI] [PMC free article] [PubMed] [Google Scholar]
- Lee Y, Samaco RC, Gatchel JR, Thaller C, Orr HT, Zoghbi HY. miR-19, miR-101 and miR-130 co-regulate ATXN1 levels to potentially modulate SCA1 pathogenesis. Nat Neurosci. 2008;11:1137–1139. doi: 10.1038/nn.2183. [DOI] [PMC free article] [PubMed] [Google Scholar]
- Miyake N, Miyake K, Yamamoto M, Hirai Y, Shimada T. Global gene transfer into the CNS across the BBB after neonatal systemic delivery of single-stranded AAV vectors. Brain Res. 2011;1389:19–26. doi: 10.1016/j.brainres.2011.03.014. [DOI] [PubMed] [Google Scholar]
- Wang DB, Dayton RD, Henning PP, Cain CD, Zhao LR, Schrott LM. Expansive gene transfer in the rat CNS rapidly produces amyotrophic lateral sclerosis relevant sequelae when TDP-43 is overexpressed. Mol Ther. 2010;18:2064–2074. doi: 10.1038/mt.2010.191. [DOI] [PMC free article] [PubMed] [Google Scholar]
- McCarty DM. Self-complementary AAV vectors; advances and applications. Mol Ther. 2008;16:1648–1656. doi: 10.1038/mt.2008.171. [DOI] [PubMed] [Google Scholar]
- Loeb JE, Cordier WS, Harris ME, Weitzman MD, Hope TJ. Enhanced expression of transgenes from adeno-associated virus vectors with the woodchuck hepatitis virus posttranscriptional regulatory element: implications for gene therapy. Hum Gene Ther. 1999;10:2295–2305. doi: 10.1089/10430349950016942. [DOI] [PubMed] [Google Scholar]
- Torashima T, Okoyama S, Nishizaki T, Hirai H. In vivo transduction of murine cerebellar Purkinje cells by HIV-derived lentiviral vectors. Brain Res. 2006;1082:11–22. doi: 10.1016/j.brainres.2006.01.104. [DOI] [PubMed] [Google Scholar]
- Neki A, Ohishi H, Kaneko T, Shigemoto R, Nakanishi S, Mizuno N. Metabotropic glutamate receptors mGluR2 and mGluR5 are expressed in two non-overlapping populations of Golgi cells in the rat cerebellum. Neuroscience. 1996;75:815–826. doi: 10.1016/0306-4522(96)00316-8. [DOI] [PubMed] [Google Scholar]
- Geurts FJ, Timmermans J, Shigemoto R, De Schutter E. Morphological and neurochemical differentiation of large granular layer interneurons in the adult rat cerebellum. Neuroscience. 2001;104:499–512. doi: 10.1016/s0306-4522(01)00058-6. [DOI] [PubMed] [Google Scholar]
- Zu T, Duvick LA, Kaytor MD, Berlinger MS, Zoghbi HY, Clark HB. Recovery from polyglutamine-induced neurodegeneration in conditional SCA1 transgenic mice. J Neurosci. 2004;24:8853–8861. doi: 10.1523/JNEUROSCI.2978-04.2004. [DOI] [PMC free article] [PubMed] [Google Scholar]
- Vig PJ, Wei J, Shao Q, Lopez ME, Halperin R, Gerber J. Suppression of calbindin-D28k expression exacerbates SCA1 phenotype in a disease mouse model. Cerebellum. 2012;11:718–732. doi: 10.1007/s12311-011-0323-9. [DOI] [PubMed] [Google Scholar]
- Furrer SA, Mohanachandran MS, Waldherr SM, Chang C, Damian VA, Sopher BL. Spinocerebellar ataxia type 7 cerebellar disease requires the coordinated action of mutant ataxin-7 in neurons and glia, and displays non-cell-autonomous bergmann glia degeneration. J Neurosci. 2011;31:16269–16278. doi: 10.1523/JNEUROSCI.4000-11.2011. [DOI] [PMC free article] [PubMed] [Google Scholar]
- Inagaki K, Fuess S, Storm TA, Gibson GA, Mctiernan CF, Kay MA. Robust systemic transduction with AAV9 vectors in mice: efficient global cardiac gene transfer superior to that of AAV8. Mol Ther. 2006;14:45–53. doi: 10.1016/j.ymthe.2006.03.014. [DOI] [PMC free article] [PubMed] [Google Scholar]
- Foust KD, Nurre E, Montgomery CL, Hernandez A, Chan CM, Kaspar BK. Intravascular AAV9 preferentially targets neonatal neurons and adult astrocytes. Nat Biotechnol. 2009;27:59–65. doi: 10.1038/nbt.1515. [DOI] [PMC free article] [PubMed] [Google Scholar]
- Lowenstein PR. Crossing the rubicon. Nat Biotechnol. 2009;27:42–44. doi: 10.1038/nbt0109-42. [DOI] [PMC free article] [PubMed] [Google Scholar]
- Saunders NR, Joakim Ek C, Dziegielewska KM. The neonatal blood-brain barrier is functionally effective, and immaturity does not explain differential targeting of AAV9. Nat Biotechnol. 2009;27:804–5; author reply 805. doi: 10.1038/nbt0909-804. [DOI] [PubMed] [Google Scholar]
- de Almeida LP, Ross CA, Zala D, Aebischer P, Déglon N. Lentiviral-mediated delivery of mutant huntingtin in the striatum of rats induces a selective neuropathology modulated by polyglutamine repeat size, huntingtin expression levels, and protein length. J Neurosci. 2002;22:3473–3483. doi: 10.1523/JNEUROSCI.22-09-03473.2002. [DOI] [PMC free article] [PubMed] [Google Scholar]
- Alves S, Régulier E, Nascimento-Ferreira I, Hassig R, Dufour N, Koeppen A. Striatal and nigral pathology in a lentiviral rat model of Machado-Joseph disease. Hum Mol Genet. 2008;17:2071–2083. doi: 10.1093/hmg/ddn106. [DOI] [PubMed] [Google Scholar]
- Osmand AP, Berthelier V, Wetzel R. Imaging polyglutamine deposits in brain tissue. Meth Enzymol. 2006;412:106–122. doi: 10.1016/S0076-6879(06)12008-X. [DOI] [PubMed] [Google Scholar]
- Stevanin G, Trottier Y, Cancel G, Dürr A, David G, Didierjean O. Screening for proteins with polyglutamine expansions in autosomal dominant cerebellar ataxias. Hum Mol Genet. 1996;5:1887–1892. doi: 10.1093/hmg/5.12.1887. [DOI] [PubMed] [Google Scholar]
- Hadaczek P, Eberling JL, Pivirotto P, Bringas J, Forsayeth J, Bankiewicz KS. Eight years of clinical improvement in MPTP-lesioned primates after gene therapy with AAV2-hAADC. Mol Ther. 2010;18:1458–1461. doi: 10.1038/mt.2010.106. [DOI] [PMC free article] [PubMed] [Google Scholar]
- Husain T, Passini MA, Parente MK, Fraser NW, Wolfe JH. Long-term AAV vector gene and protein expression in mouse brain from a small pan-cellular promoter is similar to neural cell promoters. Gene Ther. 2009;16:927–932. doi: 10.1038/gt.2009.52. [DOI] [PMC free article] [PubMed] [Google Scholar]
- De Wit J, Eggers R, Evers R, Castrén E, Verhaagen J. Long-term adeno-associated viral vector-mediated expression of truncated TrkB in the adult rat facial nucleus results in motor neuron degeneration. J Neurosci. 2006;26:1516–1530. doi: 10.1523/JNEUROSCI.4543-05.2006. [DOI] [PMC free article] [PubMed] [Google Scholar]
- Matsuzaki Y, Oue M, Hirai H. Generation of a neurodegenerative disease mouse model using lentiviral vectors carrying an enhanced synapsin I promoter. J Neurosci Methods. 2014;223:133–143. doi: 10.1016/j.jneumeth.2013.12.004. [DOI] [PubMed] [Google Scholar]
- Konno A, Shuvaev AN, Miyake N, Miyake K, Iizuka A, Matsuura S. Mutant ataxin-3 with an abnormally expanded polyglutamine chain disrupts dendritic development and metabotropic glutamate receptor signaling in mouse cerebellar Purkinje cells. Cerebellum. 2014;13:29–41. doi: 10.1007/s12311-013-0516-5. [DOI] [PubMed] [Google Scholar]
- Bevan AK, Duque S, Foust KD, Morales PR, Braun L, Schmelzer L. Systemic gene delivery in large species for targeting spinal cord, brain, and peripheral tissues for pediatric disorders. Mol Ther. 2011;19:1971–1980. doi: 10.1038/mt.2011.157. [DOI] [PMC free article] [PubMed] [Google Scholar]
- Miyake K, Miyake N, Yamazaki Y, Shimada T, Hirai Y. Serotype-independent method of recombinant adeno-associated virus (AAV) vector production and purification. J Nippon Med Sch. 2012;79:394–402. doi: 10.1272/jnms.79.394. [DOI] [PubMed] [Google Scholar]
- Goenawan H, Hirai H. Modulation of lentiviral vector tropism in cerebellar Purkinje cells in vivo by a lysosomal cysteine protease cathepsin K. J Neurovirol. 2012;18:521–531. doi: 10.1007/s13365-012-0134-x. [DOI] [PubMed] [Google Scholar]