Abstract
Purpose
To develop an automated magnetic resonance imaging (MRI) parotid segmentation method to monitor radiation-induced parotid gland changes in patients after head and neck radiation therapy (RT).
Methods and Materials
The proposed method combines the atlas registration method, which captures the global variation of anatomy, with a machine learning technology, which captures the local statistical features, to automatically segment the parotid glands from the MRIs. The segmentation method consists of 3 major steps. First, an atlas (pre-RT MRI and manually contoured parotid gland mask) is built for each patient. A hybrid deformable image registration is used to map the pre-RT MRI to the post-RT MRI, and the transformation is applied to the pre-RT parotid volume. Second, the kernel support vector machine (SVM) is trained with the subject-specific atlas pair consisting of multiple features (intensity, gradient, and others) from the aligned pre-RT MRI and the transformed parotid volume. Third, the well-trained kernel SVM is used to differentiate the parotid from surrounding tissues in the post-RT MRIs by statistically matching multiple texture features. A longitudinal study of 15 patients undergoing head and neck RT was conducted: baseline MRI was acquired prior to RT, and the post-RT MRIs were acquired at 3-, 6-, and 12-month follow-up examinations. The resulting segmentations were compared with the physicians' manual contours.
Results
Successful parotid segmentation was achieved for all 15 patients (42 post-RT MRIs). The average percentage of volume differences between the automated segmentations and those of the physicians' manual contours were 7.98% for the left parotid and 8.12% for the right parotid. The average volume overlap was 91.1% ± 1.6% for the left parotid and 90.5% ± 2.4% for the right parotid. The parotid gland volume reduction at follow-up was 25% at 3 months, 27% at 6 months, and 16% at 12 months.
Conclusions
We have validated our automated parotid segmentation algorithm in a longitudinal study. This segmentation method may be useful in future studies to address radiation-induced xerostomia in head and neck radiation therapy.
Introduction
Xerostomia (dry mouth) is a common debilitating adverse effect in patients who have received radiation therapy (RT) for head and neck malignancies (1-8). Severe xerostomia is associated with oral discomfort, increased rates of dental caries, oral infection, and difficulty in speaking and swallowing (6, 8). Several studies have shown that changes in parotid gland morphology (e.g. volume reduction) are associated with decreased saliva production and xerostomia (1-8). Nevertheless, longitudinal imaging studies with larger cohorts are needed to better understand this debilitating side effect, monitor its progression, and evaluate its response to interventions, such as partial parotid sparing (available with intensity modulated RT).
Longitudinal imaging studies of radiation-induced parotid toxicity require an accurate, reliable, and validated imaging method to segment the parotid glands. In the clinic, manual segmentation remains the gold standard for parotid delineation with magnetic resonance images (MRI). However, it is impractical to apply the manual segmentation method to longitudinal or large-scale studies due to time constraints. In addition, manual segmentations are also prone to rater drift and bias. A number of CT-based parotid gland segmentation methods have been investigated (9-16), yet few studies have been conducted using MRIs. Therefore, the goal of this study was to develop an automated, reliable, and robust segmentation method to monitor radiation-induced parotid gland changes by using multiple MRIs.
We proposed combining atlas registration, which captures global variations of anatomy, with machine learning, which captures local statistical features, using kernel support vector machine (SVM), to automatically segment the parotid glands in MR images. This method uses the baseline parotid contours as the atlas and automates the parotid segmentation for post-RT MRIs. Our technology was tested in a longitudinal study of 15 head and neck patients with 1-year follow-up examinations.
Methods and Materials
Our segmentation method consisted of 3 major steps: (1) atlas-based registration; (2) feature SVM training; and (3) parotid gland volume segmentation using trained feature SVM.
Step 1: Atlas-based registration
A hybrid deformable image registration combining a normalized mutual information (NMI) metric with a normalized sum-of-squared-differences (NSSD) metric was used to map the pre-RT MR to the post-RT MRI. The transformation was then applied to the parotid gland binary volume manually contoured from pre-RT MR images (Fig. 1).
Fig. 1.
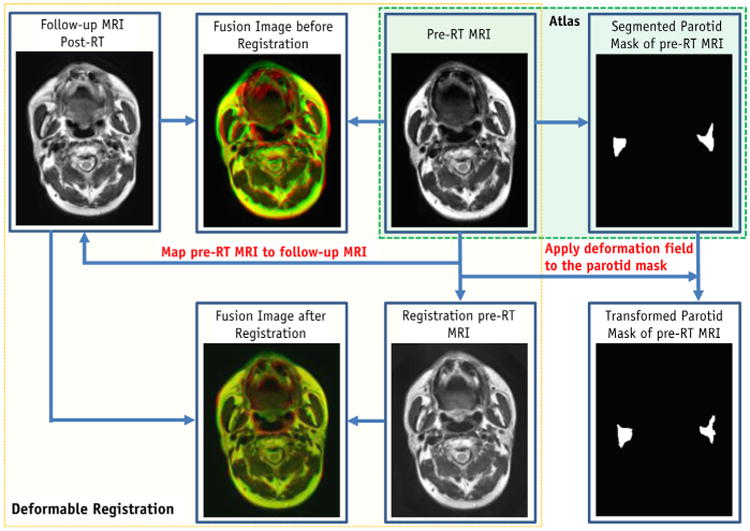
Flow chart of atlas registration (Step 1).
The term “atlas” in the context of this work is defined as the pairing of structural MRI volumes with their corresponding segmented parotid gland binary volumes. We built a subject-specific atlas for each patient, which included the patient's baseline (pre-RT) MR images and the manually contoured parotid binary volume. The advantage of using the pre-RT MR as the basis for the SVM approach is that the pre-RT MRI often shows anatomy structure that is clearer than that of post-RT MRI, where radiation damage may occur. The MR parotid segmentations at various follow-up times for a specific patient were based on this atlas. Using this patient's post-RT MR scan obtained at follow-up, we aligned the pre-RT MRI to the post-RT MRI, using deformable registration (detailed in the following section) and applied the transformation to the parotid gland binary volume of the pre-RT MRI.
In order to handle the local intensity contrast induced by RT (17) and inhomogeneity changes associated with various MR scans (18, 19), we applied a hybrid image matching metric (10), which is a combination of NMI and NSSD metrics.
| (1) |
where I and J denote the pre-RT and follow-up images; H(I) and H(J) denote the marginal entropies I and J; and H(I, J) denotes their joint entropy, which is calculated from the joint histogram of I and J. α and β are the relative weighting of the two terms α= β = 0.5. μI = Gs * I denotes the local intensity mean, and σI = Gs*(I − μI)2 denotes the local intensity variation of image, I. The same denotations are for the target image J.Gs, which denotes a Gaussian filter with the kernel size s (the kernel size s was chosen to be 2-3 times the image voxel size). The hybrid matching metric provides a better image alignment than the NSSD or NMI, because they are sensitive only to edges or local image contrast, respectively (10).
After this atlas registration, the registered baseline (pre-RT) MRI had similar global anatomy information as the follow-up MRI. However, the size and intensity of the parotid glands in MRI often change over time after RT (17). In order to capture local changes (intensity contrast variation) of parotid glands and improve the segmentation accuracy, we used this pair with large similarity as the follow-up MRI to train the kernel-based SVM.
Step 2: Support vector machine training
Multiple operators (gradient, enhanced Sobel and Gabor wavelets) were used to extract the local features from registered baseline MRI, and multiple different features were extracted to aid in the kernel-based SVM classification process (Fig. 2). A total of 41 features, some sensitive to the boundary and some sensitive to the microstructures, were made up of the original intensity feature, gradient features, enhanced Sobel features, and Gabor features. Four gradient and Sobel operators were convolved with aligned pre-RT MR images to detect horizontal, vertical, and diagonal edges and strength of edges (20). We also obtained a total of 32 Gabor features on 4 levels and 4 rotations for the original intensity image. Gabor wavelet was used to capture image features in multiple scales and multiple orientations (21, 22). The mother function of the 2-dimensional Gabor wavelet is:
Fig. 2.
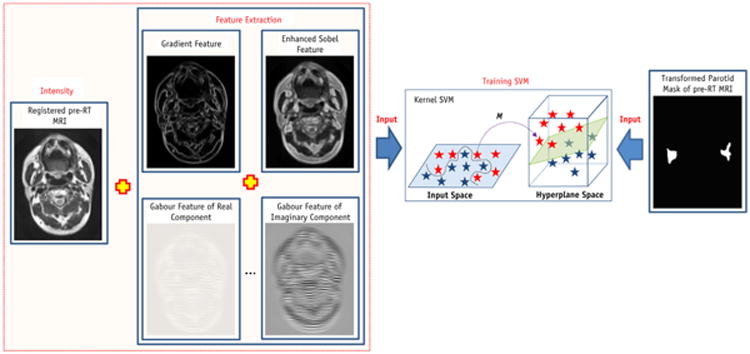
Flow chart of SVM training (Step 2). SVM = support vector machine.
| (2) |
with the corresponding Fourier transformation as.
| (3) |
where σu = 1 / (2πσx)and σv =1/(2πσy) and σx and σy characterize the spatial extent and frequency bandwidth of the Gabor wavelet, and W is a shifting parameter along the u axis in the frequency domain. The Gabor wavelet can be obtained by dilation and rotation of the mother function. Use of the Gabor wavelet offers at least 2 advantages for parotid gland segmentation. First, with the Gaussian factor in the Gabor wavelet, the noise in the MRI (19) can be smoothed or removed. Second, the multiscale and multi-orientation structure of the Gabor wavelet enables the extractions of edge direction as well as edge strength. The Gabor wavelet provides rich edge maps that correspond to a variety of directions, rather than a single “maximum edge intensity” map.
SVM is a popular, supervised machine learning model with associated statistical learning algorithms that analyze data and recognize patterns for classification and regression analysis (23). The idea behind SVMs is to map the original data points from the input space to a high-dimension (hy-perplane) feature space such that the classification problem becomes simpler in the hyperplane space. The training phase of SVMs looks for a linear, optimal separating hyperplane as the maximum margin classifier with respect to the training data (24). Because the training data are not linearly separable, kernel-based SVM methods are used to classify these features. Kernel-based SVM methods map data from an original input feature space to a kernel feature space of higher dimensionality and then solve a linear problem in that space. In this study, kernel-based SVM was used to identify the features of parotid gland tissue. Although these features may vary greatly among various follow-up MR scans, the kernel-based SVM nonlinearly classifies subjects by extracting different features. The method defines a hyperplane to classify the subjects by minimizing the following function.
| (4) |
subject to.
| (5) |
where C is a penalty parameter and ξi is a slack variable to measure the deviation of training samples. w is the vector of coefficients, and b is a constant offset. To find the optimal input parameter values, the grid search method is used. The index i labels the N training cases. yi∈; ± 1 is the class label, and xi is the independent variable. The kernel k is used to transform data from the input to the feature space. There are a number of kernels that can be used in SVM models. In our implementation, radial basis function (RBF) was used as follows
| (6) |
We used the registered pre-RT MRI with multiple features (gradient, Sobel, and Gabor features), as well as the transformed parotid binary volume, to train the RBF kernel-based SVM.
Step 3: Volume segmentation
In order to segment the parotid glands, we performed the same feature extraction process for the follow-up MRIs (Fig. 3). The follow-up MR images and their multiple features (gradient, Sobel, and Gabor features) were the input of trained kernel-based SVM, and the trained SVM adaptively labeled the parotid tissue based on its texture and location. The output of trained SVM is a binary image (volume) consisting of many “0” (nonparotid tissues) and “1” (parotid tissue) points. The 3D parotid segmentation was obtained from the classification-based binary volume using the following steps: (1) the pre-RT segmented parotid volume plus 10-mm margin was defined as the volume of interest (VOI); (2) the VOI was applied to the binary volume to set the volume outside the VOI to 0; (3) a 3D filter was applied to smooth the binary volume; (4) a 0.5 threshold was applied to the filtered volume; and (5) 3D morphology operation was used to eliminate the holes or disconnections in the parotid glands.
Fig. 3.
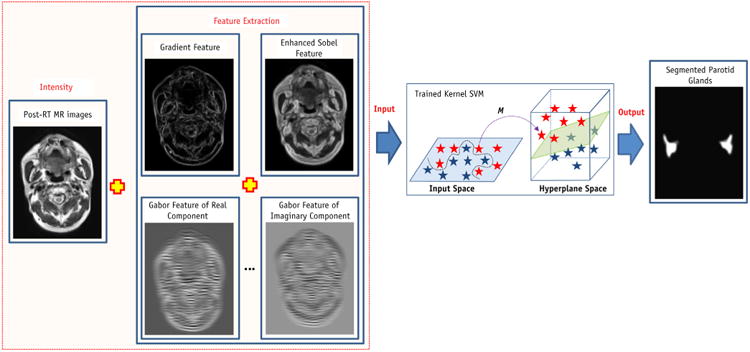
Flow chart of parotid volume segmentation (Step 3).
Reliability evaluation of the segmentation algorithm
The automatic parotid segmentation results were compared with the gold standard of physicians' manual contours. A common evaluation measure for a segmentation method is the Dice overlap ratio. The Dice overlap ratio is defined as follows:
| (7) |
where Vol1 represents the voxels of the parotid gland segmented by the automated algorithm, and Vol2 represents the voxels of the corresponding manual segmentation of the experts.
Results
Subjects
We conducted a longitudinal study of 15 patients receiving radiation therapy for head and neck malignancies, such as laryngeal and oropharyngeal cancers. This MR imaging study was approved by the Ethics Committee of our university. The 15 patients (10 men and 5 women) ranged in age from 40 to 65 years (mean, 49.5 ± 6.6 years). The median radiation dose to the left parotid gland was 50.3 Gy (43.1-61.1 Gy) and 51.9 Gy (38.5-63.2 Gy) to the right parotid gland. All patients received a baseline MR scan prior to RT and an additional 3 MR scans post-RT at 3- and 6-month and 1-year follow-up examinations. Among the 15 patients, 2 patients missed the 6-month follow-up scan, and 1 patient missed the 1-year follow-up scan. A total of 57 MR scans were included in this study.
MRI scan
All MRI examinations were performed with a dedicated head and neck coil, with a Signa model HDxt 1.5-T machine (GE Healthcare). T1-and T2-weighted MR sequences were obtained after an intravenous injection of contrast material (gadopentetate dimeglumine). The parameters for the T2-weighted sequence were TR/TE/ETL = 3000 ∼ 4000/90 ∼ 120/8 ∼ 16 ms, 3.0-mm slice thickness, 256 × 256 matrix, maximum voxel resolution of 0.8 × 0.8 × 3.0 mm3.
Interobserver reliability study
The interobserver reliability study showed consistency in the physicians' manual baseline contours, which were used as the ground truth, as well as in the automatic parotid segmentations, using the 2 different sets of baseline contours.
Parotid gland segmentation: a case report
Figure 4 shows the case of a 41-year-old patient who received intensity modulated RT for laryngeal cancer. The mean dose to the right parotid was 55.26 Gy, and the mean dose to the left parotid was 53.05 Gy. Prior to RT, the baseline volume of the right parotid gland was 28.14 cm3 and 26.98 cm3 of the left parotid. Post-RT, the right parotid gland volumes obtained from the automatic segmentation compared to those from manual segmentation (Dice volume overlap) were 21.55 versus 22.82 cm3 (89.9%), respectively, at 3-month follow-up; 20.86 versus 22.26 cm3 (91.3%), respectively, at 6-month follow-up; and 23.35 versus 25.29 cm3 (89.6%), respectively, at 1-year follow-up. Similarly, the left parotid gland volumes obtained from the automatic compared to those of the manual segmentations were 19.90 versus 21.14 cm3 (91.8%), respectively, at 3 months; 19.71 versus 18.93 cm3 (90.4%), respectively, at 6 months; and 22.96 versus 24.77 cm3 (90.1%), respectively, at 1-year follow-up. Differences between automatically segmented parotid gland volumes and the physicians' manual contours ranged between −8.3% and 7.7% at the 3 follow-up time points.
Fig. 4.
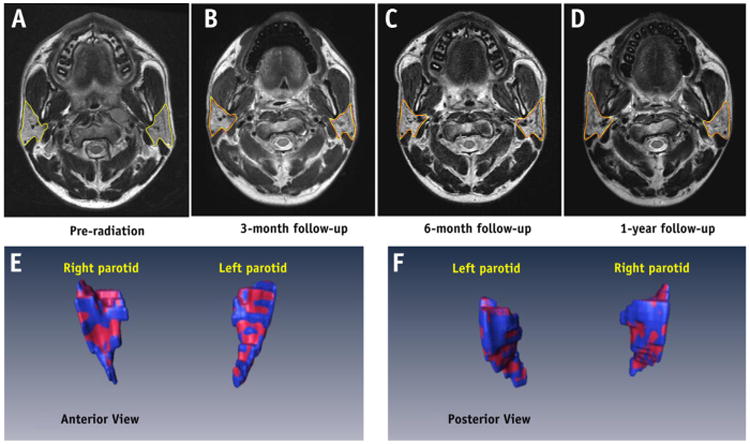
An example of parotid gland volume reduction post-RT. (Top row) MR images of the pre-RT parotid glands (a) and at 3-month (b), 6-month (c), and 1-year (d) follow-up examinations. The automatic segmentation is shown in red, and the manual contour is shown in yellow. (Bottom row) 3D visualization and comparison between automatic (red) and manual (blue) parotid gland segmentation 3 months post-RT. A color version of the figure is available at www.redjournal.org.
Parotid gland segmentation: first follow-up study for all patients
Fifteen pre-RT MR image volumes corresponding to 15 patients were first manually contoured by an experienced radiation oncologist (NW) to obtain respective the left and right parotid gland binary volumes (masks). We built 15 atlases (pre-RT T2-weighted MRI volume plus corresponding parotid gland binary volume comprised an atlas for each patient) for 15 patients in our longitudinal study.
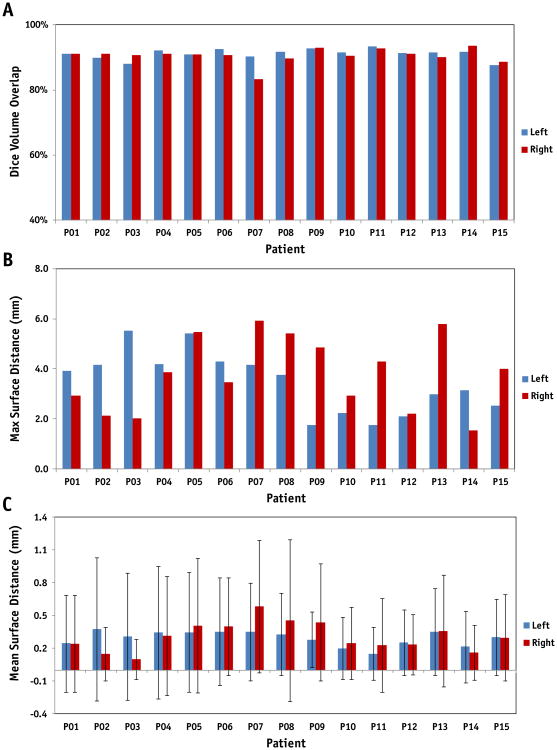
We compared the automatic parotid gland segmentations with the physicians' manual contours for the 42 follow-up MRIs. Figure 5 shows the Dice volume overlap, maximum, and mean surface distance comparisons of the first follow-up time point for the 15 patients. The averaged volumes obtained from the automatic segmentations compared to the manual contours were 20.56 ± 7.63 versus 22.23 ± 8.39 cm3, respectively, for the left parotid glands; and 21.31 ± 6.16 versus 23.01 ± 7.87 cm3, respectively, for the right ones. The averaged Dice volume overlap was 91.1 ± 1.6% (left) and 90.5 ± 2.4% (right); the averaged absolute volume difference was 7.98% (left) and 8.12% (right); the averaged maximum surface distance was 3.46 ± 1.22 (left) and 3.79 ± 1.47 mm (right); and the averaged surface distance was 0.29 ±0.11 mm (left) and 0.32 ± 0.17 mm (right).
Fig. 5.
Dice volume overlap (a), maximum (b) and mean surface distance (c) comparisons of left and right parotid glands for 15 patients at the first follow-up time between the automatic and manual segmentation.
Parotid gland segmentation: all follow-up studies for all patients
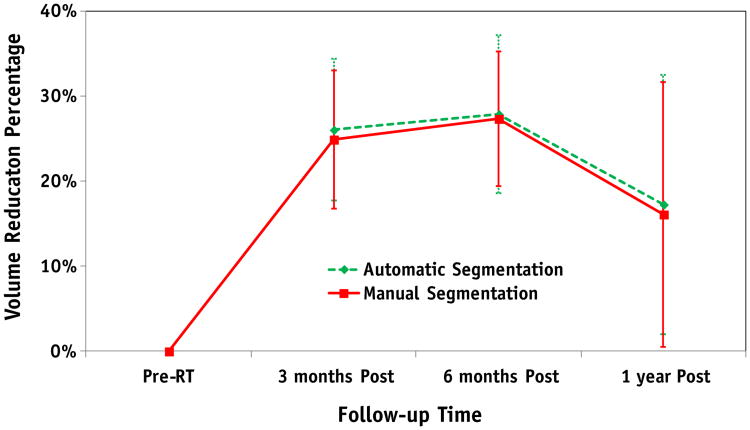
For the longitudinal study, the pre-RT parotid gland volume was used as the reference with which to observe the parotid gland volume reduction in all patients at various follow-up times. Figure 6 shows a comparison of the average percentage of volume reduction in the 15 patients, obtained by automatic and manual segmentations. For the manual and automatic segmentations, the percentage of parotid volume reduction was 24.9% ± 8.2% and 26.1% ± 8.4%, respectively, at 3 months post-RT (P=.42); 27.4% ± 7.9% and 27.9% ± 9.3%, respectively, at 6 months post-RT (P= .83); and 16.1% ± 15.6% and 17.3% ± 15.2%, respectively, at 1 year post-RT (P=.55). There were no significant differences (P = .37) between the parotid gland volume reductions at 3 and 6 months post-RT, whereas there were significant difference in volume reductions between the 3-month and 1-year follow-up examinations (P=.019) and the 6-month and 1-year follow-up examinations (P = .014).
Fig. 6.
Comparison of average percentages of volume reduction in 15 patients between the automatic and manual segmentation at different follow-up times.
Discussion
We proposed an automatic MR parotid gland segmentation algorithm with which to study RT-induced parotid volume changes in head and neck cancer RT. In this algorithm, an atlas registration combined the NMI with the NSSD and was used to register the pre-RT MRI to the post-RT MRI, and multiple features were extracted from the registered pre-RT MRI to train the kernel SVM. The trained kernel SVM was subsequently used to perform the segmentation for the post-RT MRI. In this automatic segmentation, the atlas registration was used to capture the radiation-induced global anatomical variation of the parotid glands, whereas the trained SVM with multiple features was used to capture the local statistical structural variation. Automatic segmentation results were compared with physicians' manual contours (gold standard). The average Dice volume overlaps between our segmentations and the manual contours of the bilateral parotid glands were more than 90%. Compared to the pre-RT parotid gland volume, the percentage of parotid volume reduction was 25% at 3 months post-RT, 27% at 6 months post-RT, and 16% at 1 year post-RT.
Parotid gland volume reduction was observed in all 15 patients after RT, which is consistent with previous studies (6-8, 17, 25, 26). Wu et al (8) demonstrated that the post-RT parotid glands had an average of 35% volume reduction compared with normal glands. Vasquez et al (25) observed that the average parotid volume reduction was 14% to 17% at the end of treatment. In a clinical study of 82 patients, Wang et al (6) indicated the average parotid gland volume loss was 20.1% after 3 weeks of RT, 26.93% upon completing RT, and 27.21% at 2 months post-RT.
Histologically, normal parotid glands consist entirely of serous cells with densely packed translucent secretory granules (3, 27). Radiation doses of more than 26 Gy can cause a significant loss of serous acini and reduce the volume of parotid glands (6) during the treatment and at the early follow-up examinations after RT. The percentage of parotid gland volume reduction produced big difference among those studies, which may be caused by (1) different mean doses to parotid glands correlated with parotid damage; and (2) different follow-up times. In the current study, no significant differences in gland volumes were observed between the 3- and 6-month follow-up examination, which is consistent with reports by Wang et al (6) and Nomayr et al (17). The parotid volume increase between 6-month and 1-year follow-up examinations may indicate the parotid recovery after radiation therapy (27).
Due to the complexity of head and neck MRI, most MR-based segmentation methods rely on a single or multiple atlases. Single - or multiple-atlas-based segmentation methods need to address 2 issues: (1) how to register single or multiple atlases to the images that need to be segmented; and (2) how to refine a segmented for the boundary or surface for the single-atlas-based method and how to combine or select the multiple aligned atlases multi-atlas-based method. Therefore, a good atlas-based segmentation system requires not only a robust registration algorithm but also an effective scheme to select the optimal atlas templates that are close to the segmenting image. In our single-atlas-based method, a hybrid deformable registration algorithm based on the NMI and NSSD was used to register the atlas (pre-RT MRI) to the post-RT MR image. This algorithm could capture the variations of anatomy and cope well with the local image contrast changes associated with radiation-induced tissue damage. A kernel SVM was used to combine multiple features extracted from an aligned subject-specific atlas. Our kernel SVM mapped the feature data from the aligned atlas space to the kernel feature space of higher dimensionality and then solved a linear problem separating the parotid and nonparotid tissues. Multiple features from subject-specific atlas pairs were used to train the kernel SVM, and the well-trained SVM based on RBF kernel could then robustly differentiate the parotid tissue from the surrounding tissues by statistically matching multiple texture features.
Future areas of study include speeding up the SVM training and segmentation by testing the sensitivity of multiple features and decreasing the number of feature numbers. Meanwhile, we are conducting a clinical longitudinal study with a larger cohort to further investigate the relationship between parotid volume changes and parotid gland function and validate if volume changes could predict xerostomia.
Conclusions
Studies have shown that volume changes of the parotid glands are correlated with the severity of radiation damage and may serve as a predictor for xerostomia. To better monitor radiation-induced volume change of the parotid gland and fully understand xerostomia in head and neck cancer radiation therapy, we developed a novel automatic MR parotid gland segmentation algorithm based on atlas registration and machine learning. We also demonstrated the feasibility and accuracy of our automatic segmentation algorithm in a clinical study. This segmentation method may be useful as we try to address xerostomia in patients after radiation therapy for head and neck malignancies.
Supplementary Material
Summary.
Parotid gland volume reduction has been associated with decreased saliva production and xerostomia (dry mouth) in head and neck cancer radiation therapy. In this study, an automated parotid segmentation method, based on atlas registration and machine learning, was developed to accurately quantify radiation-induced parotid gland change, using pre- and post-treatment magnetic resonance imaging. This automated segmentation tool will be valuable to carry out longitudinal or large-scale clinical studies to understand toxicity of the parotid gland and treat radiation-induced xerostomia.
Acknowledgments
Dr Xiaofeng Yang was supported in part by the US Department of Defense Research grant W81XWH-13-1-0269. Drs. Guanghui Cheng and Ning Wu were supported in part by the National Natural Science Foundation of China (81201737), the Natural Science Foundation of Jilin Province (20090458, 201015183), the Jilin University Fundamental Research Project (201103055) and the Young Scholars Research Foundation Program of China-Japan Union Hospital (2009).
Footnotes
This work was presented in part at the 55th Annual Meeting and Exhibition of the American Association of Physicists in Medicine, August 4-8, 2013, Indianapolis, Indiana.
Conflict of interest: none.
Supplementary material for this article can be found at www.redjournal.org.
References
- 1.Chao KS, Deasy JO, Markman J, et al. A prospective study of salivary function sparing in patients with head-and-neck cancers receiving intensity-modulated or three-dimensional radiation therapy: Initial results. Int J Radiat Oncol Biol Phys. 2001;49:907–916. doi: 10.1016/s0360-3016(00)01441-3. [DOI] [PubMed] [Google Scholar]
- 2.Eisbruch A, Kim HM, Terrell JE, et al. Xerostomia and its predictors following parotid-sparing irradiation of head-and-neck cancer. Int J Radiat Oncol Biol Phys. 2001;50:695–704. doi: 10.1016/s0360-3016(01)01512-7. [DOI] [PubMed] [Google Scholar]
- 3.Eisbruch A, Rhodus N, Rosenthal D, et al. How should we measure and report radiotherapy-induced xerostomia? Semin Radiat Oncol. 2003;13:226–234. doi: 10.1016/S1053-4296(03)00033-X. [DOI] [PubMed] [Google Scholar]
- 4.Braam PM, Roesink JM, Raaijmakers CP, et al. Quality of life and salivary output in patients with head-and-neck cancer five years after radiotherapy. Radiat Oncol. 2007;2:3. doi: 10.1186/1748-717X-2-3. [DOI] [PMC free article] [PubMed] [Google Scholar]
- 5.Ying M, Wu VWC, Kwong DLW. Comparison of sonographic appearance of normal and postradiotherapy parotid glands: a preliminary study. Ultrasound Med Biol. 2007;33:1244–1250. doi: 10.1016/j.ultrasmedbio.2007.02.016. [DOI] [PubMed] [Google Scholar]
- 6.Wang ZH, Yan C, Zhang ZY, et al. Radiation-induced volume changes in parotid and submandibular glands in patients with head and neck cancer receiving postoperative radiotherapy: A longitudinal study. Laryngoscope. 2009;119:1966–1974. doi: 10.1002/lary.20601. [DOI] [PubMed] [Google Scholar]
- 7.Teshima K, Murakami R, Tomitaka E, et al. Radiation-induced parotid gland changes in oral cancer patients: correlation between parotid volume and saliva production. Jpn J Clin Oncol. 2010;40:42–46. doi: 10.1093/jjco/hyp113. [DOI] [PubMed] [Google Scholar]
- 8.Wu VW, Ying MT, Kwong DL. Evaluation of radiation-induced changes to parotid glands following conventional radiotherapy in patients with nasopharyngeal carcinoma. Br J Radiol. 2011;84:843–849. doi: 10.1259/bjr/55873561. [DOI] [PMC free article] [PubMed] [Google Scholar]
- 9.Han X, Hoogeman MS, Levendag PC, et al. Atlas-based auto-segmentation of head and neck CT images. Med Image Comput Comput Assist Interv. 2008;2008(5242):434–441. doi: 10.1007/978-3-540-85990-1_52. [DOI] [PubMed] [Google Scholar]
- 10.Han X, Hibbard L, O'Connell N, Willcut V. Automatic segmentation of parotids in head and neck CT images using multi-atlas fusion. Medical Image Computing and Computer Assisted Intervention (MICCAI) 2010 Grand Challenges in Medical Image Analysis: Head & Neck Autosegmentation Challenge Beijing. 2010 [Google Scholar]
- 11.Daisne JF, Blumhofer A. Atlas-based automatic segmentation of head and neck organs at risk and nodal target volumes: a clinical validation. Radiat Oncol. 2013;8:154. doi: 10.1186/1748-717X-8-154. [DOI] [PMC free article] [PubMed] [Google Scholar]
- 12.Gorthi S, Cuadra M, Schick U, et al. Multi-atlas based segmentation of head and neck CT images using active contour framework. Medical Image Computing and Computer Assisted Intervention (MICCAI) 2010 grand challenges in medical image analysis: Head & neck autosegmentation challenge Beijing. 2010 [Google Scholar]
- 13.Qazi AA, Pekar V, Kim J, et al. Auto-segmentation of normal and target structures in head and neck CT images: A feature-driven model-based approach. Med Phys. 2011;38:6160–6170. doi: 10.1118/1.3654160. [DOI] [PubMed] [Google Scholar]
- 14.Hollensen C, Hansen MF, Hojgaard L, et al. Segmenting the parotid gland using registration and level set methods. Medical Image Computing and Computer Assisted Intervention (MICCAI): Grand challenges in medical image analysis: head & neck autosegmentation challenge Beijing. 2010 [Google Scholar]
- 15.Yang J, Zhang Y, Zhang L, et al. Automatic segmentation of parotids from CT scans using multiple atlases. MICCAI workshop proceedings: medical image analysis for the clinicdA grand challenge Beijing. 2010:323–330. [Google Scholar]
- 16.Pekar V, Allaire S, Qazi A, et al. Head and neck auto-segmentation challenge: segmentation of the parotid glands. Medical Image Computing and Computer Assisted Intervention (MICCAI) 2010 grand challenges in medical image analysis: Head & neck auto-segmentation challenge Beijing. 2010 [Google Scholar]
- 17.Nomayr A, Lell M, Sweeney R, et al. MRI appearance of radiation-induced changes of normal cervical tissues. Eur Radiol. 2001;11:1807–1817. doi: 10.1007/s003300000728. [DOI] [PubMed] [Google Scholar]
- 18.Yang X, Fei B. A wavelet multiscale denoising algorithm for magnetic resonance (MR) images. Measurement Science and Technology. 2011;22:025803. doi: 10.1088/0957-0233/22/2/025803. [DOI] [PMC free article] [PubMed] [Google Scholar]
- 19.Yang XF, Fei BW. A multiscale and multiblock fuzzy C-means classification method for brain MR images. Medical Physics. 2011;38:2879–2891. doi: 10.1118/1.3584199. [DOI] [PMC free article] [PubMed] [Google Scholar]
- 20.Lindeberg T. Edge detection and ridge detection with automatic scale selection. Int J Comput Vis. 1998;30:117–154. [Google Scholar]
- 21.Manjunath BS, Ma WY. Texture features for browsing and retrieval of image data. IEEE Trans Pattern Anal Mach Intell. 1996;18:837–842. [Google Scholar]
- 22.Han J, Ma KK. Rotation-invariant and scale-invariant Gabor features for texture image retrieval. Image Vis Comput. 2007;25:1474–1481. [Google Scholar]
- 23.Meyer D, Leisch F, Hornik K. The support vector machine under test. Neurocomputing. 2003;55:169–186. [Google Scholar]
- 24.Boser BE, Guyon IM, Vapnik VN. A Training algorithm for optimal margin classifiers. Proceedings of the 5th Annual ACM Workshop on Computational Learning Theory; Pittsburgh, PA. ACM Press; 1992. pp. 144–152. [Google Scholar]
- 25.Vasquez Osorio EM, Hoogeman MS, Al-Mamgani A, et al. Local anatomic changes in parotid and submandibular glands during radiotherapy for oropharynx cancer and correlation with dose, studied in detail with nonrigid registration. Int J Radiat Oncol Biol Phys. 2008;70:875–882. doi: 10.1016/j.ijrobp.2007.10.063. [DOI] [PubMed] [Google Scholar]
- 2.Roesink JM, Moerland MA, Battermann JJ, et al. Quantitative dose-volume response analysis of changes in parotid gland function after radiotherapy in the head-and-neck region. Int J Radiat Oncol Biol Phys. 2001;51:938–946. doi: 10.1016/s0360-3016(01)01717-5. [DOI] [PubMed] [Google Scholar]
- 27.Yang XF, Tridandapani S, Beitler JJ, et al. Ultrasound Histogram Assessment of Parotid Gland Injury Following Head-and-Neck Radiotherapy: A Feasibility Study. Ultrasound in Medicine and Biology. 2012;38:1514–1521. doi: 10.1016/j.ultrasmedbio.2012.05.005. [DOI] [PMC free article] [PubMed] [Google Scholar]
Associated Data
This section collects any data citations, data availability statements, or supplementary materials included in this article.


