

Abstract
Chondrocytes and synovial cells synthesize Cartilage Oligomeric Matrix Protein (COMP) when activated by proinflammatory cytokines. The aim of this study was to analyze and compare ultrasound parameters of joint inflammation, effusion and synovitis with the levels of COMP in the serum of patients with primary osteoarthritis. Ultrasound was done and the concentration of COMP (ng/mL was examined in 88 patients. 75% of patients had effusion (size 10.13±4.35 mm), 62.5% had effusion in lateral recessus (LR), 28.4% (size 8.53±2.27 mm) in suprapatelar (SR), and 27.3% (size 11.38±4.44 mm) in medial (MR). 67% of patients had synovitis size 4.84±3.57 mm in SR, 3.15±1.86 mm in MR; and 6.09±2.80 mm in LR. 17.0% of patients had nodular type of synovitis, 30.7% had diffusive, and 19.3% nodular – diffusive. There was a significant link between the size of synovitis and effusion in SR (r=0.966, p=0.000), MR (r=0.812, p=0.009) and LR (r=0.886, p=0.003). The median of COMP concentration was 54 (44.5-58) ng/mL in patients without effusion. In those with effusion it was 57 (48.75-64.25) ng/mL (p=0.030). Without synovitis it was 52 (45.5-58) ng/mL, with synovitis 58 (50-66) ng/mL, (p=0.006), diffusion type synovitis 60 (50-67) ng/mL, nodular 57 (50-62) ng/mL, nodular-diffusion 54 (44.5-66.5) ng/mL (p=0.014). With longer osteophytes the median of COMP was 56 (48-64) ng/mL, with shorter osteophytes 55 (46.5-59) ng/mL (p=0.000). Cartilage oligomeric matrix protein has a moderate significance in the assessment of disturbance of the metabolism of synovial and cartilage tissue in patients with knee osteoarthritis (sensitivity=59%; specificity=50%; cut off=53.5 ng/mL).
KEY WORDS: knee, osteoarthritis, synovitis, effusion, Cartilage Oligomeric Matrix Protein
INTRODUCTION
Knee osteoarthritis is degenerative disease of the joints with progressive character. It induces intensive pain and restricts knee motion, thus disturbing everyday activities. It is characterized by focal deterioration and abrasion of articular cartilage, sclerosis, cystic formations below the bone surface and formation of osteophytes on the joint surface [1]. Because of secondary inflammation and prolipheration of synovial membrane, periodical swelling can appear with pain [2, 3]. Chronic synovitis is most often found in the later stage of the disease [4]. The presence of synovitis in the early phase leads to the progression of chondropathy.
Ultrasound technique of joint examination (arthrosonography) is highly advised as a standard in rheumatology, since it is more sensitive in comparison to the clinical examination [5] and provides reliable and quick data. Ultrasound is very useful in diagnosing and monitoring of joint effusion and synovitis, especially in early osteoarthritis, with the results that are comparable with MRI [6]. Biochemical markers (biomarkers) are molecules or fragments of connective tissue matrix released in biological fluids during the process of tissue metabolism that can be measured using immunoassay method [7, 8]. The trend of applying whole-genome analysis techniques has also contributed to a better understanding of physiological and pathological processes involved in homeostasis of bone and cartilage tissues [9]. The key role of inflammation in osteoarthritis is supported by histological finding of synovial joint inflammation and increased biomarker level of synovial tissue metabolism and pro-inflammatory cytokines in chondrocytes [6]. Today, potentially specific biochemical markers that reflect the quantitative and dynamic degeneration and reparation changes in remodelling of joint tissue in osteoarthritis are being developed [6, 10, 11, 12, 13]. Cartilage Oligomeric Matrix Protein - COMP is a non-collagen protein of articular cartilage matrix [14]. Its molecule is a pentamer with the molecular mass of 435 kDa, which contains five identical disulfide related subunits [15]. It is synthesized by chondrocytes and synovial cells after activation by cytokines. COMP is detected in the tendon, meniscus, ligament and synovial membrane in very small quantities, but it cannot be detected in other organs that are rich in cartilage, such as the lungs and bronchi [16]. This protein enters the composition of collagen type II regulates and stabilizes the collagen network in cartilage tissue [17]. It is useful as a marker of early cartilage destruction since released during the tearing of collagen network, which results in cartilage deterioration [18]. The growing concentration of COMP reflects disease progression in the early stages [19], and it is a very sensitive tool of radiological changes that can be detected only in the later stages of disease [11]. The levels of COMP in serum and urine are increased in patients with osteoarthritis in comparison to the control group [11, 20]. The objective of the study was to analyze and establish a degree of correlation between the ultrasound parameters of joint inflammation, defined as effusion and synovitis (hiperthrophy of synovial membrane), with the levels of COMP biomarker in serum in patients with primary osteoarthritis.
MATERIALS AND METHODS
Patients
The analysis included 88 patients diagnosed with primary knee osteoarthritis according to the criteria of ACR (American College of Rheumatology), where the disease was present at least six months prior to the beginning of the study. The patients who had knee injuries six months prior to the research, total or partial endoprothesis or osteotomy of the knee joint, arthroscopy of knee joint in the previous year, or received corticosteroid or chondroprotective substance intraarticularly over the period of four weeks prior to the research were excluded from the research.
Procedure
The rheumatologist produced ultrasound of both knees in B mode using the apparatus SDU-1200, linear probe of 7.5-10 MHz. Using the front longitudinal approach, the signs of presence or absence of synovial inflammation were determined. Effusion was defined as the size of discharge greater than 4 mm in suprapatelar, lateral and/or medial recessus of the knee. Synovitis was defined as the thickening of synovial membrane greater than 4mm. Maximum depth of discharge and synovial tissue was measured and expressed in mm. Morphologically, discharge and synovitis (nodular, diffusion or nodular-diffusion type) were marked as present or absent. Blood samples were collected by means of vein puncture using the antecubital vein. The blood samples were allowed to clot for 60 min. at room temperature. They were centrifuged at 2000 g for 10 min at 4°C and serum samples were stored at -20°C until analyzed. The concentration of COMP (ng/mL) was determined using Cartilage Oligomeric Matrix Protein (Wieslab™ hCOMP quantitative kit, Eurodiagnostica, Lund, Sweden). The assay utilized native human articular cartilage COMP coated to 96-well microtiter plates and a rabbit polyclonal antiserum directed to human COMP. It was in standard ELISA inhibition format including an overnight pre-incubation step with a sample and primary antiserum. After the overnight pre-incubation, the solution was transferred to the COMP coated plate. Bound antibody was detected using an alkaline phosphatase labelled as anti rabbit IgG conjugate. Samples were tested in duplicate, according to the recommendations of the manufacturer.
Statistical analysis
During the procedure, the following descriptive statistics were used: arithmetic mean, standard deviation, median, quartiles. For the examination of normal dispersion, Kolmogorov-Smirnov and Shapiro-Wilk were used. The comparison of middle values of two populations was done using the t test and Mann-Whitney test. The correlation between the category variables was examined using the Hi square test. The correlation between the categories of constant variables was examined using the Spearman coefficient of correlation. The dependence of constant variables and other variables was examined using linear regression. Backward method was also used with regressions. Confidence level in all applied methods was within the limit of 0.05. For the examination of marker quality, ROC curve was used and suitable cut off was determined. Thus, the sensitivity and specificity of the obtained test was performed.
RESULTS
Arthrosonography was performed in 88 patients, 20 (22.7%) males and 68 (77.3%) females with primary knee OA. The average age of the subjects was 69.97±9.37 (minimum 44, maximum 88), and duration of the disease was 6.46±6.73 (minimum 0.5, maximum 37) years. Using arthrosonography, the effusion was determined in 75% of patients; 28.4% had effusion in suprapatelar (SR), 27.3% in medial (MR), and 62.5% in lateral (LR) recessus of the knee joint. Prolypheration of the synovial membrane (synovitis) was proved in 67% of patients; 17.0% of the subjects had nodular, 30.7% had diffusion and 19.3% had nodular-diffusion type of synovitis. The average value of effusion in SR was 10.13±4.35 mm, in MR 8.53±2.27 mm, and in LR 11.38±4.44 mm. Mean values of synovitis size were 4.84±3.57 mm in SR, 3.15±1.86 mm in MR and 6.09±2.80 mm in LR.
A significant link was determined between the average values of prolipheral synovial membrane thickness and the size of effusion in suprapatelar (r=0.812; p=0.000), medial (r=0.886; p=0.000) and lateral (r=0.966; p=0.000) recessus (Figure 1). A significant link was also determined between the size of synovitis and the size of effusion in MR (r=0.325, p=0.002) and LR (r=0.317, p=0.003). During ultrasound examination, a significant difference was found between the median of COMP biomarker concentration in patients with and without effusion, regardless of the localization and size (p=0.030). Median of COMP concentration in 25% of patients where effusion could not be seen by arthrosonograpy was 54 (44.5-58) ng/mL, while 75% of patients had effusion of 57 (48.75-64.25) ng/mL (Table 1). A significant difference was found in the COMP concentration between patients with present or absent prolipheration of synovial membrane (p=0.006). Median of COMP concentration in 32.96% of patients without prolipheration of synovial membrane seen by ultrasound was 52 (45.5-58) ng/mL, while 67% of patients with prolipheration of synovial membrane had 58 (50-66) ng/mL (measured by ultrasound – see Table 1). A significant correlation could not be proved between the median of COMP concentration and the size of effusion in SR (r=0.076; p=0.484), MR (r=0.043; p=0.692), LR (r=0.044; p=0.687) and synovitis in SR (r=0.086; p=0.428), MR (r=0.026; p=0.809) and LR (r=0.105; p=0.330). A significant difference was found in the COMP concentrations between patients with nodular, diffusive or nodular-diffusive synovitis (p=0.014) (Figure 2). Median of the COMP concentration in patients with longer osteophytes was 56 (48-64) ng/mL (Table 2). Sensitivity of COMP biomarker to the presence of effusion was 59%, while its specificity was 50% (cut off=53.5 ng/mL; Area 0.655; p=0.030; confidence interval 0.534-0.776) (Figure 3).
FIGURE 1.
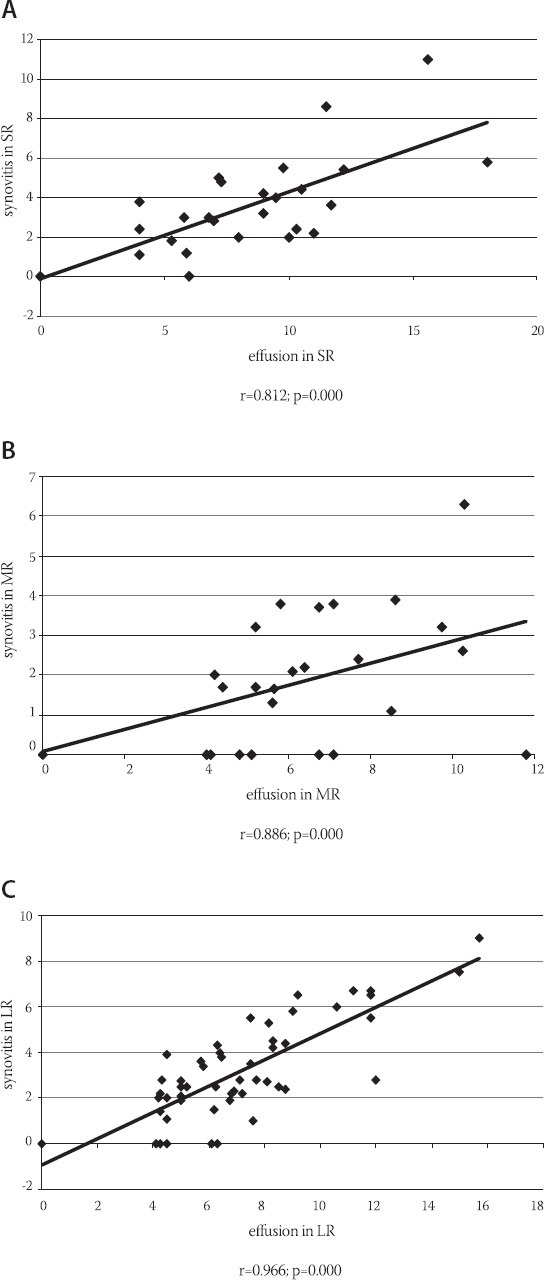
Link between the average values of prolipheral synovial membrane thickness and the size of effusion in suprapatelar, medial and lateral recessus
TABLE 1.
Comparison of the median of the concentration of COMP biomarker between patients with present or absent effusion and prolipheration of synovial membrane
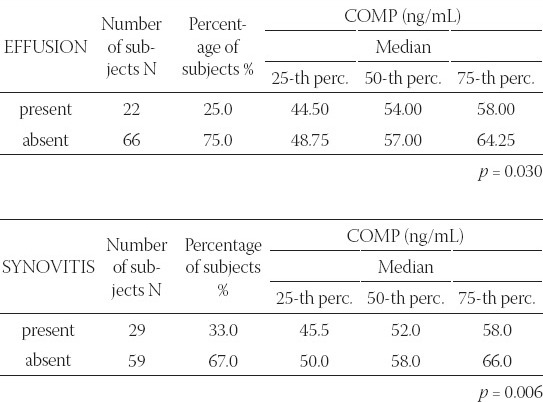
FIGURE 2.
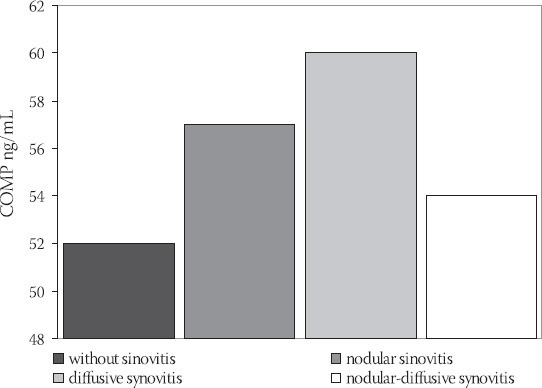
Comparison of median of COMP biomarker concentrations between patients with nodular, diffusive or nodular-diffusive synovitis (p= 0.014)
TABLE 2.
Comparison of median of COMP biomarker concentrations between patients with shorter or longer osteophytes on medial and/or lateral kondyles of tibia and femur
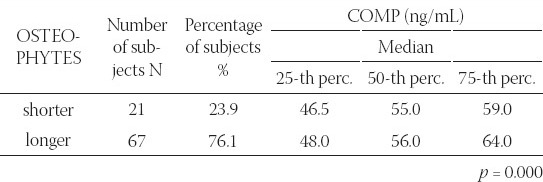
FIGURE 3.
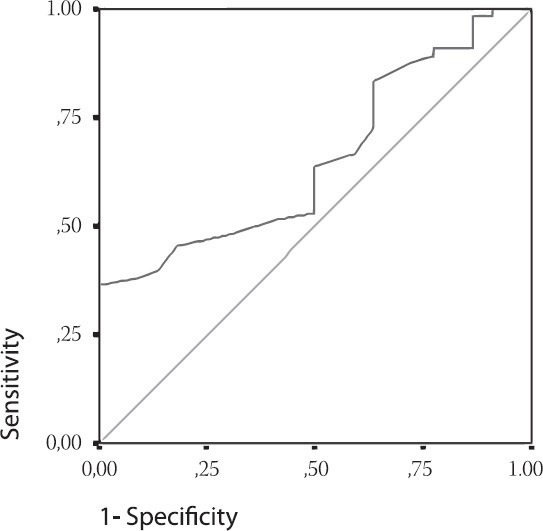
ROC Curve. Cartilage Matrix Oligomeric protein as a marker of the effusion. Cut off = 53.5 ng/mL; Area 0.655; p=0.030; Confidence interval 0.534-0.776. Diagonal segments are produced by ties.
DISCUSSION
Arthrosonography is very useful in diagnosing and monitoring the size and localization of effusion and synovitis [5]. The link between synovial inflammation and progression of structural damages is shown in many studies. One-year-longitudinal study of Ayral et al., showed that greater volume of aspirated effusion from the painful knee could predict the progression of arthrosis, defined by narrowing of the joint area [3]. We harmonized arthroscopic measurements in our study with the recommendations of European multcentric studies – EULAR report, part 1 [21] and part 2 [22] that investigated the importance of synovial inflammation (defined as hypertrophy and effusion) in the genesis of pain worsening and structural progression in patients with osteoarthritis (OA) of the knee joint. In our research, 75% of patients with knee OA had effusion. Similar results were also found in the literature, showing the presence of effusion in 61% -79% of joints with osteoarthritis [5, 23]. The largest number of our patients had effusion in lateral recessus (LR) – 62.5%, while 28.4% of patients had effusion in suprapatelar recesus (SR), and 27.3% in medial recesus (MR) of the knee. In the study published in 2005 [24], synovitis was detected using arthrosonography in 51.2% of patients, thus confirming it as an informative diagnostic method in discovering synovitis, including the subclinical form. In our research, similar results were also obtained and 67% of patients had proliferation of synovial membrane (synovitis) out of whom 17.0% had nodular type, 30.7% diffusive, and 19.3% nodular-diffusive type. In our patients, the average value of effusion in SR was 10.13±14.35 mm, in MR 8.53±2.27 mm, and in LR 11.38±4.44 mm. The average value of proliferated synovial membrane was in SR 4.84±3.57 mm, in MR 3.15±1.86 mm and in LR 6.09±2.80 mm. The greatest number of patients had effusion in LR. The size of effusion and synovitis was the greatest in LR recessus in patients with OA. We found that there was a significant correlation between the average values of synovitis size and effusion in SR (r=0.966, p=0.000), MR (r=0.812, p=0.009) and LR (r=0.886, p=0.003), which proved that higher prolipheration of synovial membrane in individual recesus led to more distinct effusion in it. It was also found that significant correlation existed between the average value of effusion in MR and prolipheration of synovial membrane in SR (r=0.325, p=0.002), as well as the average value of effusion in LR and prolipheration of synovial membrane in SR (r=0.317, p=0.003). This indicated that high prolipheration of synovial membrane in SR led to the presence of significant effusion in all three recessus of the knee joint and maintained more intensive inflammation of the knee joint. Inflammation of the joint in osteoarthritis is usually gentle and does not lead to disturbance of parameters of the acute phase of inflammation, but can be proved using synovial markers, which are the indicators of synovial activity. Increased values of COMP and hyaluron acid (HA) may suggest that synovial inflammation has a central role in the patogenesis of osteoarthritis. The study of Bruyer et al. [6] showed that serum levels of HA and COMP correlated with the values of joint damage obtained by magnetic resonance. Physical activity can influence the serum level of COMP, but daily values are constant. Recently published study about daily variations of COMP levels in the patients with knee osteoarthritis and with RA pointed out that there were no significant variations in the level of COMP, monitored during the day [25]. This suggests that in clinical practice, further standardization of sample taking time is not necessary. The increasing COMP concentration reveals the progression of the disease especially in the early stage [19], and is a lot more sensitive than radiological changes that can be discovered in the late stage of the disease [11]. Our research showed a significant difference between the median of COMP biomarker concentration in patients with and without effusion during ultrasound examination, regardless of the localization and size (p=0.030). The median of COMP concentration in 25% of patients where effusion could not be seen by arthrosonograpy was 54 (44.5-58) ng/mL, while 75% of patients had effusion of 57 (48.75-64.25) ng/mL. This shows that COMP concentrations in serum were higher in patients with knee joint inflammation, which was indicated by the increased quantity of synovial fluid. It was also found that there was a significant difference in the COMP concentrations between patients with and without prolipheration of synovial membrane (p=0.006). The median of COMP concentration in 32.96% of patients without prolipheration of synovial membrane seen by ultrasound was 52 (45.5-58) ng/mL, while in 67% of patients with prolipheration of synovial membrane seen by ultrasound it was 58 (50-66) ng/mL. This result points to the fact that the values of this biomarker also increase in the serum when there is an inflammation in the knee joint, presented by hyperthrophy of the synovial membrane. The connection was not proved between the average values of COMP concentration with the size of effusion in SR (r=0.076; p=0.484), in MR (r=0.043; p=0.692), in LR (r=0.044; p=0.687) and synovitis in SR (r=0.086; p=0.428), in MR (r=0.026; p=0.809) and in LR (r=0.105; p=0.330). The results of our research also indicate a significant difference in the mean values of COMP concentration between patients with synovitis of nodular, diffusive or nodular diffusive type (p=0.014). The median of COMP biomarker concentration in the patients without prolypheration of synovial membrane was 52 (45.5-58) ng/mL; in those with prolypheration of synovial membrane it was 57 (50-62) ng/mL for nodular type, 60 (50-67) ng/mL for diffusive type and 54 (445-66.5) ng/mL for nodular-diffusive type. The highest COMP concentration in serum was found in patients with synovial membrane of diffusive type, indicating the presence of the most intensive inflammation in the knee joint. Our research shows that there is a significant difference in the concentration of COMP biomarkers between patients with shorter and longer osteophytes on kondyles of tibia and femur (p=0.000). The median of COMP concentration in 21 patients with shorter osteophytes was 55 (46.5-59) ng/mL. In 67 patients with longer osteophytes, it was 56 (48-64) ng/mL. Jung et al., [19] obtained similar results, showing that patients with longer medial osteophytes and with great capsular distension had higher levels of HA and COMP in serum compared to patients shorter osteophytes. The results published by Garnero et al., [11] and Sharif et al., [26] confirm that the levels of COMP, PIIINP and HA serum were higher in patients with osteoarthritis, thus indicating the increased synovial and cartilage metabolism. The study of Vilim et al., [20] recommended COMP as the marker for OA progression after three-year monitoring of the COMP in serum of the patient with osteoarthritis of the knee. It was concluded that high level of COMP was found in patients with radiographic changes, thus being a prognoses marker of illness progression. The results of our research point to the fact that COMP biomarker can be an indicator of the appearance of effusion (sensitivity=59%, specificity=50%). The cut off was found to be 53.5 ng/mL, which means that all patients with osteoarthritis and COMP biomarker concentration below 53.5 ng do not have knee inflammation, while the value of COMP biomarker in serum above 53.5 ng/mL shows a severe degree of osteoarthritis and the presence of inflammation.
CONCLUSION
Based on the provided results, it can be concluded that the size of the effusion in the knee is related to the size of synovitis in patients with OA. The patients with effusion, synovitis and longer osteophytes in the knee have higher concentration of COMP biomarker in serum than those without OA inflammatory indicators. Cartilage oligomeric matrix protein has a moderate significance in the assessment of disturbance of the metabolism of synovial and cartilage tissue in patients with knee osteoarthritis.
ACKNOWLEDGMENT
The study was supported by Medical Faculty, University of Kragujevac (number of project JP/10/07; number of contract 01-6497; 04.12.2007.)
DECLARATION OF INTEREST
We and our institution do not have conflict of interest and do not have any financial or personal relationships that could inappropriately influence (or bias) the author’s decisions, work, or manuscript.
REFERENCES
- [1].Martel-Pelletier J. Pathophysiology of osteoarthritis. Osteoarthritis Cartilage. 1999;7:371–373. doi: 10.1053/joca.1998.0214. [DOI] [PubMed] [Google Scholar]
- [2].Hill CL, Gale DG, Chaisson CE, Skinner K, Kazis L, Gale E, et al. Knee effusion, popliteal cysts, and synovial thickening: association with knee pain in osteoarthritis. J Rheumatol. 2001;28:1330–1337. [PubMed] [Google Scholar]
- [3].Ayral X, Pickering EH, Woodworth TG, Mackillop N, Dougados M. Synovitis predicts the arthroscopic progression of medial tibiofemoral knee osteoarthritis. Arthritis Rheum. 2001;44(9):101. doi: 10.1016/j.joca.2005.01.005. [DOI] [PubMed] [Google Scholar]
- [4].Felson DT. An update on the pathogenesis and epidemiology of osteoarthritis. Radiol Clin N Am. 2004;42:1–9. doi: 10.1016/S0033-8389(03)00161-1. [DOI] [PubMed] [Google Scholar]
- [5].Kane D, Balint PV, Sturrock RD. Ultrasonography is superior to clinical examination in the detection and localization of knee joint effusion in rheumatoid arthritis. J Rheumatol. 2003;30(5):966–971. [PubMed] [Google Scholar]
- [6].Bruyere O, Collette J, Kothari M, Zaim S, White D, Genant H, et al. Osteoarthritis, magnetic resonance imaging, and biochemical markers: a one year prospective study. Ann Rheum Dis. 2006;65:1050–1054. doi: 10.1136/ard.2005.045914. [DOI] [PMC free article] [PubMed] [Google Scholar]
- [7].Garnero P. New biochemical markers of cartilage turnover in osteoarthritis: recent developments and remaining challenges. IBMS BoneKEy. 2007;4(1):7–18. [Google Scholar]
- [8].Garnero P, Mazières B, Guéguen A, Abbal M, Berdah L, Lequesne M, et al. Cross-sectional association of 10 molecular markers of bone, cartilage, and synovium with disease activity and radiological joint damage in patients with hip osteoarthritis: the ECHODIAH cohort. J Rheumatol. 2005;32(4):697–703. [PubMed] [Google Scholar]
- [9].Borovecki F, Pecina-Slaus N, Vukicevic S. Biological mechanisms of bone and cartilage remodeling - genomic perspective. Int Orthop. 2007;31:799–805. doi: 10.1007/s00264-007-0408-8. [DOI] [PMC free article] [PubMed] [Google Scholar]
- [10].Kraus VB. Biomarkers in osteoarthritis. Curr Opin Rheumatol. 2005;17:641–646. doi: 10.1097/01.bor.0000174195.15421.17. [DOI] [PubMed] [Google Scholar]
- [11].Garnero P, Piperno M, Gineyts E, Christgau S, Delmas PD, Vignon E. Cross sectional evaluation of biochemical markers of bone, cartilage, and synovial tissue metabolism in patients with knee osteoarthritis: relations with disease activity and joint damage. Ann Rheum Dis. 2001;60:619–626. doi: 10.1136/ard.60.6.619. [DOI] [PMC free article] [PubMed] [Google Scholar]
- [12].Berger C, Kröner A, Stiegler H, Thomas Leitha T, Engel A. Elevated levels of serum type I collagen C-telopeptide in patients with rapidly destructive osteoarthritis of the hip. Int Orthop. 2005;29(1):1–5. doi: 10.1007/s00264-004-0608-4. [DOI] [PMC free article] [PubMed] [Google Scholar]
- [13].Vjollca SM, Sylejman R, Suzana MK MR. Extra-articular manifestations of seronegative and seropositive rheumatoid arthritis. Bosnian journal of basic medical sciences. 2010;10(1):26–31. doi: 10.17305/bjbms.2010.2729. [DOI] [PMC free article] [PubMed] [Google Scholar]
- [14].Clark AG, Jordan JM, Vilim V, Renner JB, Dragomir AD, Luta G, et al. Serum cartilage oligomeric matrix protein reflects osteoarthritis presence and severity. Arthritis Rheum. 1999;42:2356–2364. doi: 10.1002/1529-0131(199911)42:11<2356::AID-ANR14>3.0.CO;2-R. [DOI] [PubMed] [Google Scholar]
- [15].Hedbom E, Antonsson P, Hjerpe A, Aeschlimann D, Paulsson M, Rosa-Pimentel E, et al. Cartilage matrix proteins. An acidic oligomeric protein (COMP) detected only in cartilage. J Biol Chem. 1992;267:6132–6136. [PubMed] [Google Scholar]
- [16].Muller G, Michel A, Altenburg E. COMP (cartilage oligomeric matrix protein) is synthesized in ligament, tendon, meniscus, and articular cartilage. Connect Tissue Res. 1998;39:233–244. doi: 10.3109/03008209809021499. [DOI] [PubMed] [Google Scholar]
- [17].Heinegård D, Lorenzo P, Saxne T. Matrix glycoproteins and proteoglycans in cartilage. In: Harris ED Jr, Budd RC, Genovese MC, et al., editors. Kelley's textbook of rheumatology. 7th edn. Philadelphia: Elsevier Saunders; 2005. pp. 48–62. [Google Scholar]
- [18].Larsson E, Erlandsson Harris H, Larsson A, Månsson B, Saxne T, Klareskog L. Corticosteroid treatment of experimental arthritis retards cartilage destruction as determined by histology and serum COMP. Rheumatology. 2004;43:428–434. doi: 10.1093/rheumatology/keh073. [DOI] [PubMed] [Google Scholar]
- [19].Jung YO, Do JH, Kang HJ, Yoo SA, Yoon CH, Kim HA, et al. Correlation of sonographic severity with biochemical markers of synovium and cartilage in knee osteoarthritis patients. Clin Exp Rheumatol. 2006;24(3):253–259. [PubMed] [Google Scholar]
- [20].Vilím V, Olejárová M, Machácek S, Gatterová J, Kraus VB, Pavelka K. Serum levels of cartilage oligomeric matrix protein (COMP) correlate with radiographic progression of knee osteoarthritis. Osteoarthritis Cartilage. 2002;10(9):707–713. doi: 10.1053/joca.2002.0819. [DOI] [PubMed] [Google Scholar]
- [21].D’Agostino MA, Conaghan P, Le Bars M, Baron G, Grassi W, Martin-Mola E, et al. EULAR report on the use of ultrasonography in painful knee osteoarthritis. Part 1: prevalence of inflammation in osteoarthritis. Ann Rheum Dis. 2005;64(12):1703–1709. doi: 10.1136/ard.2005.037994. [DOI] [PMC free article] [PubMed] [Google Scholar]
- [22].Conaghan P, D’Agostino MA, Ravaud P, Baron G, Le Bars M, Grassi W, et al. EULAR report on the use of ultrasonography in painful knee osteoarthritis. Part 2: exploring decision rules for clinical utility. Ann Rheum Dis. 2005;64(12):1710–1714. doi: 10.1136/ard.2005.038026. [DOI] [PMC free article] [PubMed] [Google Scholar]
- [23].Mendieta ME, Cobo Ibanez T, Uson Jaeger J, Bonilla Hernan G, Martin Mola E. Clinical and ultrasonographic findings related to knee pain in osteoarthritis. Osteoarthritis Cartilage. 2006;14(6):540–544. doi: 10.1016/j.joca.2005.12.012. [DOI] [PubMed] [Google Scholar]
- [24].Maiko O, Bagirova GG, Popova LV. Diagnostic possibilities of ultrasonic scanning of the knee joints in osteoarthrosis. Ter Arkh. 2005;77(4):44–50. [PubMed] [Google Scholar]
- [25].Andersson MlE, Petersson IF, Karlsson KE, Jonsson EN, Månsson B. Diurnal variation in serum levels of cartilage oligomeric matrix protein in patients with knee osteoarthritis or rheumatoid arthritis. Ann Rheum Dis. 2006;65:1490–1494. doi: 10.1136/ard.2005.051292. [DOI] [PMC free article] [PubMed] [Google Scholar]
- [26].Sharif M, Granell R, Johansen J, Clarke S, Elson C, Kirwan JR. Serum cartilage oligomeric matrix protein and other biomarker profiles in tibiofemoral and patellofemoral osteoarthritis of the knee. Rheumatology. 2006;45(5):522–526. doi: 10.1093/rheumatology/kei216. [DOI] [PubMed] [Google Scholar]