

Abstract
Alcohol purchase tasks (APTs) are increasingly being used to assess behavioral economic demand for alcohol. Prior studies utilizing APTs have typically assessed demand for hypothetical outcomes, making the extent to which these hypothetical measures reflect preferences when actual rewards are at stake an important empirical question. This study examined alcohol demand across hypothetical and incentivized APTs. Nineteen male heavy drinkers completed two APTs—one for hypothetical alcohol and another in which one randomly-selected outcome was provided. Participants were given an opportunity to consume the alcohol associated with their choice on the incentivized APT during a self-administration period in a simulated bar environment. Results indicated generally close correspondence between APT versions, though participants were more sensitive to increases in price and tended to consume more at low prices on the incentivized version. Estimated consumption on the incentivized APT was highly correlated with the amount of alcohol consumed in the laboratory (r = .87, p < .001), suggesting that APT responses are valid indicators of actual drinking behavior. These results provide further evidence of congruence of demand-based decision-making when rewards are hypothetical vs. actually available. Implications for behavioral economic approaches to addictive behavior and directions for future research are discussed.
Keywords: Alcohol, Behavioral Economics, Demand, Purchase Task
1. Introduction
Behavioral economic demand refers to the relationship between consumption of a commodity and its cost and has provided a useful framework for investigating how individuals with substance use disorders consistently overvalue addictive drugs relative to other rewards (Bickel et al. 2014). Demand curve analysis is typically used to translate price-level consumption values into indices of motivation, including intensity (i.e., consumption at zero cost), breakpoint (i.e., the first price that suppresses consumption to zero), Omax (i.e., the maximum expenditure across prices), Pmax (i.e., the price at which demand becomes elastic, corresponding to the price at which Omax is reached), and elasticity (i.e., proportionate price sensitivity) (Hursh and Silberberg 2008; Murphy and MacKillop 2006). A final index, essential value (E.V.) is presumed to underlie demand elasticity independent of the scalar properties of the reinforcer itself (Hursh 2014).
Demand can be readily assessed via self-report purchase tasks that ask individuals how much of an addictive commodity (e.g., alcohol, tobacco, illicit drugs) they would consume at escalating prices (Collins et al. 2014; Jacobs and Bickel 1999; MacKillop et al. 2008; Murphy and MacKillop 2006). Studies using alcohol purchase tasks (APTs), for instance, have found that alcohol demand is associated with quantity/frequency of alcohol consumption, alcohol use disorder severity, and treatment outcomes (e.g., Murphy and MacKillop 2006; MacKillop, Miranda, et al. 2010; MacKillop and Murphy 2007). State-based APTs have also been developed for investigating dynamic influences on alcohol motivation (MacKillop, O'Hagen, et al. 2010; Amlung et al. 2012). Demand indices obtained from these measures have been shown to complement subjective measures of alcohol craving following alcohol cue exposures and negative affect inductions (e.g., MacKillop, O'Hagen, et al. 2010; Amlung et al. 2012; Amlung and MacKillop 2014).
An important task parameter that differs across studies is the extent to which individuals experience the outcomes of their choices. Hypothetical measures are most common, though prior studies have increased the ecological validity of state-based measures by presenting choices for actual outcomes, using tasks that provide one of choices made (Amlung et al. 2012; MacKillop et al. 2012; MacKillop et al. 2014). While prior research has found close correspondence between preferences for hypothetical and actual rewards on other behavioral economic measures, such as delay discounting (Bickel et al. 2009; Madden et al. 2003; Johnson and Bickel 2002), only one study to our knowledge has addressed this question for demand. Amlung et al. (2012) administered two APTs—one for hypothetical rewards and another for actual rewards in which one randomly-selected outcome was provided—and found high magnitude correlations between demand preferences on the hypothetical and incentivized APTs. Moreover, the association between self-reported consumption on the APT and actual alcohol consumption during a laboratory self-administration period was high (r = .87). High correspondence between self-reported consumption and actual consumption has also been reported using a cigarette purchase task (MacKillop et al. 2012).
Given that only one study to date has examined the congruence of hypothetical and incentivized APTs, more work is clearly needed in this area. As such, the goals of the present study were to further compare demand across hypothetical and incentivized APTs and to examine the correspondence between self-reported consumption and actual drinking during a laboratory self-administration period. The data come from a larger study examining the neural correlates of alcohol demand (see MacKillop et al. 2014). We hypothesized that there would be high correspondence between hypothetical and incentivized APT performance and similarly high correspondence between APT consumption and actual drinking.
2. Materials and Methods
2.1. Sample
The present sample comprised 19 male heavy drinkers. Participants were recruited from the University of Georgia and surrounding Athens, GA community via flyers and newspaper advertisements. Inclusion criteria for the study were: (1) male; (2) 21-31 years of age; (3) heavy drinker status (i.e., drinking 21+ standard drinks per week); (4) right-handed; (5) use of a personal computer at least weekly; (6) not seeking treatment for alcohol problems; (7) no DSM-IV substance use disorder other than alcohol or nicotine use disorder, or other Axis I disorders; and (8) no contraindications for MRI scanning. Participants were primarily young adults (M age = 22.84, SD = 2.89), 79% Caucasian, and had a median income of $45-60,000 annually. Participants reported drinking an average of 33.99 drinks/week (SD = 10.91).
2.2. Assessment
Participants completed two versions of a state-based APT, one for hypothetical alcohol and money and another for real alcohol and money (Amlung et al. 2012). The assessments were designed to be administered in a functional magnetic resonance imaging (fMRI) environment (see MacKillop et al. 2014). Participants were asked how many drinks they would purchase at 22 randomized prices, ranging from $0.01 to $15.00/drink. Participants were given a $15 ‘bar tab’ to be allocated to drink purchases or kept by the participant. Drinks available were the participants' typical alcoholic beverages, and the maximum number of drinks available was 8 ‘mini-drinks,’ each approximately half the size of standard drinks (e.g., Drobes et al. 2003). For the hypothetical version, participants were told that they would not receive any alcohol or money from their choices, but were instructed to make decisions as if the alcohol and money were real (Amlung et al. 2012). For the incentivized version, participants were told that one of their choices would be randomly selected and provided during a self-administration period. Weekly alcohol consumption was assessed using a 28-day Timeline Follow-Back interview (Sobell and Sobell 1992). Demographic information (e.g., age, race, income, etc.) was assessed using a self-report demographics form.
2.3. Procedure
These data were drawn from a larger neuroimaging study comprised of two testing sessions, a 1-h in-person screening and an 8-h testing session that included a MRI scan and alcohol self-administration/recovery periods (see MacKillop et al., 2014). All participants provided informed consent prior to enrolling in the study. During the in-person screening, participants were given a complete overview of the study, including an overview of the hypothetical vs. incentivized APT assessments (e.g., $15 bar tab, mini-drink size, and procedure for random choice of incentivized outcome) and an introduction to the bar lab environment.
During the second session, participants were reminded that they would be completing both hypothetical and incentivized APTs during the session prior to completing either assessment. Next, participants were administered the hypothetical APT on a laptop computer in a neutral lab room (e.g., 1 set of all 22 hypothetical price intervals). Participants then underwent a 1-h fMRI scan during which they completed 5 runs of the incentivized reward APT. Each run of the incentivized APT assessed all 22 price intervals yielding 5 consumption values at each price. These values were aggregated into a single mean consumption value per price. Following the scan, participants randomly selected one poker chip from a bowl with chips corresponding to the items on the actual reward APT (Kirby, Petry, and Bickel 1999; Amlung et al. 2012). They were then given the alcohol and/or money associated with their choice for that item during a 60-min self-administration period in a simulated bar laboratory. This was followed by a recovery period, debriefing, and dismissal. All procedures were approved by the University of Georgia Institutional Review Board.
2.4. Data Analysis
All variables were initially screened for missing data, outliers (Zs > 3.3), and distribution abnormalities (Tabachnick and Fidell 2001). Prior to generating aggregate mean consumption values for the incentivized APT, we examined consistency of participants' responses across the five runs. First, intraclass correlations (ICCs) were calculated among the five consumption values at each price. Second, we generated the proportion of positive reversals in consumption from a lower price to an adjacent higher price within each run (e.g., Amlung & MacKillop, 2012). This value was subtracted from 1.0 to provide a measure of within-run response consistency. Within-run consistency was also calculated for the single hypothetical APT run. For both of the APT versions, we generated four observed demand indices (Murphy and MacKillop 2006): intensity (i.e., consumption at minimum price), breakpoint (i.e., the first price that consumption was suppressed to zero), Omax (i.e., maximum alcohol expenditure) and Pmax (i.e., the price associated with Omax). Elasticity of demand was derived using the following exponential equation provided by Hursh & Silbererg (2008):
| (1) |
where Q = quantity consumed, Q0 = derived intensity, k = the range of the dependent variable (standard drinks) in logarithmic units, P = price, and α = elasticity of demand. GraphPad Prism 6 was used to fit the data to Equation 1 using the program available through the Institute for Behavioral Resources website (ibrinc.org). The overall mean performance was first analyzed to find the best-fitting k parameter, which was determined to be 4.0 and was used across all individual demand curve fits. Finally, we utilized the macro provided by Kaplan & Reed (2014) to calculate E.V. according to the following equation from Hursh (2014):
| (2) |
where α and k correspond to the values in Equation 1.
Correspondence between hypothetical and incentivized alcohol consumption at each price was assessed via both Pearson correlations (r) and ICCs. Intra-class correlations were utilized because they account for absolute agreement between observations. We also compared price-level consumption on the two APT versions using a 2 (Version: hypothetical, incentivized) × 22 (Price: $0-15) within-subjects analysis of variance (ANOVA). At the level of demand indices, we compared each of the six demand indices using paired-samples t-tests, Pearson correlations, and ICCs. Finally, for participants who received alcohol, we compared self-reported consumption on the APT and the number of drinks consumed using Pearson correlations.
3. Results
Preliminary Analyses
Breakpoint could not be calculated for one participant who did not reach zero consumption on the hypothetical APT. This participant was subsequently excluded from the breakpoint analyses. Equation 1 provided a very good fit to the individual participant data (median R2 = .94, interquartile range = .89-.97). Elasticity on both APT versions was positively skewed and was normalized using logarithmic transformations, resulting in non-significant skewness and kurtosis. Responses on the five incentivized APTs were highly consistent, both within each run (mean response consistency = 98%, range = 86-100%) and across runs (median ICC = .84, range = .70-.95, ps < .001). Within-run consistency on the hypothetical APT was also high (mean response consistency = 95%, range = 86-100%).
Correspondence between Hypothetical and Incentivized APT Performance
Demand for alcohol on both the hypothetical and incentivized APT versions was prototypical (see Figure 1A). Associations between estimated consumption on the two APTs are presented in Table 1. Self-reported consumption at each price was highly similar across both versions, with statistically significant, high-magnitude associations across all prices (Pearson correlations: rs .65 – 1.0, ps < .001; ICCs .62 – .90, ps < .01). For the 2 (Version) × 22 (Price) ANOVA, the main effect of version was non-significant, F(1,12) = 1.11, p = .31; the main effect of price was significant, F(21,252) = 73.27, p < .001; and the Version × Price interaction was non-significant, F(21,252) = 1.01, p = .45. Thus, consumption significantly decreased with escalating prices, but this decrease did not significantly differ between the two APT versions. Comparisons between the demand indices revealed significantly higher Pmax price on the hypothetical APT (hypothetical M = $2.88, SE = 0.43; incentivized M = $2.20, SE = 0.31; t(18) = 2.56, p = .02) and trend for greater intensity on the incentivized APT (hypothetical M = 6.37, SE = 0.47; incentivized M = 6.93, SE = 0.35; t(18) = 1.90, p = .07. Breakpoint, Omax, E.V., and elasticity did not differ between versions (ts < 1.61, ps > .13). Statistically significant, high magnitude associations were found for all indices (Pearson's rs .78 – .90, ps < .001; ICCs .69 – .89, ps < .001; Table 1).
Figure 1. Alcohol Consumption on Purchase Task Assessment and during Self-Administration.
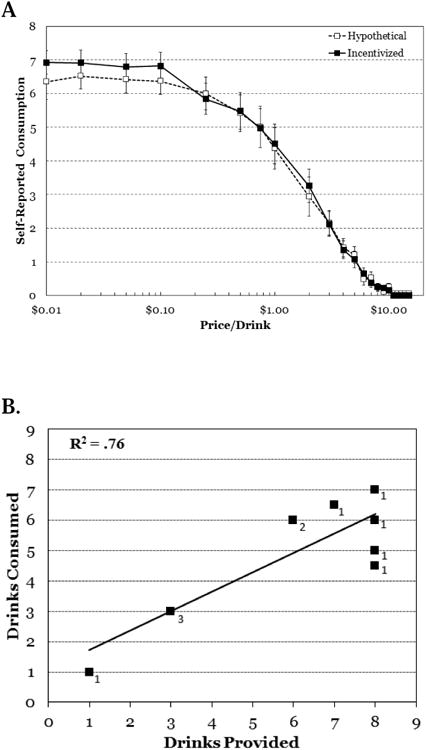
Panel A depicts the demand curves for hypothetical (unfilled markers) and incentivzed (filled markers) APT versions. Data points represent mean (± 1 SE). Panel B depicts the relationship between estimated alcohol consumption (drinks provided) and actual consumption (drinks consumed) during the self-administration period. Subscripts reflect the number of participants indicated by each data point.
Table 1. Alcohol purchase task performance for hypothetical and incentivized versions.
| Demand Index/Price | r | ICC |
|---|---|---|
| Intensity | .78*** | .72*** |
| Breakpoint | .90*** | .89*** |
| Omax | .85*** | .85*** |
| Pmax | .78*** | .69*** |
| Elasticity (α) | .88*** | .88*** |
| E.V. | .88*** | .87*** |
|
| ||
| $0.00 | .78*** | .72*** |
| $0.02 | .80*** | .79*** |
| $0.05 | .83*** | .82*** |
| $0.10 | .84*** | .82*** |
| $0.25 | .83*** | .84*** |
| $0.50 | .90*** | .90*** |
| $0.75 | .84*** | .84*** |
| $1.00 | .79*** | .80*** |
| $2.00 | .73*** | .73*** |
| $3.00 | .83*** | .84*** |
| $4.00 | .87*** | .88*** |
| $5.00 | .84*** | .84*** |
| $6.00 | .65*** | .64** |
| $7.00 | .88*** | .83*** |
| $8.00 | .67*** | .69** |
| $9.00 | .66*** | .62** |
| $10.00 | .73*** | .70*** |
| $11.00 | 1.00*** | — |
| $12.00 | 1.00*** | — |
| $13.00 | 1.00*** | — |
| $14.00 | 1.00*** | — |
| $15.00 | 1.00*** | — |
Note. E.V. = Essential value. ICC = Intraclass correlation coefficient. ICC values could not be generated for $11.00 and above because consumption values were identical across versions.
p < .01;
p < .001
Correspondence between Estimated and Actual Consumption
Eleven participants (58%) received alcohol during the self-administration period. Participants received an average of 5.55 mini-drinks (SD = 1.81) and consumed 89% of the alcohol provided. The correlation between the number of drinks provided and the amount consumed was of high magnitude (r = .87, p < .001; Figure 1B).
4. Discussion
Prior studies utilizing behavioral economic purchase tasks have typically used hypothetical outcomes, making the extent to which these hypothetical measures reflect preferences when actual rewards are at stake an important empirical question. The present study compared demand decision-making across hypothetical and actual-reward APTs. Our results were largely consistent with our previous study (Amlung et al. 2012), with a few exceptions. We found that consumption at individual prices was once again highly correlated across APT versions. This congruence was also observed for several of the demand indices, though participants exhibited significantly lower Pmax and a trend for higher intensity on the incentivized version. Differences in Pmax may indicate that participants were more liberal in their estimated alcohol consumption when no money was at stake, although this is contrasted by the elevated intensity on the incentivized version. The latter may be attributed to an increase in salience of the alcohol rewards on the incentivized APTs due to the impending opportunity to drink in the bar laboratory after the MRI scan. On balance, it is important to note that the absolute magnitude of these differences was modest, with only a $0.68 difference in Pmax and 0.5 more drinks for intensity. This suggests that the practical importance of these differences is likely minimal.
It is also notable that the magnitude of the association between estimated consumption on the APT and actual drinking in the lab was nearly identical to our prior study (r = .87 in both cases) (Amlung et al. 2012). These results converge with the study by MacKillop et al. (2012) that reported high magnitude correlations between self-reported cigarette consumption on a purchase task and how many cigarettes participants smoked during a self-administration period (rs .79-.82). These consistent findings across addictive substances increase confidence that estimated consumption values obtained on purchase tasks are valid indicators of how much participants would actually consume if given the opportunity to do so.
From a translational standpoint, the present findings further support the use of hypothetical purchase tasks in clinical and laboratory research on etiology and treatment of substance use disorders. Demand is theorized to reflect an underlying reinforcement pathology that characterizes addictive behaviors (Bickel et al. 2014). Accordingly, demand measures are being increasingly used to examine etiological factors that contribute to addiction as well as prognostic indicators of treatment success (e.g., MacKillop, Miranda, et al. 2010; MacKillop and Murphy 2007). In addition, purchase tasks have also shown promise as measures of drug motivation in laboratory studies (Acker and MacKillop 2013; Amlung et al. 2012; Amlung and MacKillop 2014; MacKillop, O'Hagen, et al. 2010) and pharmacotherapy studies (Bujarski, MacKillop, and Ray 2012). Finally, hypothetical purchase tasks are particularly useful in situations in which it is unethical to provide actual drug rewards on incentivized versions (e.g., individuals in treatment, underage individuals). The present findings suggest that hypothetical purchase tasks can be used as accurate measures of consumption patterns in these diverse research applications.
The present results should be considered in the context of the study's limitations. First, the order of the hypothetical and actual APT assessments was not counterbalanced, so potential order effects could not be examined. However, concerns about order effects are somewhat mitigated by the procedures used to introduce participants to both task versions. Specifically, prior to completing any APT assessments, participants received a thorough overview of the task parameters of the hypothetical vs. incentivized versions and were also told that they would complete both versions during the session. Nonetheless, we cannot rule out the possibility that consistency of demand preferences increased with repeated exposure to the price intervals, which may have artificially increased intra-subject consistency on the incentivized versions that were administered later. Future studies with counterbalanced designs are needed to fully evaluate potential order effects. Second, the present sample size was relatively modest and our participants were all male and were predominately young heavy drinkers. A larger sample size may have yielded additional statistically-significant differences across versions, particularly for intensity. However, given that the absolute magnitude of the difference in intensity was small, the practical implications of a statistically-significant difference are likely to be trivial. Future research is needed to further examine potential temporal effects on hypothetical vs. actual demand and to also examine correspondence in larger samples with more variable levels of alcohol use and misuse.
5. Conclusions
In summary, this study provides further empirical evidence for generally high correspondence between behavioral economic demand for hypothetical and actual outcomes. Future studies should extend these findings to other addictive commodities, such as comparing preferences for hypothetical and actual cigarettes (Jacobs and Bickel 1999; MacKillop et al. 2008) or illicit drugs (Collins et al. 2014). More broadly, this study offers additional support for utilizing purchase tasks as efficient and valid assessments of behavioral economic demand.
Highlights.
Behavioral economic demand reflects relationship between cost and consumption
Congruence between demand for hypothetical and actual alcohol is unclear
We examined alcohol demand decision-making for actual and hypothetical rewards
We found close correspondence between hypothetical and actual versions
Estimated consumption on purchase tasks was highly correlated with actual drinking
Acknowledgments
We gratefully acknowledge Lawrence Sweet, Ph.D., Courtney Brown, Ph.D., and John Acker, M.S. for their contributions to this study. This research was partially supported by grants from the National Institutes of Health (K23 AA016936; P30 DA027827; T32 AA013526), a University of Georgia Research Foundation Faculty grant; and paradigm development hours from the UGA BioImaging Research Center. Dr. MacKillop holds the Peter Boris Chair in Addictions Research, which partially supported his role. The funding sources had no other role in this research other than financial support.
Footnotes
Publisher's Disclaimer: This is a PDF file of an unedited manuscript that has been accepted for publication. As a service to our customers we are providing this early version of the manuscript. The manuscript will undergo copyediting, typesetting, and review of the resulting proof before it is published in its final citable form. Please note that during the production process errors may be discovered which could affect the content, and all legal disclaimers that apply to the journal pertain.
Contributor Information
Michael Amlung, Email: amlungm@missouri.edu.
James MacKillop, Email: jmackill@mcmaster.ca.
References
- Acker J, MacKillop J. Behavioral economic analysis of cue-elicited craving for tobacco: a virtual reality study. Nicotine Tob Res. 2013;15:1409–16. doi: 10.1093/ntr/nts341. [DOI] [PMC free article] [PubMed] [Google Scholar]
- Amlung M, Acker J, Stojek M, Murphy JG, MacKillop J. Is talk ‘cheap’? An initial investigation of the equivalence of alcohol purchase task performance for hypothetical and actual rewards. Alcoholism: Clinical and Experimental Research. 2012;36:716–724. doi: 10.1111/j.1530-0277.2011.01656.x. [DOI] [PMC free article] [PubMed] [Google Scholar]
- Amlung M, MacKillop J. Understanding the effects of stress and alcohol cues on motivation for alcohol via behavioral economics. Alcohol Clin Exp Res. 2014;38:1780–9. doi: 10.1111/acer.12423. [DOI] [PMC free article] [PubMed] [Google Scholar]
- Bickel WK, Johnson MW, Koffarnus MN, MacKillop J, Murphy JG. The behavioral economics of substance use disorders: reinforcement pathologies and their repair. Annu Rev Clin Psychol. 2014;10:641–77. doi: 10.1146/annurev-clinpsy-032813-153724. [DOI] [PMC free article] [PubMed] [Google Scholar]
- Bickel WK, Pitcock JA, Yi R, Angtuaco EJ. Congruence of BOLD response across intertemporal choice conditions: fictive and real money gains and losses. J Neurosci. 2009;29:8839–46. doi: 10.1523/JNEUROSCI.5319-08.2009. [DOI] [PMC free article] [PubMed] [Google Scholar]
- Bujarski S, MacKillop J, Ray LA. Understanding naltrexone mechanism of action and pharmacogenetics in Asian Americans via behavioral economics: a preliminary study. Exp Clin Psychopharmacol. 2012;20:181–90. doi: 10.1037/a0027379. [DOI] [PMC free article] [PubMed] [Google Scholar]
- Collins RL, Vincent PC, Yu J, Liu L, Epstein LH. A behavioral economic approach to assessing demand for marijuana. Exp Clin Psychopharmacol. 2014;22:211–21. doi: 10.1037/a0035318. [DOI] [PMC free article] [PubMed] [Google Scholar]
- Drobes DJ, Anton RF, Thomas SE, Voronin K. A clinical laboratory paradigm for evaluating medication effects on alcohol consumption: naltrexone and nalmefene. Neuropsychopharmacology. 2003;28:755–64. doi: 10.1038/sj.npp.1300101. [DOI] [PubMed] [Google Scholar]
- Hursh SR. Behavioral economics and analysis of consumption and choice. In: McSweeney FK, Murphy ES, editors. The Wiley Blackwell Handbook of Classical and Operant Condition. John Wiley & Sons; West Sussex, UK: 2014. [Google Scholar]
- Hursh SR, Silberberg A. Economic demand and essential value. Psychological Review. 2008;115:186–98. doi: 10.1037/0033-295X.115.1.186. [DOI] [PubMed] [Google Scholar]
- Jacobs EA, Bickel WK. Modeling drug consumption in the clinic using simulation procedures: demand for heroin and cigarettes in opioid-dependent outpatients. Experimental and Clinical Psychopharmacology. 1999;7:412–26. doi: 10.1037//1064-1297.7.4.412. [DOI] [PubMed] [Google Scholar]
- Johnson MW, Bickel WK. Within-subject comparison of real and hypothetical money rewards in delay discounting. J Exp Anal Behav. 2002;77:129–46. doi: 10.1901/jeab.2002.77-129. [DOI] [PMC free article] [PubMed] [Google Scholar]
- Kaplan BA, Reed DD. Essential Value, Pmax, and Omax Automated Calculator. 2014 spreadsheet application. Retrived from: http://hdl.handle.net/1808/14934.
- Kirby KN, Petry NM, Bickel WK. Heroin addicts have higher discount rates for delayed rewards than non-drug-using controls. J Exp Psychol Gen. 1999;128:78–87. doi: 10.1037//0096-3445.128.1.78. [DOI] [PubMed] [Google Scholar]
- MacKillop J, Amlung MT, Acker J, Gray JC, Brown CL, Murphy JG, Ray LA, Sweet LH. The neuroeconomics of alcohol demand: an initial investigation of the neural correlates of alcohol cost-benefit decision making in heavy drinking men. Neuropsychopharmacology. 2014;39:1988–95. doi: 10.1038/npp.2014.47. [DOI] [PMC free article] [PubMed] [Google Scholar]
- MacKillop J, Brown CL, Stojek MK, Murphy CM, Sweet L, Niaura RS. Behavioral economic analysis of withdrawal- and cue-elicited craving for tobacco: an initial investigation. Nicotine Tob Res. 2012;14:1426–34. doi: 10.1093/ntr/nts006. [DOI] [PMC free article] [PubMed] [Google Scholar]
- MacKillop J, Miranda R, Jr, Monti PM, Ray LA, Murphy JG, Rohsenow DJ, McGeary JE, Swift RM, Tidey JW, Gwaltney CJ. Alcohol demand, delayed reward discounting, and craving in relation to drinking and alcohol use disorders. Journal of Abnormal Psychology. 2010;119:106–14. doi: 10.1037/a0017513. [DOI] [PMC free article] [PubMed] [Google Scholar]
- MacKillop J, Murphy JG. A behavioral economic measure of demand for alcohol predicts brief intervention outcomes. Drug & Alcohol Dependence. 2007;89:227–33. doi: 10.1016/j.drugalcdep.2007.01.002. [DOI] [PubMed] [Google Scholar]
- MacKillop J, Murphy JG, Ray LA, Eisenberg DT, Lisman SA, Lum JK, Wilson DS. Further validation of a cigarette purchase task for assessing the relative reinforcing efficacy of nicotine in college smokers. Exp Clin Psychopharmacol. 2008;16:57–65. doi: 10.1037/1064-1297.16.1.57. [DOI] [PubMed] [Google Scholar]
- MacKillop J, O'Hagen S, Lisman SA, Murphy JG, Ray LA, Tidey JW, McGeary JE, Monti PM. Behavioral economic analysis of cue-elicited craving for alcohol. Addiction. 2010;105:1599–607. doi: 10.1111/j.1360-0443.2010.03004.x. [DOI] [PMC free article] [PubMed] [Google Scholar]
- Madden GJ, Begotka AM, Raiff BR, Kastern LL. Delay discounting of real and hypothetical rewards. Exp Clin Psychopharmacol. 2003;11:139–45. doi: 10.1037/1064-1297.11.2.139. [DOI] [PubMed] [Google Scholar]
- Murphy JG, MacKillop J. Relative reinforcing efficacy of alcohol among college student drinkers. Experimental & Clinical Psychopharmacology. 2006;14:219–27. doi: 10.1037/1064-1297.14.2.219. [DOI] [PubMed] [Google Scholar]
- Sobell LC, Sobell MB. Timeline follow-back: A technique for assessing self-reported alcohol consumption. In: Litten RZ, Allen JP, editors. Measuring alcohol consumption: Psychosocial and biochemical methods. Humana Press; Totowa, NJ: 1992. [Google Scholar]
- Tabachnick BG, Fidell LS. Using Multivariate Statistics. Allyn & Bacon; Needham Heights, MA: 2001. [Google Scholar]