Abstract
Purpose
Truncation artifact (Gibbs ringing) causes central signal drop within vessels in pulmonary MRA that can be mistaken for emboli, reducing the diagnostic accuracy for pulmonary embolism (PE). We propose a quantitative approach to differentiate truncation artifact from PE.
Methods
Twenty-eight patients who underwent pulmonary CTA for suspected PE were recruited for pulmonary MRA. Signal intensity drops within pulmonary arteries that persisted on both arterial-phase and delayed-phase MRA were identified. The percent signal loss between the vessel lumen and central drop was measured. CTA served as the reference standard for presence of pulmonary emboli.
Results
A total of 65 signal intensity drops were identified on MRA. 48 (74%) of these were artifact and 17 (26%) were PE, as confirmed by CTA. Truncation artifacts had a significantly lower median signal drop than PE at both arterial-phase (26% [range 12–58%] vs. 85% [range 53–91%]) and at delayed-phase MRA (26% [range 11–55%] vs. 77% [range 47–89%]), p<0.0001 for both. ROC analyses revealed a threshold value of 51% (arterial-phase) and 47%-signal drop (delayed-phase) to differentiate between truncation artifact and PE with 100% sensitivity and >90% specificity.
Conclusion
Quantitative signal drop is an objective tool to help differentiate truncation artifact and pulmonary embolism in pulmonary MRA.
Keywords: Diagnostic Imaging, Thrombosis, Pulmonary Embolism, Magnetic Resonance Angiography, Artifacts
Introduction
With recent hardware and software improvements, pulmonary MRA is emerging as an attractive alternative for detection of pulmonary embolism [1–5]. MRA can detect pulmonary embolism without radiation exposure or when CTA is contraindicated [6] In the Prospective Investigation of Pulmonary Embolism Diagnosis (PIOPED) II study, up to 24% of patients had a contraindication for CTA [7]. Despite the technical advances, the diagnostic quality of MRA images may be limited by different kinds of artifacts caused by patient motion, vascular flow, geometric distortions of the magnetic field, signal inhomogeneity, aliasing, metallic implants, chemical shift, and signal truncation [8–10]. In particular, signal truncation artifact, or “Gibbs ringing”, is observed as a distinct central signal intensity drop within the pulmonary vasculature in contrast enhanced pulmonary MRA. If not recognized, this artifact may be mistaken as pulmonary embolism [2, 11, 12]. This is a particular concern for inexperienced MRA readers who are accustomed to reading pulmonary CTA images for detection of pulmonary embolism, where they are not confronted with this type of misleading artifact.
The truncation artifact is a ripple-like feature that appears near abrupt transitions between regions of high and low signal intensity. The truncation is caused by approximation errors in Fourier transform analysis, which is better used for estimating gradual transitions in tissue signal intensity. This approximation error is a fundamental property of practical Fourier imaging, because the underlying spectrum (k-space data) requires infinite sampling to accurately represent the object [13, 14]. “Truncation” of higher spatial frequencies produces erroneous oscillations in the signal intensity of pixels near high-contrast edges on the final image [1, 15–18] (e.g., vessel lumen in contrast enhanced MRA). These may manifest as misleading single, central signal intensity dropouts in vessels 3–5 pixels in diameter such as lobar or segmental pulmonary arteries [2, 11].
While pulmonary MRA demonstrates high accuracy for proximal pulmonary embolism, is shows only limited accuracy for distal pulmonary embolism and 30% of inconclusive results [10]. In the PIOPED III study causes of technically inadequate MRA were poor arterial opacification (67%), motion (36%), wraparound (4%), and parallel imaging artifact (2%) [9]. A recent study comparing MRA with CTA yielded good sensitivities for both readers (100% and 86%, respectively) but low specificities (55% and 82%, respectively). The authors attributed the high false positive rate (causing the low specificity) to truncation artifact [12]. In our clinical experience (>600 pulmonary MRA for diagnosis of pulmonary embolism over 6 years) we have observed that truncation artifact may be mistaken for emboli – or alternatively true emboli may be dismissed as artifacts – especially by inexperienced MRA readers (e.g. radiology residents or radiologists more familiar with CTA than with MRA). Therefore, the aim of our study was to establish an objective method that can help differentiate truncation artifact and true pulmonary emboli to improve the diagnostic performance of pulmonary MRA for diagnosis of pulmonary embolism.
Material and Methods
Study Population
This was a prospective single institution HIPAA compliant and Institutional Review Board approved study. We recruited 28 patients (15 female, 13 male; median age 52 years; range 21–91 years) with suspected pulmonary embolism who underwent clinical CTA to undergo a pulmonary MRA scan within 2 days following their CTA. Subjects were recruited between July 2010 and March 2013. Written informed consent was obtained from all patients. CTA and MRA were successfully performed in all 28 patients and all 56 data sets were included in the analysis. CTA demonstrated pulmonary embolism in 19 (68%) of the 28 patients. The mean delay between CTA and MRA was 28 ± 16 hours.
CTA Protocol
CT scans were performed using a 64-slice MDCT (VCT, GE Healthcare, Waukesha, WI, USA) with a standard pulmonary CT angiography protocol: gantry rotation time 400 ms, collimation 64 × 1.25mm, 0.686 pitch, tube voltage 120 kV. Effective tube current was automated, ranging from 100 to 400 mAs. 100 ml of nonionic iodinated contrast material with an iodine concentration of 300 mg/ml (Iohexol, GE Healthcare, London, UK) was injected at a rate of 4 ml/s via an 18-gauge antecubital peripheral intravenous catheter, followed by a 50ml flush injected at the same rate. Fluoro-triggering at the level of the main pulmonary artery was used for determination of the contrast media bolus arrival time. The threshold level for triggering the scan was achieved when the attenuation of the main pulmonary artery reached 100 Hounsfield units.
MRA Protocol
All MRA studies were performed on a 1.5 Tesla whole-body MR system (Signa HDxt, GE Healthcare, Waukesha, WI) with an eight-channel phased-array cardiac coil. Following acquisition of scout images, the MRA imaging protocol included: precontrast, pulmonary arterial-phase, and immediate delayed-phase contrast enhanced MRA using the same 3D T1-weighted spoiled gradient recalled echo MR angiography sequence[4].
Each scan was performed during a single end-expiration breathhold using the following parameters: Repetition time/echo time (TR/TE) 2.9/1.0 ms (partial readout), average field of view 34 × 27 × 28–32 (SI × RL × AP), 256 × 192 × 140–160 matrix, sagittal slab excitation, flip angle 28°, BW = ± 83 kHz, 1 signal average, elliptic centric k-space sampling, with k-space corner cutting in the ky-kz plane. True spatial resolution was 1.3 × 1.8 × 2.0 mm3, interpolated to 0.7 × 0.7 × 1.0 mm3 (512 × 512 matrix) by zero-filling. Parallel imaging was performed using a data-driven 2D parallel imaging method, (ARC, GE Healthcare) with an effective acceleration factor of approximately 3.6, slightly varying depending on the AP matrix size. The MRA acquisition combined a sagittal excitation slab combined with a coronal reconstruction to avoid phase wrap from the arms and shoulders [7, 19]. Scan time varied depending on patient size and the field of view in the AP dimension (15–21 seconds).
Contrast enhanced scans were acquired after injection of 0.1 mmol/kg of gadobenate dimeglumine (MultiHance™, Bracco Diagnostics, Princeton, NJ) diluted with saline to a total volume of 30 mL, injected at a rate of 1.5 mL/s. Pulmonary arterial phase images were timed using fluoro-triggering, with exam initiation at the peak enhancement of the pulmonary artery. Using this approach, the scan begins (i.e., center of k-space is acquired) when the pulmonary arteries are fully opacified (typically 5–10s following the start of injection) and the contrast bolus persists throughout the acquisition. The use of diluted contrast material injected over the entire acquisition time was found to be helpful in previous studies to avoid artifacts related to dynamic changes of the contrast during the acquisition [1, 9, 20]. All breath-hold scans were acquired at end-expiration. Scanning in end-expiration reduces the chance of Valsalva causing transient interruption of the bolus [21], reduces the volume of coverage (shorter breath-hold), and shows increased perfusion [22]. After the first acquisition (arterial-phase) was finished and after the patient caught his or her breath, a second acquisition was performed (delayed-phase).
Image Analysis
MRA data sets were evaluated subjectively for the presence of central (i.e. without contact to the vessel wall) signal intensity drops within lobar and segmental pulmonary arteries that persisted on both arterial-phase and delayed-phase MRA images. Two radiologists performed (with 6 and 12 years of experience, respectively) a consensus reading in a randomized fashion, blinded to the results of the CTA. The presence and anatomical location (lobar or segmental) of each signal intensity drop within the pulmonary arteries was recorded, regardless of its appearance or probability of being truncation artifact or pulmonary embolism. The lung parenchyma associated with the signal intensity drops within the vessel lumen was assessed for the presence of perfusion defects. Signal intensity drops in the pulmonary trunk and in the main pulmonary arteries that clearly corresponded to large pulmonary emboli were excluded from analyses, since these were not representing a diagnostic dilemma. We also excluded all other signal dropouts in the vessels that subjectively did not represent a diagnostic dilemma. For example, only slight signal inhomogeneity or signal intensity drops that extended outside the vessel lumen were excluded from the analysis.
For quantitative image analyses, the signal intensities of each area of central drop and of the surrounding vessel lumen were assessed on the arterial-phase and delayed-phase MRA images. A board-certified radiologist with fellowship training in cardiovascular MRI and 6 years of experience in diagnostic imaging measured the signal drop in the vessel lumen and the peak signal in the vessel lumen using multiplanar reformatted images. The signal intensity of the central drop (SIsignal drop) was obtained by taking the mean of 3 point measurements in the center of the signal drop on 3 parallel slices oriented orthogonal to the vessel, skipping a slice between each measurement to minimize the effects of through-plane interpolation. The peak signal intensity of the surrounding vessel (SIvessel) was measured on the same 3 slices by taking the mean of four single-point measurements taken around the central drop on each slice, totaling twelve measurements. The percent signal drop was calculated using (SIvessel − SIsignal drop)/SIvessel × 100.
The reference for differentiating truncation artifact and pulmonary embolism was CTA. After analysis of the MRA images was complete, the CTA images and MRA images were unblinded. Each central vessel signal drop was characterized as either truncation artifact or true pulmonary embolism. Classification as artifact or embolus was determined by consensus by the same radiologists who had previously identified the central vessel signal drops on MRA.
Statistical Analyses
The Mann-Whitney rank sum test for independent samples was used to test the significance of the difference between the percent-signal drop of truncation artifacts and pulmonary emboli on arterial-phase and delayed-phase MRA images, respectively. The Wilcoxon rank sum test for paired samples was used to test the significance of the difference between arterial-phase and delayed-phase MRA images for both truncation artifacts and pulmonary emboli. The efficacy of percent-signal drop as a test to differentiate truncation artifact from pulmonary embolism was evaluated using receiver operating characteristic (ROC) curve analysis for arterial-phase and delayed-phase MRA. ROC curves were used to calculate the sensitivity and specificity with 95% confidence intervals of obtained threshold values for correct identification of pulmonary embolism for both arterial-phase and delayed-phase MRA. Non-normally distributed continuous variables are reported as median and ranges. P-values < 0.05 were considered statistically significant. Statistical analysis was performed with commercially available software (MedCalc Statistical Software version 12.7.5, MedCalc Software, Ostend, Belgium).
Results
A total of 65 central signal intensity drops were identified on both arterial-phase and delayed-phase MRA in the 28 subjects. A median of 2 signal intensity drops (range 1 – 3) were detected per patient. 18 (28%) of the signal drops were located in lobar arteries and 47 (72%) in segmental arteries.
48/65 (74%) of the signal drops were truncation artifacts and 17/65 (26%) were true pulmonary emboli as confirmed on CTA. 34/48 (71%) of the truncation artifacts were located in segmental arteries and 14/48 (29%) were in lobar arteries. 14/17 (82%) of the pulmonary emboli were located in segmental arteries and 3 (18%) were in lobar arteries (Table 1). An associated perfusion defect in the lung parenchyma was only observed in 7/17 (41%) of the signal dropouts due to true pulmonary embolism. None of 48 signal drops due to truncation artifact revealed an associated perfusion defect.
Table 1.
Distribution of signal drops within the pulmonary vasculature.
| Truncation Artifact | Pulmonary Embolism | Total | |
|---|---|---|---|
| Segmental artery | 34 (71%) | 14 (82%) | 47 (72%) |
| Lobar artery | 14 (29%) | 3 (18%) | 18 (28%) |
| Total | 48 (74%) | 17 (26%) | 65 (100%) |
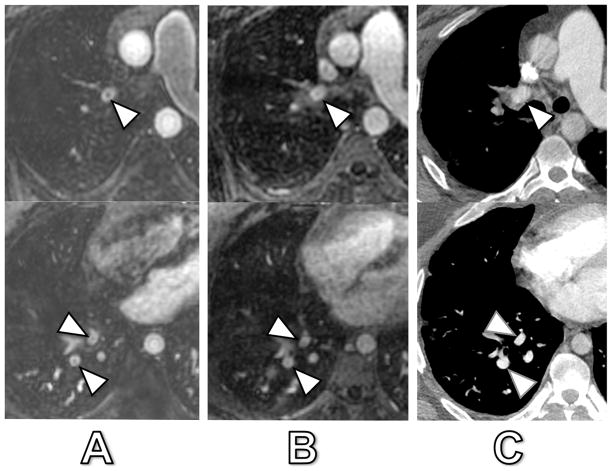
Fig. 1. shows an example of truncation artifact and pulmonary embolism located adjacent to each other in segmental arteries of the right lower lobe and demonstrating significantly different signal drops (24% and 23% for truncation artifact versus 78% and 79% for pulmonary embolism in arterial-phase MRA and delayed-phase MRA, respectively). The percent-signal intensity drop ranged from 12 – 91% during arterial-phase and from 11 – 89% at delayed-phase MRA. During arterial-phase MRA, truncation artifacts had a significantly lower median signal drop of 26% (range 12 – 58%) compared to pulmonary emboli with 85% (range 53 – 91%) (p < 0.0001). In delayed-phase MRA, truncation artifacts also revealed a significantly lower median signal drop of 26% (range 11 – 55%) as compared to pulmonary emboli with 77% (range 47 – 89%) (p < 0.0001) (Fig. 2). However, not all signal intensity drops of truncation artifact and pulmonary embolism showed such evident and marked differences, as illustrated in Fig. 3 and 4. Fig. 3 illustrates a case of truncation artifact with comparably large signal intensity drop in arterial-phase MRA (51%), but relatively small signal drop in delayed-phase MRA (23%). Fig. 4 illustrates a case of pulmonary embolism with comparatively small signal drop in arterial-phase MRA (57%) and in delayed-phase MRA (52%).
Fig. 1. 52-year old woman with both confirmed PE and truncation artifact.
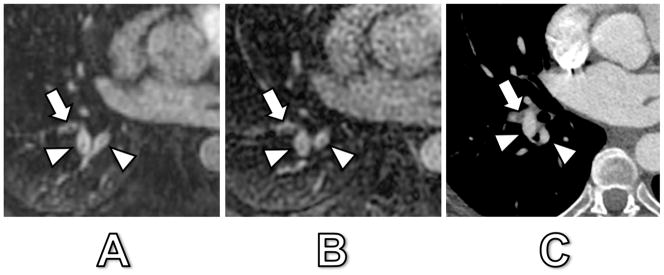
Arterial-phase MRA (A), delayed-phase MRA (B) and corresponding CT (C). The central signal dropout in the lateral basilar segmental pulmonary artery (arrow) corresponded to a true pulmonary embolus as confirmed by CT. Central signal dropout was 78% at arterial-phase and 79% at delayed-phase MRA. The adjacent posterior basilar segmental pulmonary artery (and adjacent pulmonary vein) show truncation artifact as confirmed by CT with a 24% and 23% signal dropout at arterial-phase and delayed-phase MRA, respectively (arrowheads).
Fig. 2. Boxplots of percent-signal drop of truncation artifact and true pulmonary embolism of arterial-phase and delayed-phase MRA.
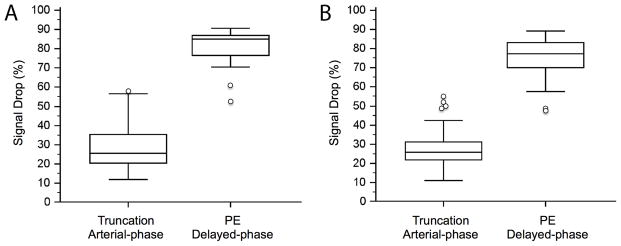
Truncation artifacts showed the same median signal drop of 26% on arterial-phase (range 12 – 58%) and on delayed-phase MRA (range 11 – 55%). True pulmonary embolism showed a significantly higher signal drop of 85% (range 53 – 91%) and 77% (range 47 – 89%), respectively (p<0.0001 for both). Note the small overlap between the percent-signal drop of truncation artifacts and true pulmonary emboli.
Fig. 3. 31-year old man with signal drops in lobar and segmental pulmonary arteries.
Arterial-phase MRA (A), delayed-phase MRA (B) and corresponding CT (C). The patient had no acute embolism by CT. The central signal dropout in the right upper lobe lobar artery (arrowhead) corresponded to artifact with a 51% and 23% signal drop at arterial-phase and delayed-phase MRA, respectively. The central signal dropout in the right lower lobe segmental arteries (arrowheads) corresponded also to artifact with a 41% and 18% signal drop at arterial-phase and delayed-phase MRA, respectively.
Fig. 4. 42-year old woman with confirmed PE.
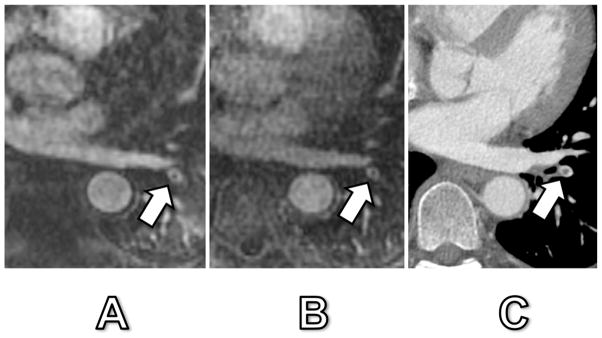
Arterial-phase MRA (A), delayed-phase MRA (B) and corresponding CT (C). The central signal drop in a left lower lobe segmental pulmonary artery (arrow) corresponded to a true pulmonary embolus as confirmed by CT. Signal dropout was 57% and 52% at arterial-phase and delayed-phase MRA, respectively. Of note, this embolus was the only one that was detected in this patient and could easily have been mistaken for a truncation artifact due to its central location within the vessel and relatively small signal intensity drop.
When comparing arterial-phase and delayed-phase MRA, there was no significant difference between percent-signal drop of truncation artifacts at arterial-phase MRA (26%) and delayed-phase MRA (26%) (p = 0.522). In contrast, the percent-signal drop of pulmonary emboli was significantly larger at arterial-phase MRA (85%) than at delayed-phase MRA (77%) (p < 0.008).
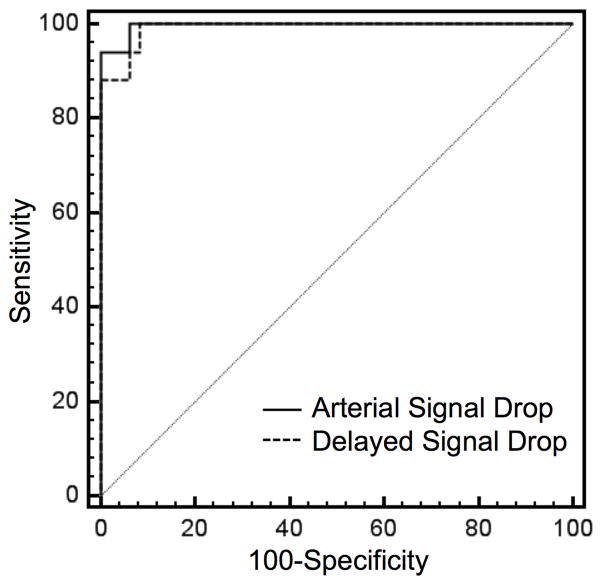
ROC curve analysis revealed a slightly higher area under the curve (AUC = 0.996, 95% CI = 0.938–1.000) at arterial-phase MRA as compared to delayed-phase MRA (AUC= 0.991, 95%-CI = 0.929–1.000); however, this difference was not statistically significant (p = 0.449) (Fig. 5). At arterial-phase MRA a threshold value of 51% signal drop revealed an ROC curve derived sensitivity of 100% (95%-CI = 80.5–100%) and specificity of 94% (95%-CI = 82.8–98.7%) for correctly differentiating truncation artifact from pulmonary embolism. At delayed-phase MRA a threshold value of 47% resulted in a sensitivity of 100% (95%-CI = 80.5–100%) and specificity of 92% (95%-CI = 80.0–97.7%) for correct differentiation of truncation artifact from pulmonary embolism (Fig. 6). The sensitivity and specificity for other relevant threshold values are given in Table 2.
Fig. 5. Comparison of receiver operating characteristic (ROC) analysis.
Graphs show a slightly larger area under the curve (AUC) for percent-signal drop at arterial-phase MRA (AUC = 0.996, 95%-CI = 0.938–1.000) as compared to delayed-phase MRA (AUC= 0.991, 95%-CI = 0.929–1.000); however, this difference was not statistically significant (p=0.449).
Fig. 6. Aligned dot plot analyses of %-signal drop and ROC derived threshold values.
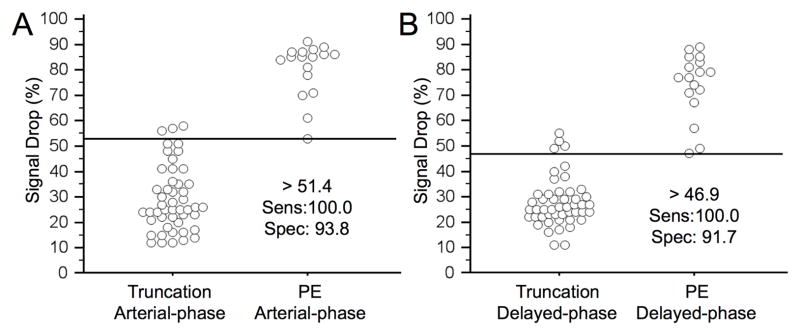
ROC analyses exhibited an ideal threshold of 51% and of 47%-signal drop at arterial-phase MRA and delayed-phase MRA, respectively, with 100% sensitivity and >90% specificity for differentiation of truncation artifact and pulmonary embolism.
Table 2.
Threshold values with associated ROC-curve derived sensitivity and specificity values ranging from 100% sensitivity to 100% specificity for differentiation of truncation artifact and pulmonary embolism.
| Arterial Phase | Delayed Phase | |||||
|---|---|---|---|---|---|---|
| Threshold | >51.4 | >52.9 | >58.1 | >46.9 | >48.8 | >55.1 |
| Sensitivity (95% CI) | 100.0 (80.5 – 100.0) | 94.1 (71.3 – 99.9) | 94.1 (71.3 – 99.9) | 100.0 (80.5 – 100.0) | 94.1 (71.3 – 99.9) | 88.2 (63.6 – 98.5) |
| Specificity (95% CI) | 93.8 (82.8 – 98.7) | 93.8 (82.8 – 98.7) | 100.0 (92.6 – 100.0) | 91.7 (80.0 – 97.7) | 93.8 (82.8 – 98.7) | 100.0 (92.6 – 100.0) |
Discussion
In this study we have demonstrated that differences in percentage of signal intensity dropout can be used as an objective and quantitative tool to differentiate truncation artifact from pulmonary embolism in pulmonary MRA. ROC curve analysis derived a threshold value of 51% signal intensity drop at first pass MRA and 47% at delayed-phase MRA for correct identification of pulmonary embolism with ~100% sensitivity and >90% specificity.
Our study shows that the observed percent-signal drop for truncation artifact is significantly lower (26%) than for true pulmonary embolism (85% at arterial-phase and 77% at delayed-phase). However, our results also revealed that in some cases the measured signal drop of truncation artifact may be larger and that the signal drop of pulmonary embolism may be smaller than expected. This variability in central signal drop creates a potential diagnostic dilemma if an embolus is located centrally in the pulmonary artery (Fig. 4). In some cases, the observed signal drop may have been exacerbated during the arterial phase due to suboptimal timing of the bolus relative to k-space sampling. If the contrast arrives in the pulmonary arteries during the middle of the scan, the center of k-space is acquired when little or no contrast is present in the pulmonary artery and the edges of k-space are acquired when contrast is present. This leads to transient edge enhancement of the vessel periphery and central signal drop as first described by Maki et al [1, 4, 5, 20]. This transient artifact could exacerbate the central signal drop on the arterial phase [20]. It is for this reason that the delayed phase should always be reviewed before a final diagnosis of pulmonary embolism is made.
The observation of pulmonary emboli with relatively less signal intensity dropout might be caused by several factors. First, anticoagulant therapy was initiated in patients with pulmonary embolism prior to the MRA, and could alter the appearance of emboli on contrast enhanced MRA compared to the appearance of a de novo MRA. Further, partial volume effects in smaller segmental vessels may reduce the measured signal intensity drop. We attempted to minimize these partial volume effects by using the mean of many single-point measurements instead of using a larger ROI. Finally, an inherent high T1 signal in a pulmonary embolus could reduce the apparent signal intensity drop.
We observed a significantly larger percent-signal drop for pulmonary emboli in arterial-phase MRA as compared to delayed-phase MRA (85% vs. 77%). This is likely due to the decreased signal intensity of the surrounding contrast-enhanced blood in the delayed-phase as compared to the arterial phase. Thus, the percentage of calculated signal intensity drop would be reduced, since the signal intensity of the emboli is unchanged. It is also possible that the smaller percent-signal drop for pulmonary emboli in the delayed-phase phase may be attributed to a slow contrast agent uptake of the pulmonary emboli. This could be related to partial lysis of the emboli during anticoagulation prior to the MRA, although this is speculative. Importantly, we observed no significant difference in the percent-signal drop of truncation artifacts between arterial-phase MRA and delayed-phase MRA (both 26%), which follows theoretical prediction that the signal intensity drop caused by truncation is a fixed percentage of the signal of the vessel lumen [11]. Hence, in borderline cases, the lack of change in the amount of signal drop between arterial-phase and delayed-phase MRA would strongly favor truncation artifact and may be used as another criteria to differentiate between pulmonary embolism and truncation artifact.
The low signal drop of truncation artifact and the comparatively higher signal drop of pulmonary emboli in the pulmonary vasculature has been observed and anecdotally reported earlier by several groups [2, 8–11]. These authors stated that truncation artifacts can be distinguished from true pulmonary emboli by relying on their central location and smaller signal drop [2, 11]. The quantitative and objective measurements of our study confirm these subjective reports and provide an objective approach to differentiate true emboli from artifact.
Differentiating truncation from pulmonary embolism is usually not a problem for experienced readers. This might be the reason why truncation artifact has not specifically been reported as a source of false positive results in large clinical trials [9] but only recently in a smaller study performed by Kramer et al [12]. However, for less experienced sites starting to offer pulmonary MRA as an alternative to CTA for detection of pulmonary embolism, this is an important pitfall to avoid. Based on the results of our study, we recommend that quantitative evaluation be performed when there is difficulty determining whether central signal drop in a vessel represents a truncation artifact or a true pulmonary embolism. This approach can be used as an objective tool that can help correctly differentiate pulmonary embolism from truncation artifact with high accuracy. Signal intensity measurements should be performed for all equivocal signal drops. However, instead of using our optimal and partial volume minimizing technique, we recommend drawing one small ROI in the center of the signal drop and one in the adjacent surrounding vessel lumen. For simplicity, we propose as a “clinical rule of thumb” the threshold value of 50% signal intensity drop in pulmonary MRA for differentiating true pulmonary embolism from artifact.
Another practical approach in clinical practice is to look for peripheral wedge-shaped parenchymal perfusion defects in the arterial phase that are a secondary sign of true pulmonary embolism [1, 2, 10]. However, the amount of parenchymal enhancement is quite variable. Therefore, the utility of perfusion defects as a secondary sign of true embolism is limited only to those acquisitions in which overall parenchymal enhancement is sufficient to be able to detect a defect.
A potential technical approach to reducing confusion of truncation artifact with true embolism would be to change the resolution of the scan. This would change the size of the vessels most affected by truncation artifact but would not affect signal dropouts due to true embolism. Unfortunately, increasing the resolution in order to shift the artifact to smaller vessels is not feasible due to the associated increased scan time (i.e., breath-hold) and decreased SNR [8]. Retrospectively decreasing the spatial resolution in order to shift the artifact to larger vessels is a possibility; however, this is likely to also decrease the conspicuity of true emboli due to partial volume averaging.
The greatest limitation of this study is the potential lack of generalizability of our results to different injection protocols, contrast agents, spatial resolutions, MRI sequences, reconstruction algorithms, or MR platforms. All of these factors may affect the presence and more importantly the degree of signal drop and thereby the derived optimal threshold values. It is, however, reassuring that we observed very little overlap in the distribution of percent-signal drop in truncation artifact and in true pulmonary embolism. This suggests that while the exact optimal threshold for differentiating truncation artifact from pulmonary embolism may vary depending on these various scan parameters; there will likely be a useful threshold that will perform well for any given set of parameters. Another limitation of our study is the delay time between CTA and MRA. It is certainly possible that during the time between studies, new clots may have embolized to the lungs while some may have lysed. Further, the signal intensity of pulmonary emboli may have changed due to anticoagulation treatment and thrombolysis within the clot substance, possibly affecting the binding of gadolinium based contrast.
In summary, we have demonstrated the feasibility of using an objective approach for differentiating truncation artifact from pulmonary embolism with high accuracy. Truncation artifact could be differentiated from pulmonary embolism with high sensitivity (100%) and specificity (>90%), when using a threshold of 51% signal drop at arterial-phase or 47% at delayed-phase MRA. By taking an objective approach for equivocal central signal drop; the diagnostic accuracy of pulmonary MRA for pulmonary embolism will be improved.
Key points.
Truncation artifacts may be mistaken for emboli on pulmonary MRA by inexperienced readers
Pulmonary emboli have non-uniform signal drop
51% (arterial-phase) and 47% (delayed-phase) cut-off differentiates truncation artifact from PE
Quantitative signal drop measurement enables more accurate pulmonary embolism diagnosis with MRA
Acknowledgments
The authors wish to thank Alejandro Munoz del Rio, PhD for his statistical advice at all stages of this project. The authors also wish to thank Bracco Diagnostic for their support through an unrestricted research grant.
References
- 1.Schiebler ML, Nagle SK, François CJ, et al. Effectiveness of MR angiography for the primary diagnosis of acute pulmonary embolism: Clinical outcomes at 3 months and 1 year. J Magn Reson Imaging. 2013;38:914–925. doi: 10.1002/jmri.24057. [DOI] [PMC free article] [PubMed] [Google Scholar]
- 2.François CJ, Hartung MP, Reeder SB, et al. MRI for acute chest pain: Current state of the Art. J Magn Reson Imaging. 2013;37:1290–1300. doi: 10.1002/jmri.24173. [DOI] [PubMed] [Google Scholar]
- 3.Kalb B, Sharma P, Tigges S, et al. MR imaging of pulmonary embolism: diagnostic accuracy of contrast-enhanced 3D MR pulmonary angiography, contrast-enhanced low-flip angle 3D GRE, and nonenhanced free-induction FISP sequences. Radiology. 2012;263:271–278. doi: 10.1148/radiol.12110224. [DOI] [PubMed] [Google Scholar]
- 4.Lum DP, Busse RF, François CJ, et al. Increased volume of coverage for abdominal contrast-enhanced MR angiography with two-dimensional autocalibrating parallel imaging: Initial experience at 3.0 Tesla. J Magn Reson Imaging. 2009;30:1093–1100. doi: 10.1002/jmri.21964. [DOI] [PubMed] [Google Scholar]
- 5.Londy FJ, Lowe S, Stein PD, et al. Comparison of 1.5 and 3.0 T for contrast-enhanced pulmonary magnetic resonance angiography. Clin Appl Thromb Hemost. 2012;18:134–139. doi: 10.1177/1076029611419840. [DOI] [PMC free article] [PubMed] [Google Scholar]
- 6.Meaney JF, Weg JG, Chenevert TL, et al. Diagnosis of pulmonary embolism with magnetic resonance angiography. N Engl J Med. 1997;336:1422–1427. doi: 10.1056/NEJM199705153362004. [DOI] [PubMed] [Google Scholar]
- 7.Stein PD, Fowler SE, Goodman LR, et al. Multidetector computed tomography for acute pulmonary embolism. N Engl J Med. 2006;354:2317–2327. doi: 10.1056/NEJMoa052367. [DOI] [PubMed] [Google Scholar]
- 8.Morelli JN, Runge VM, Ai F, et al. An image-based approach to understanding the physics of MR artifacts. Radiographics. 2011;31:849–866. doi: 10.1148/rg.313105115. [DOI] [PubMed] [Google Scholar]
- 9.Stein PD. Gadolinium-Enhanced Magnetic Resonance Angiography for Pulmonary Embolism: A Multicenter Prospective Study (PIOPED III) Ann Intern Med. 2010;152:434–443. doi: 10.7326/0003-4819-152-7-201004060-00008. [DOI] [PMC free article] [PubMed] [Google Scholar]
- 10.Revel MP, Sanchez O, Couchon S, et al. Diagnostic accuracy of magnetic resonance imaging for an acute pulmonary embolism: results of the “IRM-EP” study. J Thromb Haemost. 2012;10:743–750. doi: 10.1111/j.1538-7836.2012.04652.x. [DOI] [PubMed] [Google Scholar]
- 11.Nagle SK, Schiebler ML, François CJ, et al. Common Artifacts of Pulmonary Artery MRA and Potential Solutions. Proceedings of the ISMRM. 2010:1378. [Google Scholar]
- 12.Kramer H, Nagle SK, François CJ, et al. Efficacy of 3D whole-lung single breath-hold contrast enhanced pulmonary MRA for detection of pulmonary embolism: comparison to CTA. Proc Intl Soc Mag Reson Med. 2013:21. [Google Scholar]
- 13.Harris FJ. On the use of windows for harmonic analysis with the discrete Fourier transform. Proceedings of the IEEE. 1978;66:51–83. [Google Scholar]
- 14.Gottlieb D, Shu C-W. On the Gibbs Phenomenon and Its Resolution. SIAM Rev. 1997;39:644–668. doi: 10.1137/S0036144596301390. [DOI] [Google Scholar]
- 15.Di Bella EVR, Parker DL, Sinusas AJ. On the dark rim artifact in dynamic contrast-enhanced MRI myocardial perfusion studies. Magn Reson Med. 2005;54:1295–1299. doi: 10.1002/mrm.20666. [DOI] [PMC free article] [PubMed] [Google Scholar]
- 16.Sharif B, Dharmakumar R, LaBounty T, et al. Towards elimination of the dark-rim artifact in first-pass myocardial perfusion MRI: Removing gibbs ringing effects using optimized radial imaging. Magn Reson Med. 2013:n/a–n/a. doi: 10.1002/mrm.24913. [DOI] [PMC free article] [PubMed] [Google Scholar]
- 17.Rakow-Penner R, Gold G, Daniel B, et al. Reduction of truncation artifacts in rapid 3D articular cartilage imaging. J Magn Reson Imaging. 2008;27:860–865. doi: 10.1002/jmri.21312. [DOI] [PubMed] [Google Scholar]
- 18.Erickson SJ, Waldschmidt JG, Czervionke LF, Prost RW. Hyaline cartilage: truncation artifact as a cause of trilaminar appearance with fat-suppressed three-dimensional spoiled gradient-recalled sequences. Radiology. 1996;201:260–264. doi: 10.1148/radiology.201.1.8816555. [DOI] [PubMed] [Google Scholar]
- 19.Brau ACS, Beatty PJ, Skare S, Bammer R. Comparison of reconstruction accuracy and efficiency among autocalibrating data-driven parallel imaging methods. Magn Reson Med. 2008;59:382–395. doi: 10.1002/mrm.21481. [DOI] [PMC free article] [PubMed] [Google Scholar]
- 20.Maki JH, Prince MR, Londy FJ, Chenevert TL. The effects of time varying intravascular signal intensity and k-space acquisition order on three-dimensional MR angiography image quality. J Magn Reson Imaging. 1996;6:642–651. doi: 10.1002/jmri.1880060413. [DOI] [PubMed] [Google Scholar]
- 21.Wittram C, Yoo AJ. Transient interruption of contrast on CT pulmonary angiography: proof of mechanism. J Thorac Imaging. 2007;22:125–129. doi: 10.1097/01.rti.0000213566.78785.26. [DOI] [PubMed] [Google Scholar]
- 22.Fink C, Ley S, Risse F, et al. Effect of inspiratory and expiratory breathhold on pulmonary perfusion: assessment by pulmonary perfusion magnetic resonance imaging. Invest Radiol. 2005;40:72–79. doi: 10.1097/01.rli.0000149252.42679.78. [DOI] [PubMed] [Google Scholar]


