Abstract
Introduction
The Toll like receptor 4 (TLR4) ligand endotoxin triggers robust systemic inflammatory responses in humans at doses > 1.0 ng/kg. In this study we tested the hypothesis that evidence of TLR4-induced responses would be detectable in leukocytes challenged with endotoxin doses that are below the threshold needed to trigger a characteristic systemic inflammatory phenotype in humans.
Methods
Subjects were challenged with endotoxin at 1, 0.5, or 0.1 ng/kg (n=5 per dose). Systemic responses were monitored for 24 hour. Blood samples, collected at designated interval for up to 24 hours post-challenge, were used to determine plasma cytokines levels, total and differential leukocyte counts, expression of leukocyte cell surface receptors, and changes in the leukocyte transcriptome. Western blotting was used to determine changes in leukocyte protein expression.
Results
We found that in vivo endotoxin at concentrations <1.0 ng/kg triggers weak and variable responses in humans. In marked contrast, we show that endotoxin at a concentration as low as 0.1 ng/kg triggers a transient decline in cellular ATP levels in leukocytes. This is associated with the appearance of a unique protein expression signature in leukocytes. The protein expression signature includes three prominent features: i) AMP-activated protein kinase subunit α (AMPKα) degradation, ii) increased HIF-1α expression, and iii) autophagy, collectively indicative of a regulated metabolic response. An indistinguishable response phenotype was observed in human leukocytes treated with endotoxin in vitro.
Discussion
These data demonstrate for the first time in humans that a TLR4 ligand concentration that is below the threshold needed to trigger clinically evident systemic inflammatory manifestations initiates a transient decline in ATP levels, AMPKα degradation, HIF-1α expression, and autophagy in leukocytes. This establishes that low-grade TLR4 activation exerts control over leukocyte metabolism in the absence of systemic inflammatory indicators.
Keywords: endotoxin, TLR4, metabolism, HIF-1α, AMPK α
Introduction
Endotoxin, a lipopolysaccharide derived from the outer wall of Gram-negative bacteria, is a ligand of Toll like receptor 4 (TLR4). Endotoxemia is an experimental model that has played an instrumental role in advancing our understanding of acute systemic inflammatory responses in humans 1-3. In this model, healthy subjects are challenged with a bolus dose of standardized Escherichia coli endotoxin 4. In vivo endotoxin induced responses are dose-dependent 4. When administered to humans at a dose ≥ 1 ng/kg, endotoxin induces common acute systemic inflammatory responses that include changes in core body temperature, heart rate, and circulating cytokines level 1, 2, 4. At the cellular level, endotoxin triggers rapid changes in leukocyte cell-surface receptors 5, 6. Genome-wide gene-expression studies have identified numerous transcripts that are either induced or suppressed in leukocytes from human subjects challenged with endotoxin at 2- or 4-ng/kg 7, 8. Furthermore, although experimental endotoxemia is not a model of sepsis because active infection is not present, it was recently established that endotoxemia, critical illness, severe blunt trauma, and burn injury, all trigger similar transcripational changes in human leukocytes 9, 10. TLR4 acts as a receptor for not only endotoxin, but also multiple endogenous damage-associated molecular patterns (DAMPs) 11-13. This might explain, at least in part, why stressors derived from host and/or microorganisms trigger qualitatively similar inflammatory outcomes.
Over the past decade it has been noted that tissues from critically ill patients exhibit reduced cellular ATP levels and a decline in mitochondrial oxygen consumption and function 14-17. One group showed that endotoxin triggers a transient decline in expression of genes associated with mitochondrial function, which suggested that TLR4 signaling alters leukocyte metabolism 7. Indeed, we reported that in vivo endotoxin at a dose of 2 ng/kg triggers a decline in ATP levels and a parallel increase in autophagy in human leukocytes 18. Using an in vivo mouse model, we also found that the changes in ATP levels and autophagy were associated with perturbations in AMP-activated protein kinase α subunit (AMPKα) and hypoxia inducible factor-1 (HIF-1) α subunit expression in leukocytes as well as liver 18. AMPK, a α-β-γ trimmer, is a serine/threonine kinase that is activated when the cellular ATP levels are low 19. AMPK phosphorylates numerous substrates, including PGC-1, a regulator of mitochondrial biogenesis 20. HIF-1, a α-β dimer, is a transcription factor. HIF-1 is a positive regulator of glycolysis and a negative regulator of mitochondrial function 21-23. HIF-1 is also an inhibitor of mitochondrial biogenesis 24. AMPK and HIF-1 both regulate autophagy through independent mechanisms 25-27. Autophagy is associated with the formation of specialized membrane vesicles known as autophagosomes 28. These vesicles engulf organelles and cytoplasmic constituents, which are subsequently delivered to lysosomes for degradation 29. During periods of nutrient deficiency, cells utilize autophagy-mediated degradation to generate energy for survival 30.
In this report we show for the first time in humans that an in vivo endotoxin dose as low as 0.1 ng/kg triggers a common cellular metabolic phenotype in human leukocytes, which is associated with a rapid and transient decline in ATP levels, AMPKα degradation, an increase in HIF-1α expression, and autophagy, all in the absence of detectable systemic responses. Identical responses were also detected in whole blood leukocytes treated with endotoxin in vitro. These data establish that a TLR4-ligand concentration that is below the threshold needed to induce systemic responses effectively alters leukocyte metabolism.
This study is dedicated to Stephen F. Lowry¥, MD, (1947-2011), Professor and Chairman of the Department of Surgery at UMDNJ- RWJMS, who designed and oversaw the human endotoxemia aspects of the study. Dr. Lowry was an internationally renowned expert on inflammation, and has made seminal contributions to our understanding of the role of inflammatory mediators to septic shock and organ dysfunction in critically ill patients 31. He is greatly missed by all of us.
Materials and Methods
Human Subjects
The Institutional Review Board of Robert Wood Johnson Medical School approved the study. Written informed consent was obtained from all participates prior to inclusion in the study. Subjects were recruited using exclusion and inclusion criteria as described 9. Subjects were administered a standard dose of endotoxin (Clinical Center reference endotoxin (CC-RE), lot 2, National Institutes of Health 4, 32, at a dose of 1-, 0.5-, or 0.1-ng/kg. At designated times pre- and post-endotoxin infusion, blood was drawn into heparin-containing tubes (protein expression analyses), EDTA-containing tubes (cytokines and flow analyses) and PAXgene tubes (gene expression analyses).
Cytokines
IL-6 and TNF levels were determined using ELISA 32. For both assays, the range of sensitivity was 15-2000 pg/ml.
Statistical Analyses
Data were analyzed by one-way repeated-measured analysis of variance (ANOVA) relative to the control group to determine statistical significance (p≤0.05)
Cell surface receptors
These were analyzed in real time on site as previously described 5, 33. In brief, leukocytes, isolated and stained using antibodies to TNF receptor type II, were analyzed by 2-color flow cytometry 33. Monocytes were identified as CD14 high, side scattermedium cells and neutrophils as CD14low, side scatterhigh cells. The data are expressed as changes in arbitrary fluorescence units (AFU) relative to time 0.
Gene expression analyses
Whole blood was collected at the times indicated into Paxgene tubes (PreAnalytiX (Qiagen, Valencia, CA) and RNA was isolated according to the manufacture's instructions. RNA quality and quantity was evaluated using the 2100 Bioanalyzer™ (Agilent Technologies, Palo Alto, CA). RNA was amplified, and first cDNA strand was synthesized and then amplified using Ovation Pico WTA system (NuGEN, San Carlos, CA) according to the manufacture's instructions. The amplified cDNA was purified using Zymo research DNA clean and concentrator TM-25 (Zymo Research Corp. Irvine, CA) according to the manufacture's instructions. cDNA was labeled using Encore biotin module (NuGEN,). Labeled cDNA was hybridized onto Focus™ GeneChip Microarray (Affymetrix, Santa Clara, CA) as described 9. The microarray data were analyzed as described 9. We defined significantly expressed probes per subjects as those with a ≥2-fold change from time 0.
Leukocytes isolation and analyses
Leukocytes were isolated, lysed, and analyzed as described 18. The antibodies used in Western blotting included LC3 and actin antibodies from Sigma (St. Louis, MI), and AMPKα, HIF-1α, and Glut3 antibodies from Santa Cruz Biotech (Santa Cruz, CA). ATP levels were determined using the ATP Bioluminescence Assay Kit HSII (Roch) as described 18. Whole blood samples were incubated with endotoxin derived from Escherichia coli O111:B4 (Sigma; L3012) at 10 ng/ml for the indicated time. In other studies, whole blood samples were incubated with TLR 1-9 ligands (InVivoGen; San Diego, CA) for 2 hours. The leukocytes were then isolated and analyzed as described 18.
Results
In vivo endotoxin-induced systemic responses in healthy human subjects
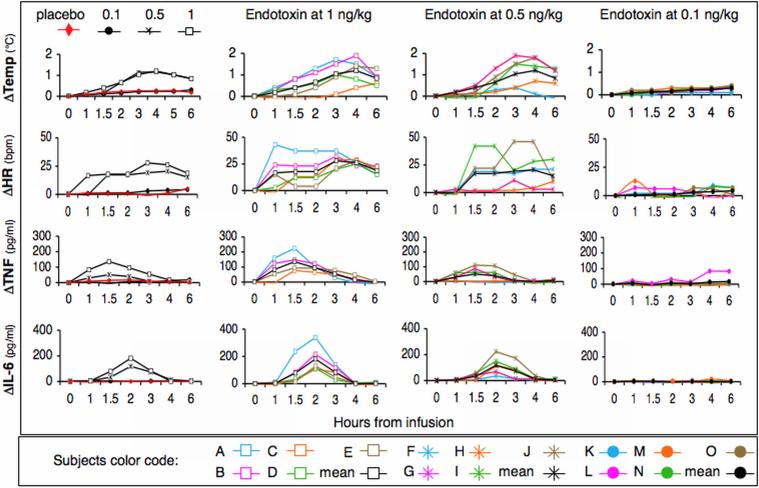
To characterize the endotoxemia response threshold in human subjects, volunteers were challenged with saline (control) or a bolus endotoxin dose of 1-, 0.5- or 0.1-ng/kg. Each subject (n=5 per group) was assigned a specific color and symbol code shown in Figures 1 through 4. All subjects administered endotoxin at 1 ng/kg exhibited characteristic and statistically significant increases in core temperature (p<0.001), heart rate (HR) (p<0.01), and cytokines (Figure 1) (TNFα p<0.005, IL-6 p<0.0001). Subjects challenged with endotoxin at 0.5 ng/kg exhibited similar but attenuated responses. Compared to the control group, changes in core temperature (p<0.001), heart rate (p<0.01) and IL-6 (p<0.001), but not TNFα, were all statistically significant. Subjects challenged with endotoxin at 0.1 ng/kg exhibited, on average, no response. These data support work by others demonstrating small and variable systemic inflammatory responses in subjects challenged with endotoxin at 0.25- or 0.3-ng/kg 34, 35.
Figure 1.
In vivo endotoxin-induced responses in humans. Subjects (n=5 per group) were challenged with saline (placebo group) or endotoxin at 1-, 0.5- or 0.1-ng/kg. Subjects were assigned a unique color and symbol code that can be followed throughout Figures 1-4. Endotoxin-induced systemic changes in core body temperature, hear rate (HR), and cytokine (IL-6 and TNF) responses were monitored at the indicated time post-infusion. The panels in the left hand column represent mean responses. All other panels show dose- and time-dependent responses per subject.
Figure 4.
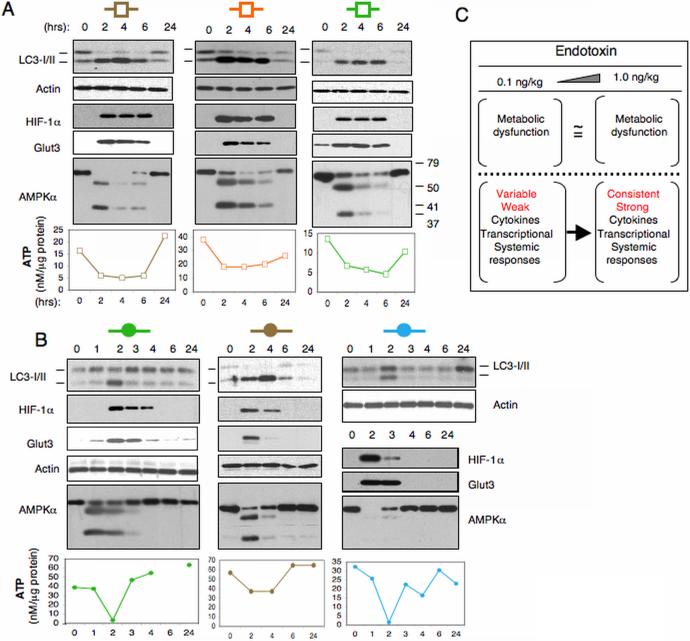
In vivo endotoxin triggers metabolic perturbations in human leukocytes. Blood samples were obtained at the times indicated from subjects described in Figure 1 who were challenged with endotoxin at either (A) 1 ng/kg or (B) 0.1 ng/kg. Leukocyte lysates containing equal protein amounts were subjected to Western blotting and ATP analyses. (C) Schematic contrasting the in vivo endotoxin response at doses of 1 ng/kg and 0.1 ng/kg. Both low- and high-dose endotoxin initiate metabolic perturbations in human leukocytes. In contrast, only high-dose endotoxin triggers robust inflammatory responses in all subjects.
Endotoxin at 2-4 ng/kg triggers rapid changes in total and differential leukocyte counts 8, 36. Neutrophil counts rise between 1-6 hours post-endotoxin challenge while mononuclear cells decrease in number compared to baseline 8, 36. Consistent with these prior findings, a significant increase in total leukocyte and neutrophil counts, and a decrease in lymphocyte counts were observed between 3 and 6 hour post-challenge in subjects challenged with endotoxin at 1 ng/kg or 0.5 ng/kg (Table 1). In contrast, endotoxin at 0.1 ng/kg did not trigger a significant change in total or differential leukocyte counts.
Table 1.
Endotoxin induces time- and dose-dependent changes in peripheral blood leukocytes.
| 0 hr | 3 hr 6 hr 24 hr | |||
|---|---|---|---|---|
| Total cells × 109/liter | ||||
| 1 ng/kg | 6.8 ±0.7 | 11.4±0.7 | 10.9 ±1.0 | 6.8 ±0.9 |
| 0.5 ng/kg | 6.0 ±0.4 | 11.5±0.7 | 10.9 ±1.0 | 6.8 ±0.9 |
| 0.1 ng/kg | 6.0 ±0.9 | 7.3 ±0.9 | 8.4 ±0.6 | 6.2 ±0.8 |
| Placebo | 6.9 ±0.8 | 8.3 ±0.4 | 8.0 ±0.5 | 7.5 ±1.1 |
| Neutrophils, % | ||||
| 1 ng/kg | 55.9±4.7 | 92.7±1.2 | 86.8±1.9 | 57.6±4.3 |
| 0.5 ng/kg | 59.2±5.3 | 87.0±2.6 | 82.9±4.5 | 56.2±1.7 |
| 0.1 ng/kg | 58.9±7.4 | 76.0±4.7 | 73.3±2.2 | 61.5±5.5 |
| Placebo | 62.5±2.5 | 70.5±6.3 | 67.7±4.6 | 60.3±25.5 |
| Monocytes, % | ||||
| 1 ng/kg | 7.9±1.2 | 2.3±0.9 | 5.1±0.4 | 8.4±0.9 |
| 0.5 ng/kg | 8.0±0.7 | 3.8±1.4 | 6.9±1.3 | 9.4±2.0 |
| 0.1 ng/kg | 7.2±1.1 | 6.7±0.5 | 5.4±1.2 | 7.7±1.5 |
| Placebo | 7.0±0.9 | 5.6 ±0.9 | 6.1±0.8 | 7.2 ±1.0 |
| Lymphocytes, % | ||||
| 1 ng/kg | 26.4±12.3 | 9.5±3.7 | 5.3±1.7 | 29.4±3.2 |
| 0.5 ng/kg | 30.4±5.8 | 7.7±2.1 | 9.6±3.1 | 31.6±3.7 |
| 0.1 ng/kg | 31.2±6.4 | 16.2±4.2 | 19.2±2.7 | 28.4±4.2 |
| Placebo | 27.0±1.7 | 21.2±4.6 | 23.1±3.5 | 29.1±5.1 |
Blood samples were obtained at baseline (time 0) and at 3, 6 and 24 hours from subjects after challenge with endotoxin at 1 ng/kg, 0.5 ng/kg or 0.1 ng/kg (n=5 per group). Control subjects (placebo) were administered saline (n=4). Total leukocyte and differential blood cell counts were determined by the clinical laboratory at the university hospital. Two-way repeated-measures analyses of variance were performed relative to placebo group. Changes in total leukocyte count were significant at p≤0.0002 for subjects challenged with endotoxin at 1 ng/kg or 0.5 ng/kg. For both neutrophils and lymphocytes the effects were at significant at p≤0.02 for subjects challenged with endotoxin at1 ng/kg or 0.5 ng/kg. The changes in monocyte counts were not significant for either the 1 ng/kg or 0.5 ng/kg doses. The changes in total leukocyte and differential cell counts were not significant for subjects challenged with endotoxin at 0.1 ng/kg.
In vivo endotoxin-induced cellular responses in healthy human subjects
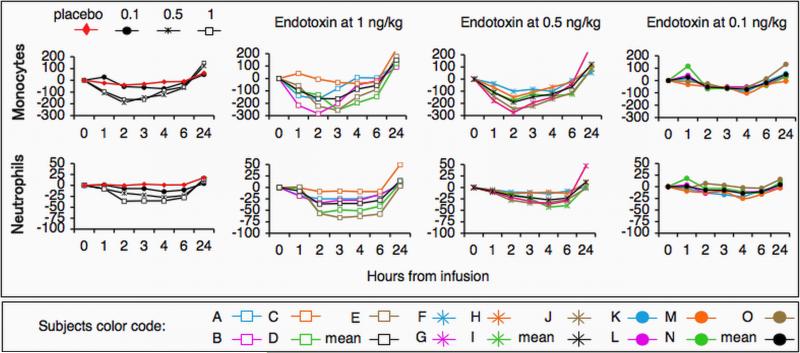
Leukocytes shed their TNF receptor type II (TNF-R) following activation 33, 37, 38. While the studies shown in Figure 1 examined systemic responses, analyses of TNF-R surface expression using flow cytometry determines cell-specific responses. Endotoxin at 1 ng/kg triggered a rapid and statistically significant decline in TNF-R expression on neutrophil (p<0.02) and monocyte surfaces (p<0.001) (Figure 2). Endotoxin at 0.5 ng/kg induced a similar statistically significant decline in TNF-R expression on neutrophils (p<0.01) and monocytes (p<0.01) surface. In contrast, endotoxin at 0.1 ng/kg induced negligible changes in TNF-R cell surface expression in all subjects.
Figure 2.
In vivo endotoxin-induced changes in TNF-receptor II expression. Leukocytes were isolated from subjects challenged with endotoxin at 1-, 0.5- or 0.1-ng/kg. TNF-receptor II (TNF-R) expression on monocytes and/or neutrophils surface was determined by flow cytometery. Data are expressed as changes in arbitrary fluorescent units (AFU) from time 0. The panels in the left hand column represent mean responses. All other panels show dose- and time-dependent responses per subject.
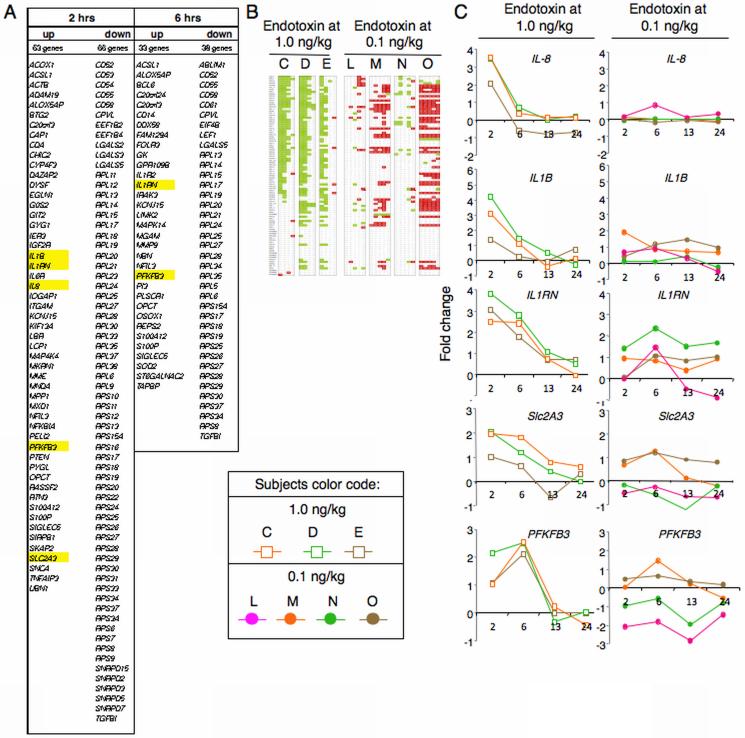
Prior genome-wide gene-expression analyses established that endotoxin at 2-4-ng/kg triggers transcriptional changes in human subjects leukocytes 7, 8. We performed time-dependent expression analysis from the Focus Gene-Chip® microarrays (Affymetrix) representing 8,793 unique genes. We identified approximately 175 genes that were either induced or suppressed in three subjects challenged with endotoxin at 1 ng/kg (Figure 3A). The vast majority of these common transcripts represented RPL and RPS genes encoding proteins associated with the large (RPL) or small (RPS) ribosomal subunits 39 (Figures 3B). By 2 hours post challenge, 56 of the total 94 RPL /RPS genes present on the Focus Gene-Chip® microarray were suppressed in these subjects (Figures 3B and 3C). The commonly induced transcripts include several that are associated with cytokine production (IL8, IL1B, IL1RN), and two (Slc2A3 and PFKFB3) that are associated with glycolysis (Figures 3C and 3D). Slc2A3 and PFKFB3 encode the glucose transporter Glut3 and 6-phosphofructo-2-kinase, respectively. Remarkably, no common transcript was either induced or suppressed in all four subjects challenged with endotoxin at 0.1 ng/kg. Collectively, these data demonstrate that an in vivo endotoxin dose greater than 0.1 ng/kg is required to initiate consistent systemic and cytokine responses, as well as changes in leukocyte cell surface receptors and gene expression.
Figure 3.
In vivo endotoxin-induced changes in leukocyte transcriptome. Temporal changes in leukocyte transcripts were examined for a subset of the subjects described in Figures 1 and 2. (A) Gene expression analyses identified ~175 common genes that were either induced or suppressed at least 2-fold in leukocytes from subjects (n=3) challenged with endotoxin at 1 ng/kg. Changes in gene expression, which were determined at times 2, 6, 13 and 24 hours post-endotoxin challenge as compared to time 0, peaked between 2 and 6 hours. (B) RPL/RPS gene expression changes observed in leukocytes challenged with an in vivo endotoxin dose of 1 ng/kg (lanes C, D and E) or 0.1 ng/kg (lanes L, M, N and O). Green and red indicate, respectively, at least a 2-fold decline or increase in gene expression at 2, 6, 13 and 24 hours post-endotoxin challenge relative to time 0. (C) Shown are expression patterns of select genes, whose names are highlighted in yellow in panel A.
A sub-threshold in vivo endotoxin dose triggers metabolic perturbations in human leukocytes
Recently we showed that in vivo endotoxin at a dose of 2 ng/kg triggers profound metabolic perturbations in human leukocytes, including a decrease in ATP concentration and an increase in autophagy 18. Therefore, to determine whether low-dose endotoxemia can induce similar metabolic responses, we explored in humans the in vivo metabolic response to endotoxin at doses of 1.0 and 0.1 ng/kg. We isolated whole blood leukocytes from a subset of the subjects described in Figure 1. Temporal changes in ATP levels, autophagy, as well as changes in AMPKα, HIF-1α and Glut3 protein expression were examined both pre- (0 hr) and post-endotoxin bolus, at the time points indicated (Figure 4). The leukocytes obtained from those subjects post-endotoxin challenge (1 ng/kg) exhibited a decline in ATP levels reaching a nadir between 2-6 hours post-infusion (Figure 4A). This was accompanied by changes in LC3-II: LC3-I expression ratio, indicative of an increase in autophagy 40, 41 (Figure 4). In parallel, HIF-1α and Glut3 expression increased over the same time frame, supporting our previous observations in mice. A decline in ATP levels is expected to activate AMPK, a key cellular energy sensor 19, 42. AMPK activation requires AMPKα phosphorylation at threonine residue 172 43. Consistent with our prior data in mice, however, we found that leukocyte AMPKα expression declined quickly and abruptly (Figure 4). Furthermore, the ~63 kD AMPKα protein band was replaced by two smaller protein bands of approximately 55-kD and 35-kD, demonstrating that AMPKα is rapidly and transiently degraded in human leukocytes following an in vivo endotoxin challenge. Next, we analyzed whole blood leukocytes obtained from the subjects cohort challenged with 0.1 ng/kg endotoxin (Figure 4B). Unexpectedly, we identified metabolic and protein expression changes (Figure 4B) that were qualitatively similar to those induced by endotoxin at 1 ng/kg. These observations are the first to show that a TLR4 ligand can trigger profound changes in cellular metabolic pathways in the absence of systemic inflammatory indicators.
In vitro endotoxin triggers metabolic responses in human leukocytes
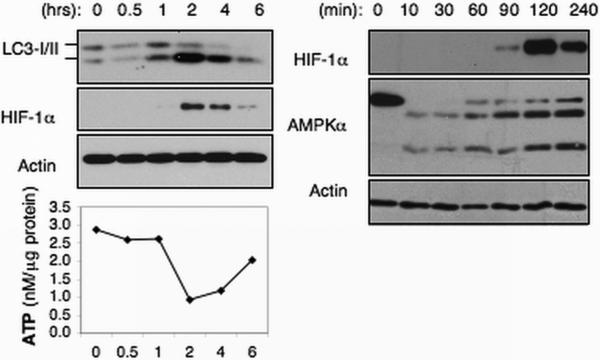
Next, we asked whether the in vivo effects of endotoxin could be reproduced in an in vitro system. Indeed, leukocytes isolated from blood stimulated with endotoxin (10 ng/ml) in vitro exhibited metabolic perturbations that were identical to those observed in leukocytes obtained from subjects who had been challenged with endotoxin in vivo (Figure 5). Furthermore, as observed in liver from in vivo endotoxin-challenged mice, AMPKα expression declined within minutes (~10 min) after the addition of endotoxin (Figure 5). This was followed by the appearance of HIF-1α and Glut3 expression by 90 minutes post-challenge, increased autophagy and a decline in ATP levels. Remarkably, the endotoxin-induced metabolic responses detected in leukocytes lasted for approximately 6 hours irrespective of whether the endotoxin challenge occurred in vivo or in vitro. These data establish that endotoxin induces a monophasic bioenergetics response of set duration in human leukocytes.
Figure 5.
Endotoxin induces cellular metabolic perturbations in vitro in whole blood leukocytes. Blood samples were untreated (control) or treated with (A) endotoxin (10 ng/ml) for the indicated time. Leukocytes were isolated at the indicated time post-endotoxin treatment and lysed. Lysates were subjected to Western blotting and ATP analyses.
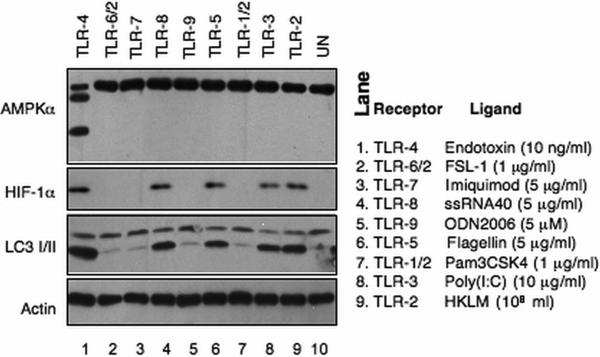
Ten TLR family members have been identified in humans (TLR 1-10) 44. Analyses of human whole blood leukocytes treated with TLR 1-9 ligands in vitro revealed that TLR-2, −3, −5, and −8 ligands each induced HIF-1α expression and autophagy (Figure 6). However, only endotoxin/TLR4 induced AMPKα degradation, as well as HIF-1α expression and autophagy. These findings establish that endotoxin/TLR4 induce a unique cellular metabolic phenotype in human leukocytes.
Figure 6.
In vitro toll-like receptors induced responses in whole blood leukocytes. Whole blood samples were treated with toll-like receptor (TLR) ligands at the indicated concentration. The leukocytes were isolated at 2 hours post-treatment and lysed. The lysates were subjected to Western blotting analyses.
Discussion
We discovered that in vivo endotoxin at a dose as low as 0.1 ng/kg, which is below the threshold needed to induce systemic responses, triggers a rapid and transient decline in ATP levels and the concomitant appearance of a unique protein expression signature in leukocytes from healthy human subjects. The protein expression signature includes three prominent features: i) AMPKα degradation, ii) increased HIF-1α expression, and iii) autophagy, collectively indicative of a highly regulated metabolic response. Previously we showed that in vivo endotoxin triggers a simultaneous and abrupt decline in AMPKα expression followed by increases in HIF-1α expression and autophagy in mice leukocytes and liver 18. It is therefore possible that the profound changes in AMPKα and HIF-1α expression observed in human leukocytes are also representative of changes that unfold simultaneously in other key human organs, such as liver.
We hypothesize that TLR4 triggers two sequential outcomes. AMPK degradation is the first of these two outcomes. In vitro, AMPKα degradation was detected within 10 minutes (Figure 5). In vivo, AMPKα degradation was seen as early as 1-hour post challenge (the earliest time point studied). It is interesting to note that AMPKα degradation was also detected in liver of endotoxin challenged mice by 10 minutes post-challenge 18. The mechanism leading to AMPKα degradation is currently undetermined. The second outcome detected in human leukocytes, as well as mice leukocytes and liver18, includes increases in HIF-1α/HIF-1 expression, autophagy, and a decline in ATP levels. All three events appear to unfold simultaneously within 90-120 minutes post challenge. TLR-2, TLR-3, TLR-5, and TLR-8 ligands all induced increases in HIF-1α expression and autophagy, in the absence of AMPKa degradation (Figure 6). These observations, and our studies in mice collectively suggest that: i) AMPKα degradation and the increases in HIF-1α expression and autophagy are independently regulated, and ii) AMPKα degradation is a direct and specific TLR4-mediated event.
Although initially thought to be activated exclusively in response to hypoxia, it is now known that endotoxin stabilizes HIF-1α expression, and thus activates HIF-1, under either hypoxic or normoxic conditions 45-47 as would have been the case here for the human volunteers administered intravenous endotoxin. HIF-1 is a positive regulator of glycolysis and a suppressor of mitochondrial biogenesis and function 21-24. To enable an increase in glycolysis, HIF-1 up-regulates the expression of glucose transporters such as Glut3. The shift from mitochondrial oxidative phosphorylation to glycolysis comes at a substantial energey cost since glycolysis produces only 2 ATP molecules for every glucose molecule entering the cycle, while mitochondria produce 36 ATP molecules. This, in our opinion, is the reason for the decline in cellular ATP levels seen when HIF-1a is expressed. Conceptually, a net decline in cellular ATP levels would be expected to activate AMPK 19. However, similarly to what we observed in mice leukocytes and liver 18, it is evident that endotoxin/TLR4 precludes AMPK activation in human leukocytes through the induction of AMPKα degradation. These observations indicate that in both mice and human cells, HIF-1 is the dominant metabolic regulator downstream of TLR4. As a transcription factor, HIF-1 regulates the expression of numerous genes, including BNIP3 25, 26, which in turn activates autophagy. Whether autophagy is a mere byproduct of HIF-1 activation, or an active participant in the metabolic process regulated by HIF-1, remains to be determined.
Since their discovery in the mid 80s, cytokines were considered prime initiators of systemic inflammation. Although the existence of small changes in either cytokines or transcripts levels can not be excluded, our data now show that endotoxin-induced changes in cellular metabolism unfold rapidly and in the absence of detectable changes in plasma cytokine levels or leukocyte transcriptome,. The in vivo endotoxin-induced metabolic responses are recapitulated in whole blood leukocytes treated with endotoxin in vitro. Collectively, our findings establish that the molecular machinery that links TLR4 to metabolic signaling pathways is exquisitely sensitive to small fluctuations in TLR4 ligand concentrations. While it is likely that this remarkable sensitivity is an enabler of rapid metabolic responses in leukocytes in the face of endogenous danger signals and/or invading pathogens, chronic TLR4 activation and persistent metabolic responses that ensue are similarly likely to play a role relative to the onset of human diseases.
Low-grade inflammatory responses have been implicated in the pathogenesis of multiple chronic human diseases, including cancer, atherosclerosis, obesity, and hear failure, though the mechanism of this relationship is currently undetermined. Historically, the presence of endotoxin was attributed to invading Gram-negative bacteria. However, the realization that endogenous gut bacteria might also release endotoxin requires conceptual revaluation of the role of TLR4/endotoxin in human pathophysiology. For example, a recent report showed that high-fat diet triggers a rapid increase in circulating endotoxin levels in otherwise healthy subjects 48. When combined with our data, these data suggest that chronic exposure to high-fat diet could trigger low-grade inflammation, and ultimately TLR4-mediated metabolic responses. In mice, high-fat diet triggered an increase in circulating endotoxin levels, and ultimately insulin resistance, a hallmark of metabolic dysfunction 49, 50. Continuous infusion of low dose endotoxin in mice reproduced this outcome 32. Detection of changes in expression of metabolic pathway regulators in leukocytes from subjects with clinical evidence of a metabolic disease, such as diabetes, will support the notion that TLR4 signaling plays a central role in human health.
Acknowledgements
We thank Mr. Michael T Reddell for his microarray gene expression data analyses.
Footnotes
Disclosure: This project was supported, in part, by USPHS Award Number GM034695 to SFL. The authors declare no conflict of interest.
References
- 1.Lowry SF. Human endotoxemia: a model for mechanistic insight and therapeutic targeting. Shock. 2005;24(Suppl 1):94–100. doi: 10.1097/01.shk.0000191340.23907.a1. [DOI] [PubMed] [Google Scholar]
- 2.Andreasen AS, Krabbe KS, Krogh-Madsen R, et al. Human endotoxemia as a model of systemic inflammation. Curr Med Chem. 2008;15(17):1697–705. doi: 10.2174/092986708784872393. [DOI] [PubMed] [Google Scholar]
- 3.Bahador M, Cross AS. From therapy to experimental model: a hundred years of endotoxin administration to human subjects. J Endotoxin Res. 2007;13(5):251–79. doi: 10.1177/0968051907085986. [DOI] [PubMed] [Google Scholar]
- 4.Suffredini AF, Hochstein HD, McMahon FG. Dose-related inflammatory effects of intravenous endotoxin in humans: evaluation of a new clinical lot of Escherichia coli O:113 endotoxin. J Infect Dis. 1999;179(5):1278–82. doi: 10.1086/314717. [DOI] [PubMed] [Google Scholar]
- 5.van der Poll T, Calvano SE, Kumar A, et al. Endotoxin induces downregulation of tumor necrosis factor receptors on circulating monocytes and granulocytes in humans. Blood. 1995;86(7):2754–9. [PubMed] [Google Scholar]
- 6.Calvano SE, Coyle SM. Experimental human endotoxemia: a model of the systemic inflammatory response syndrome? Surg Infect (Larchmt) 2012;13(5):293–9. doi: 10.1089/sur.2012.155. [DOI] [PMC free article] [PubMed] [Google Scholar]
- 7.Calvano SE, Xiao W, Richards DR, et al. A network-based analysis of systemic inflammation in humans. Nature. 2005;437(7061):1032–7. doi: 10.1038/nature03985. Epub 2005 Aug 31. [DOI] [PubMed] [Google Scholar]
- 8.Talwar S, Munson PJ, Barb J, et al. Gene expression profiles of peripheral blood leukocytes after endotoxin challenge in humans. Physiol Genomics. 2006;25(2):203–15. doi: 10.1152/physiolgenomics.00192.2005. [DOI] [PMC free article] [PubMed] [Google Scholar]
- 9.Haimovich B, Reddell MT, Calvano JE, et al. A novel model of common Toll-like receptor 4- and injury-induced transcriptional themes in human leukocytes. Crit Care. 2010;14(5):R177. doi: 10.1186/cc9283. [DOI] [PMC free article] [PubMed] [Google Scholar]
- 10.Xiao W, Mindrinos MN, Seok J, et al. A genomic storm in critically injured humans. J Exp Med. 2011;208(13):2581–90. doi: 10.1084/jem.20111354. [DOI] [PMC free article] [PubMed] [Google Scholar]
- 11.Janeway CA, Jr., Medzhitov R. Innate immune recognition. Annu Rev Immunol. 2002;20:197–216. doi: 10.1146/annurev.immunol.20.083001.084359. [DOI] [PubMed] [Google Scholar]
- 12.Matzinger P. The danger model: a renewed sense of self. Science. 2002;296(5566):301–5. doi: 10.1126/science.1071059. [DOI] [PubMed] [Google Scholar]
- 13.Bianchi ME. DAMPs, PAMPs and alarmins: all we need to know about danger. J Leukoc Biol. 2007;81(1):1–5. doi: 10.1189/jlb.0306164. [DOI] [PubMed] [Google Scholar]
- 14.Fink MP. Cytopathic hypoxia. Mitochondrial dysfunction as mechanism contributing to organ dysfunction in sepsis. Crit Care Clin. 2001;17(1):219–37. doi: 10.1016/s0749-0704(05)70161-5. [DOI] [PubMed] [Google Scholar]
- 15.Brealey D, Brand M, Hargreaves I, et al. Association between mitochondrial dysfunction and severity and outcome of septic shock. Lancet. 2002;360(9328):219–23. doi: 10.1016/S0140-6736(02)09459-X. [DOI] [PubMed] [Google Scholar]
- 16.Carre JE, Singer M. Cellular energetic metabolism in sepsis: the need for a systems approach. Biochim Biophys Acta. 2008;1777(7-8):763–71. doi: 10.1016/j.bbabio.2008.04.024. [DOI] [PubMed] [Google Scholar]
- 17.Padfield KE, Astrakas LG, Zhang Q, et al. Burn injury causes mitochondrial dysfunction in skeletal muscle. Proc Natl Acad Sci U S A. 2005;102(15):5368–73. doi: 10.1073/pnas.0501211102. [DOI] [PMC free article] [PubMed] [Google Scholar]
- 18.Zhang Z, Lowry SF, Guarente L, Haimovich B. Roles of SIRT1 in the acute and restorative phases following induction of inflammation. J Biol Chem. 2010;285(53):41391–401. doi: 10.1074/jbc.M110.174482. [DOI] [PMC free article] [PubMed] [Google Scholar]
- 19.Hardie DG. AMP-activated protein kinase: an energy sensor that regulates all aspects of cell function. Genes Dev. 2011;25(18):1895–908. doi: 10.1101/gad.17420111. [DOI] [PMC free article] [PubMed] [Google Scholar]
- 20.Jager S, Handschin C, St-Pierre J, Spiegelman BM. AMP-activated protein kinase (AMPK) action in skeletal muscle via direct phosphorylation of PGC-1alpha. Proc Natl Acad Sci U S A. 2007;104(29):12017–22. doi: 10.1073/pnas.0705070104. [DOI] [PMC free article] [PubMed] [Google Scholar]
- 21.Semenza GL, Roth PH, Fang HM, Wang GL. Transcriptional regulation of genes encoding glycolytic enzymes by hypoxia-inducible factor 1. J Biol Chem. 1994;269(38):23757–63. [PubMed] [Google Scholar]
- 22.Papandreou I, Cairns RA, Fontana L, et al. HIF-1 mediates adaptation to hypoxia by actively downregulating mitochondrial oxygen consumption. Cell Metab. 2006;3(3):187–97. doi: 10.1016/j.cmet.2006.01.012. [DOI] [PubMed] [Google Scholar]
- 23.Kim JW, Tchernyshyov I, Semenza GL, Dang CV. HIF-1-mediated expression of pyruvate dehydrogenase kinase: a metabolic switch required for cellular adaptation to hypoxia. Cell Metab. 2006;3(3):177–85. doi: 10.1016/j.cmet.2006.02.002. [DOI] [PubMed] [Google Scholar]
- 24.Zhang H, Gao P, Fukuda R, et al. HIF-1 inhibits mitochondrial biogenesis and cellular respiration in VHL-deficient renal cell carcinoma by repression of C-MYC activity. Cancer Cell. 2007;11(5):407–20. doi: 10.1016/j.ccr.2007.04.001. [DOI] [PubMed] [Google Scholar]
- 25.Zhang H, Bosch-Marce M, Shimoda LA, et al. Mitochondrial autophagy is an HIF-1-dependent adaptive metabolic response to hypoxia. J Biol Chem. 2008;283(16):10892–903. doi: 10.1074/jbc.M800102200. [DOI] [PMC free article] [PubMed] [Google Scholar] [Retracted]
- 26.Bellot G, Garcia-Medina R, Gounon P, et al. Hypoxia-induced autophagy is mediated through hypoxia-inducible factor induction of BNIP3 and BNIP3L via their BH3 domains. Mol Cell Biol. 2009;29(10):2570–81. doi: 10.1128/MCB.00166-09. [DOI] [PMC free article] [PubMed] [Google Scholar]
- 27.Kim J, Kundu M, Viollet B, Guan KL. AMPK and mTOR regulate autophagy through direct phosphorylation of Ulk1. Nat Cell Biol. 2011;13(2):132–41. doi: 10.1038/ncb2152. [DOI] [PMC free article] [PubMed] [Google Scholar]
- 28.Mizushima N. Autophagy: process and function. Genes Dev. 2007;21(22):2861–73. doi: 10.1101/gad.1599207. [DOI] [PubMed] [Google Scholar]
- 29.Bampton ET, Goemans CG, Niranjan D, et al. The dynamics of autophagy visualized in live cells: from autophagosome formation to fusion with endo/lysosomes. Autophagy. 2005;1(1):23–36. doi: 10.4161/auto.1.1.1495. [DOI] [PubMed] [Google Scholar]
- 30.Mizushima N, Yamamoto A, Matsui M, et al. In vivo analysis of autophagy in response to nutrient starvation using transgenic mice expressing a fluorescent autophagosome marker. Mol Biol Cell. 2004;15(3):1101–11. doi: 10.1091/mbc.E03-09-0704. [DOI] [PMC free article] [PubMed] [Google Scholar]
- 31.Rikkers LF, Dr. Stephen F, Lowry Annals of Surgery. 1947–2011;2011;254(4):449. [Google Scholar]
- 32.Haimovich B, Calvano J, Haimovich AD, et al. In vivo endotoxin synchronizes and suppresses clock gene expression in human peripheral blood leukocytes. Crit Care Med. 2010;38(3):751–758. doi: 10.1097/CCM.0b013e3181cd131c. [DOI] [PMC free article] [PubMed] [Google Scholar]
- 33.Wittebole X, Coyle SM, Kumar A, et al. Expression of tumour necrosis factor receptor and Toll-like receptor 2 and 4 on peripheral blood leucocytes of human volunteers after endotoxin challenge: a comparison of flow cytometric light scatter and immunofluorescence gating. Clin Exp Immunol. 2005;141(1):99–106. doi: 10.1111/j.1365-2249.2005.02831.x. [DOI] [PMC free article] [PubMed] [Google Scholar]
- 34.Taudorf S, Krabbe KS, Berg RM, et al. Human models of low-grade inflammation: bolus versus continuous infusion of endotoxin. Clin Vaccine Immunol. 2007;14(3):250–5. doi: 10.1128/CVI.00380-06. [DOI] [PMC free article] [PubMed] [Google Scholar]
- 35.Stephens RC, O'Malley CM, Frumento RJ, et al. Low-dose endotoxin elicits variability in the inflammatory response in healthy volunteers. J Endotoxin Res. 2005;11(4):207–12. doi: 10.1179/096805105X58661. [DOI] [PubMed] [Google Scholar]
- 36.Richardson RP, Rhyne CD, Fong Y, et al. Peripheral blood leukocyte kinetics following in vivo lipopolysaccharide (LPS) administration to normal human subjects. Influence of elicited hormones and cytokines. Ann Surg. 1989;210(2):239–45. doi: 10.1097/00000658-198908000-00018. [DOI] [PMC free article] [PubMed] [Google Scholar]
- 37.Dri P, Gasparini C, Menegazzi R, et al. TNF-Induced shedding of TNF receptors in human polymorphonuclear leukocytes: role of the 55-kDa TNF receptor and involvement of a membrane-bound and non-matrix metalloproteinase. J Immunol. 2000;165(4):2165–72. doi: 10.4049/jimmunol.165.4.2165. [DOI] [PubMed] [Google Scholar]
- 38.Garton KJ, Gough PJ, Raines EW. Emerging roles for ectodomain shedding in the regulation of inflammatory responses. J Leukoc Biol. 2006;79(6):1105–16. doi: 10.1189/jlb.0106038. [DOI] [PubMed] [Google Scholar]
- 39.van Riggelen J, Yetil A, Felsher DW. MYC as a regulator of ribosome biogenesis and protein synthesis. Nat Rev Cancer. 2010;10(4):301–9. doi: 10.1038/nrc2819. [DOI] [PubMed] [Google Scholar]
- 40.Kabeya Y, Mizushima N, Ueno T, et al. LC3, a mammalian homologue of yeast Apg8p, is localized in autophagosome membranes after processing. Embo J. 2000;19(21):5720–8. doi: 10.1093/emboj/19.21.5720. [DOI] [PMC free article] [PubMed] [Google Scholar]
- 41.Mizushima N, Yoshimori T. How to Interpret LC3 Immunoblotting. Autophagy. 2007;3(6):542–5. doi: 10.4161/auto.4600. [DOI] [PubMed] [Google Scholar]
- 42.Mihaylova MM, Shaw RJ. The AMPK signalling pathway coordinates cell growth, autophagy and metabolism. Nat Cell Biol. 2011;13(9):1016–23. doi: 10.1038/ncb2329. [DOI] [PMC free article] [PubMed] [Google Scholar]
- 43.Hawley SA, Davison M, Woods A, et al. Characterization of the AMP-activated protein kinase kinase from rat liver and identification of threonine 172 as the major site at which it phosphorylates AMP-activated protein kinase. J Biol Chem. 1996;271(44):27879–87. doi: 10.1074/jbc.271.44.27879. [DOI] [PubMed] [Google Scholar]
- 44.Zuany-Amorim C, Hastewell J, Walker C. Toll-like receptors as potential therapeutic targets for multiple diseases. Nat Rev Drug Discov. 2002;1(10):797–807. doi: 10.1038/nrd914. [DOI] [PubMed] [Google Scholar]
- 45.Rius J, Guma M, Schachtrup C, et al. NF-kappaB links innate immunity to the hypoxic response through transcriptional regulation of HIF-1alpha. Nature. 2008;453(7196):807–11. doi: 10.1038/nature06905. [DOI] [PMC free article] [PubMed] [Google Scholar]
- 46.Cramer T, Yamanishi Y, Clausen BE, et al. HIF-1alpha is essential for myeloid cellmediated inflammation. Cell. 2003;112(5):645–57. doi: 10.1016/s0092-8674(03)00154-5. [DOI] [PMC free article] [PubMed] [Google Scholar]
- 47.Peyssonnaux C, Datta V, Cramer T, et al. HIF-1alpha expression regulates the bactericidal capacity of phagocytes. J Clin Invest. 2005;115(7):1806–15. doi: 10.1172/JCI23865. [DOI] [PMC free article] [PubMed] [Google Scholar]
- 48.Erridge C, Attina T, Spickett CM, Webb DJ. A high-fat meal induces low-grade endotoxemia: evidence of a novel mechanism of postprandial inflammation. Am J Clin Nutr. 2007;86(5):1286–92. doi: 10.1093/ajcn/86.5.1286. [DOI] [PubMed] [Google Scholar]
- 49.Cani PD, Amar J, Iglesias MA, et al. Metabolic endotoxemia initiates obesity and insulin resistance. Diabetes. 2007;56(7):1761–72. doi: 10.2337/db06-1491. [DOI] [PubMed] [Google Scholar]
- 50.Cani PD, Bibiloni R, Knauf C, et al. Changes in gut microbiota control metabolic endotoxemia-induced inflammation in high-fat diet-induced obesity and diabetes in mice. Diabetes. 2008;57(6):1470–81. doi: 10.2337/db07-1403. [DOI] [PubMed] [Google Scholar]


