Abstract
An accurate and high-resolution quality assurance (QA) method for proton radiotherapy beams is necessary to ensure correct dose delivery to the target. Detectors based on a large volume of liquid scintillator have shown great promise in providing fast and high-resolution measurements of proton treatment fields. However, previous work with these detectors has been limited to two-dimensional measurements, and the quantitative measurement of dose distributions was lacking. The purpose of the current study is to assess the feasibility of reconstructing three-dimensional (3D) scintillation light distributions of spot scanning proton beams using a scintillation system. The proposed system consists of a tank of liquid scintillator imaged by charge-coupled device cameras at three orthogonal viewing angles. Because of the limited number of viewing angles, we developed a profile-based technique to obtain an initial estimate that can improve the quality of the 3D reconstruction. We found that our proposed scintillator system and profile-based technique can reconstruct a single energy proton beam in 3D with a gamma passing rate (3%/3 mm local) of 100.0%. For asingle energy layer of an intensity modulated proton therapy prostate treatment plan, the proposed method can reconstruct the 3D light distribution with a gamma pass rate (3%/3 mm local) of 99.7%. In addition, we also found that the proposed method is effective in detecting errors in the treatment plan, indicating that it can be a very useful tool for 3D proton beam QA.
Keywords: proton beam quality assurance, 3D iterative reconstruction, liquid scintillation detector
1. Introduction
The finite range and sharp dose drop-off of proton beams makes them useful for delivering highly localized radiation treatments. In spot scanning proton therapy, the dose distribution is achieved by delivering individual pencil beams on a spot-by-spot basis. The spot scanning method also allows for advanced techniques such as intensity-modulated proton therapy (IMPT), in which individual pencil beams have variable intensities that are optimized to produce highly inhomogeneous dose distributions. However, fast, high-resolution, accurate verification of the IMPT dose distribution is considered to be a challenge (Archambault et al., 2012; Beddar et al., 2009; Boon et al., 1998; ICRU, 2007; Arjomandy et al., 2010; Karger et al., 2010). Although the ionization chamber is the gold standard in proton dose measurement, it is not a feasible choice to measure IMPT dose distributions. A moving ionization chamber approach could not acquire the actual dose profile because the moving pencil beam sweeps continuously. However, measuring the dose at each location would be extremely time consuming because the whole IMPT field must be delivered for each location measurement.
Previous studies have proposed various stationary detector systems to measure two-dimensional (2D) proton dose distribution. Boon et al. (1998) used a scintillating screen to acquire 2D dose distributions at the end of a water phantom. Arjomandy et al.(2010) proposed to use a 2D ion chamber array to obtain the planar proton dose distribution in a plastic water phantom. Both methods can measure lateral planes of IMPT dose distributions but lack information along the beam direction. Conversely, an imaging plate at an oblique angle (Nohtomi et al., 2003) and a multilayer ionization chamber (Dhanesar et al., 2013) have been proposed to measure the dose profile along the proton beam, but they do not provide information perpendicular to the beam direction.
To obtain three-dimensional (3D) dosimetry, Cirio et al.(2004) developed a complex detector system of multiple parallel-plate ionization chambers to achieve quasi-3D dosimetry. Karger et al.(1999) used an array of up to 24 pinpoint ionization chambers for 3D dose verification. Gel and radiochromic dosimeters can be used to reconstruct high-resolution 3D dose distributions for proton beams (Johansson et al., 1997; Zhao et al., 2012). However, dosimetric gels can be difficult to work with, requiring careful preparation and handling procedures. They also require an extra readout step (Guo et al., 2006; Zeidan et al., 2010), which necessitates a dedicated read-out device and can be relatively time consuming depending on the size of the gel and the desired resolution.
A liquid scintillator detector system has been proposed by Kirov et al.(2000) for 3D dosimetry of brachytherapy eye plaques (Kirov et al., 2005). We have previously studied and characterized a liquid scintillator system (Archambault et al., 2012; Beddar et al., 2009; Ponisch et al., 2009; Robertson et al., 2014) for verification of proton beam properties. The scintillator system is composed of a cubic tank of liquid scintillator and a charge-coupled device (CCD) camera. We have shown that, with the appropriate calibrations and corrections (Robertson et al., 2013; Robertson et al., 2014), we can obtain accurate scintillation light distributions of proton beams using our liquid scintillator system. However, this work has so far been limited to 2D projections of the scintillation light.
3D reconstruction of the scintillation light distribution can be achieved with multiple viewing angles of the scintillation light. However, our scintillator system can accommodate at most only three cameras, each located orthogonally to others. The limited number of viewing angles can introduce artefacts and limit the efficiency of 3D reconstruction. Previous studies have been done to reconstruct 3D vascular structures and ventricles using only two orthogonal x-ray images (Garreau et al., 1991; Pellot et al., 1994). However, the x-ray images are acquired from x-ray transmission, not scintillation light emission. Moreover, their 3D reconstruction methods were designed to reconstruct binary structures, which were not applicable to calculating quantitative 3D structures.
To mitigate the effects of limited viewing angles in our design, we propose a profile-based method to create an improved initial estimate of the scintillation light distribution. In this study, we performed simulations to test the performance of the 3D reconstruction using the proposed profile-based initial estimate. In the first part, we assessed the accuracy of the reconstructed volume using the proposed system. In the second part, we assessed the effectiveness of the proposed scintillator system as a quality assurance (QA) system. We introduced discrepancies to the treatment plan and tested the ability of the system to detect the errors. The findings of this study demonstrate the potential of 3D QA of IMPT using the liquid scintillator system.
2. Methods and materials
2.1. Liquid scintillator detector system
Our liquid scintillator setup consists of a cubic tank filled with BC-531 organic scintillator (Saint Gobain Crystals, Newbury, OH). The scintillator converts energy deposited by the proton beam into visible light. Currently, the scintillation light is collected by a single camera system consisting of an objective lens and a CCD camera. A detailed description of our existing liquid scintillator system can be found in Archambault et al. (2012). In the current study, we propose the addition of two more cameras. With the help of mirrors to reflect the scintillation light, the three CCD cameras will provide three unique projections at orthogonal angles. The proposed system is illustrated in figure 1.
Figure 1.
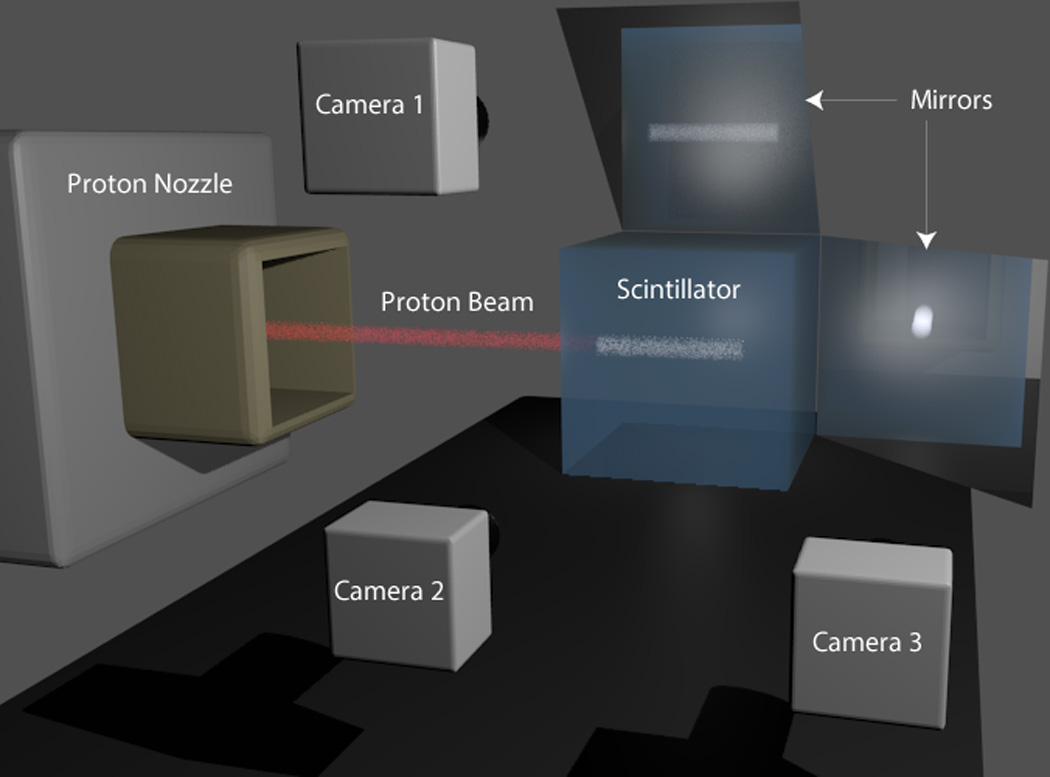
A hypothetical 3D scintillator detector system for proton beam quality assurance. The proton beam gantry irradiates the cubic liquid scintillator at the center. Cameras 1 and 2 are capturing scintillation light from the side views of the proton beam. Camera 3 is capturing the head-on view of the proton beam. The scintillation light is reflected by mirrors before reaching cameras 1 and 3.
2.2.Three-dimensional reconstruction
To reconstruct the 3D scintillation light distribution, we implemented an iterative reconstruction approach using the maximum a posteriori (MAP) algorithm. Because the process of data collection using the CCD camera should follow a Poisson distribution, an iterative approach such as the MAP algorithm is a standard tool for image reconstruction. In addition to maximizing the Poisson likelihood, the MAP algorithm also consists of regularization constraints based on prior knowledge of the actual volume (Bruyant, 2002; De Pierro and Yamagishi, 2001; Hebert and Leahy, 1989). In the current study, we applied a total variation (TV) regularization term to reduce noise in the reconstructed volume (Rudin et al., 1992). The MAP algorithm estimates the light distribution f from camera data p with
| (1) |
where i,j, and k are all voxel/pixel indices, each indicating a 3D location for the volume f or a 2D location for the plane p. l is the iteration number and Aji is the projection matrix that projects the scintillation light from voxel i onto the camera at pixel j. β is the weighting of the TV regularization term and TV (f) is the TV operator on light output volume f. TV operation measures the variation between contiguous voxels in f:
| (2) |
Notice that the light output distribution f is in 3D, and the summation and subtraction in (2) are performed in each of the three dimensions. In the current study, we used a β = 0.002, which was determined empirically to provide an optimal improvement to the final reconstructed volume.
2.3. Profile-based initial estimate
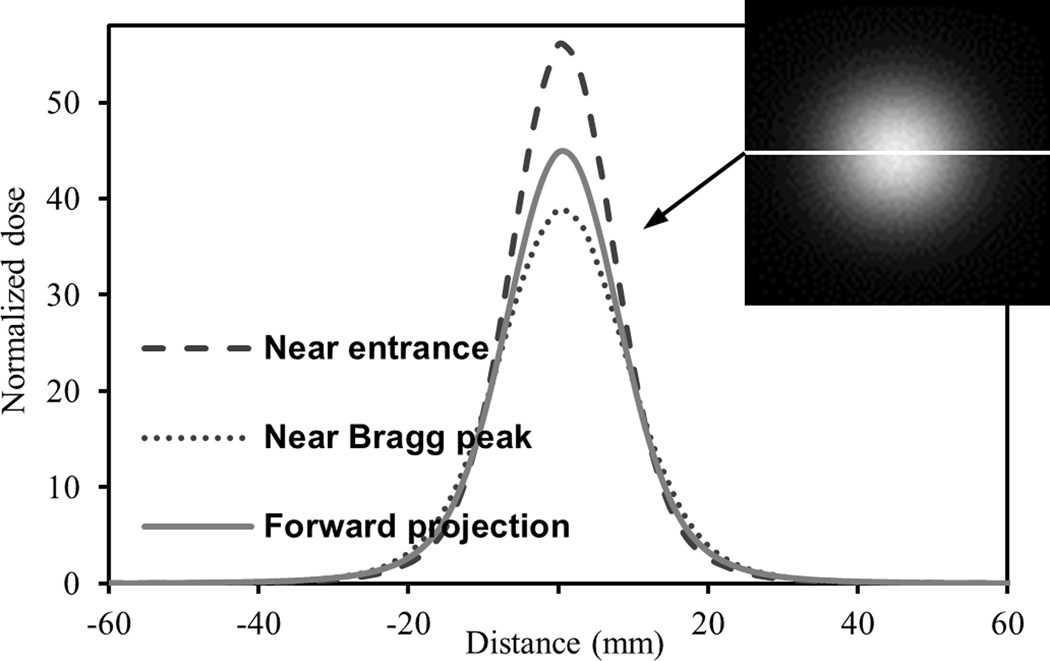
In standard reconstruction theory in medical imaging, the three viewing angles in our proposed liquid scintillator system cannot possibly satisfy the Nyquist sampling theorem. If the sampling rate of the viewing angle does not exceed the Nyquist frequency, the 3D reconstruction will generally suffer from aliasing artefacts. However, there are some unique characteristics in our system that may allow us to overcome the inadequate number of viewing angles. First, our proposed system can acquire data from all three Cartesian dimensions, whereas most medical imaging modalities acquire data in only two dimensions in a cylindrical coordinate system. Second, each scanning proton beam has a relatively simple dose distribution geometrically. One interesting characteristic of the proton beam is that the axial dose distribution, normalized to the average dose in the axial plane [see below in (3)], shows high similarity along the proton beam axis, as shown in figure 2. As a result, the scintillation light distribution will also show axial similarity. We therefore exploited this spatial similarity by using a more accurate initial light distribution estimate, f(0), for the MAP reconstruction. The closer f(0) is to the actual light output distribution to start with, the better the final reconstruction should be.
Figure 2.
The profiles of the normalized dose of a simulated 161.6 MeV proton beam through the horizontal line in the head-on orthogonal projection shown at the top right-hand corner. Three normalized dose profiles are shown: near the entrance, near the Bragg peak and in the head-on forward projection. Normalized dose is calculated using (3). The three profiles show overall good similarity with each other. The difference between the different normalized doses is relatively small away from the beam axis while the difference is larger close to the beam axis.
Owing to optical artefacts, the collected data from a CCD camera are not an orthogonal projection of the scintillation light. To create an orthogonal projection, corrections should be first applied to the camera data to minimize the optical artefacts from the system (Robertson et al., 2014). Although these optical artefacts are incorporated into the projection matrix, A, in (1), the orthogonal projection data still must be used to generate the profile-based f(0). From this point on, the notation p represents the projection collected from a CCD camera and the notation p′ represents its corresponding orthogonal projection after optical artefacts correction. The direction along the beam axis is z and the dimensions transverse to the beam axis are x and y.
The normalized light output distribution, p̂′z of the head-on forward projection is calculated using:
| (3) |
where is the average light output per pixel in the corrected projection p′z. The initial estimate, f(0) (i,j,k), is then calculated at each transverse plane using the following equation:
| (4) |
The first term on the right-hand side is the average light output per pixel in slice k0, which can be computed from the two corrected orthogonal projections p′x and p′y.
As shown in figure 2, the normalized dose away from the beam center stays relatively similar, but differs increasingly near the beam center. To generate a f(0) closer to the actual light output distribution, a quick iterative modification is made to the estimated light output distribution near the beam axis. At each plane k0, we used a threshold of , where is the maximum voxel value in slice k0, to identify the region around the peak that requires modification. A correction factor RC is then multiplied to the region in plane k0 with f(0) (i,j,k0) above the threshold:
| (5) |
M− is the 2D mask applicable to f(0) at z = k0, in which M−(i,j) = 1 if f(0) (i,j,k0) < ft. is the 1D mask in the p′x space at z = k0, where if there exists i′ along the x direction such that f(0) (i,j,k0) > ft. The variable ax is the multiplication factor that accounts for attenuation and inverse square for photons to reach projection x:
| (6) |
The first term on the right-hand side is the attenuation term where μ is the attenuation coefficient of the scintillator, dx (i,j,k) is the distance a photon needs to travel within the scintillator from (i,j,k) to projection x. The second term is the inverse square term, where Df is the reference length, for which we usually use the focal length of the camera lens, and Dx (i,j,k) is the distance between (i,j,k) and projection x. The correction factor RC(k0) is also calculated with projection p′y using (5), the final RC(k0) is averaged between the results from p′x and p′y. To summarize, it is assumed that the region with f(0) below ft is correct and therefore the region above the threshold is updated by multiplying with RC, so that the subsequent projections created by the updated f(0) will better match the actual projections. Five iterations of modifications are done to correct f(0) For each following iteration, the threshold is increased to Therefore, a smaller region that is closer to the beam center is corrected in each subsequent iteration. It is worth noting that if RC < 1, it is possible that before the fifth iteration. In such cases, we break the iterative loop to avoid artefacts. Finally, a spline smoothing algorithm is used on f(0) after the last iteration.
2.4. Simulations
MCNPX 2.7.0 (Los Alamos National Laboratory, Los Alamos, CA) was used to perform Monte Carlo simulations to calculate the 3D dose deposited by the proton beam in the liquid scintillator. Detailed specifications of the Monte Carlo simulation can be found in Sawakuchi et al.(2010). A 161.6 MeV simulated proton beam was applied with its beam axis parallel to the z direction and centered in the x–y plane. The 3D volume was divided into 496×496×658 voxels, with a spatial resolution of 0.305 mm, matching the resolution and matrix size of our prototype system.
To generate the light output distribution, a conversion output factor of 100 photon/Gy·(0.305 mm)3 was used to convert dose to scintillator light. A theoretical quenching factor was then applied to the resulting light output to create a 3D detectable light output distribution (Robertson et al., 2013). The 3D light output distribution was regridded (4× in x and y, 2× in z) and cropped (from 164 to 120 in the x and y dimensions) to a lower resolution of 120×120×329, making the resolution 1.22 mm in the axial plane and 0.61 mm along the beam axis. The axial resolution is coarser because sharp dose gradients are not expected across the axial plane. The spatial resolution was downsampled to decrease the processing time of the reconstruction due to the very large matrix size of our system. Given the inherent resolution of our system, the downsampled resolution should still be adequate.
The projection matrix, A, with the known optical artefacts described in Robertson et al.(2014), was then created to project the regridded 3D light output distribution onto the three cameras. Noise with a Poisson distribution was added to the camera data and rounded to an integer number to create the final camera data set.
MAP reconstruction was performed to reconstruct the 3D light output distribution using data from the three cameras. We used four different f(0): the commonly used uniform background and back-projection estimates and the proposed profile-based method, both with and without the correction factor RC. The reconstructed 3D light output distributions from the different f(0) were compared with the actual light output distributions. A 3D gamma analysis (Wendling et al., 2007) was used as the comparison metric using the following requirement: 3% dose difference with local normalization method, and 3 mm distance to agreement for all voxels above a 5% lower light output threshold (3%/3 mm local).
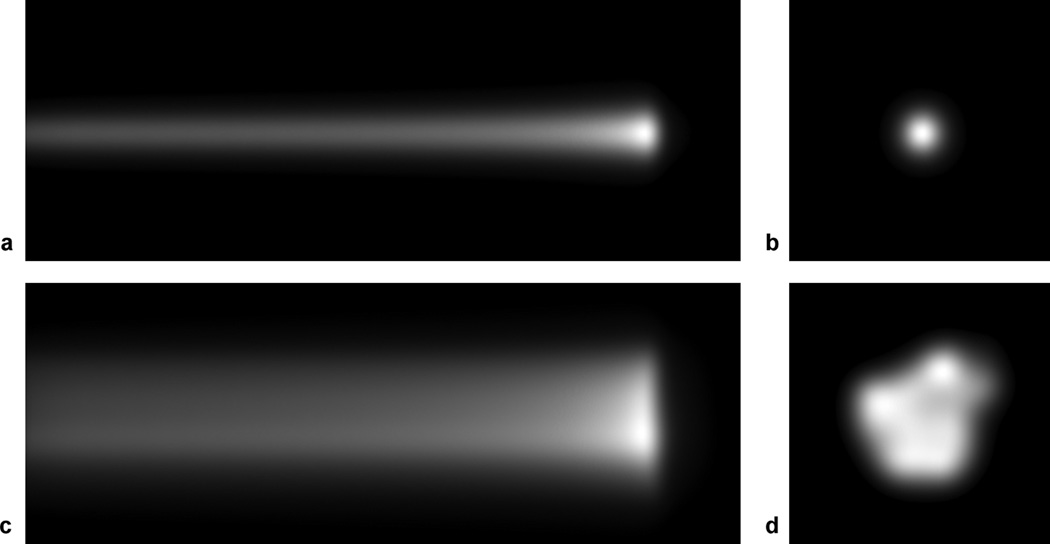
The accuracy of the 3D reconstructed light output distribution using our proposed system was investigated on two different beam models shown in figure 3: 1) a single 161.6 MeV proton beam, and 2) a collection of 69 161.6 MeV proton beams adopted from an actual proton treatment plan for prostate.
Figure 3.
Simulated camera data of 161.6 MeV proton beam(s): (a) camera data from the side view, px, and (b) from the head-on view, pz, of a single proton beam. (c) camera data from the side view, px, and (d) from the head-on view, pz, of the 69 161 MeV proton beams in a prostate treatment plan.
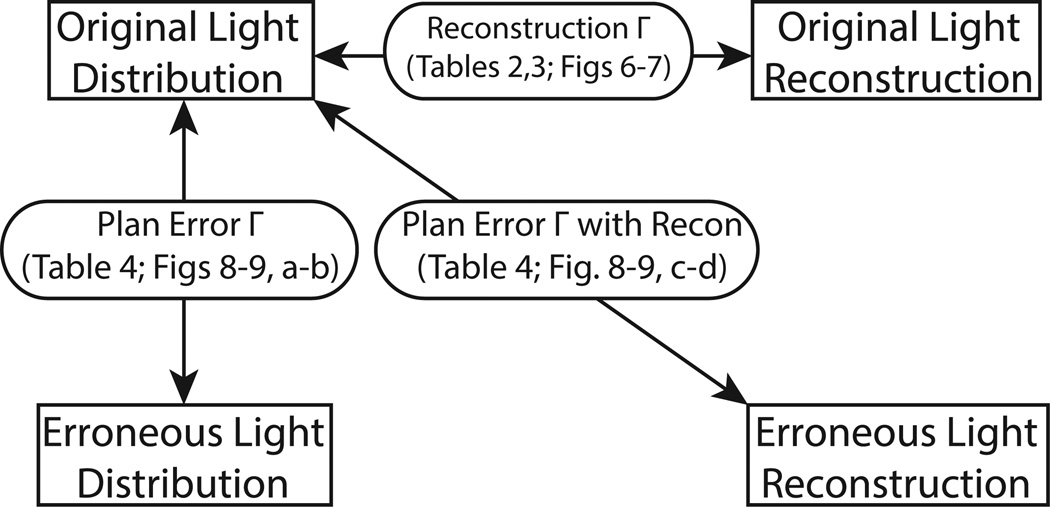
To show that the proposed methods would be suitable in QA of proton treatment plan, errors were introduced to the light output distribution of the prostate treatment plan. Camera data were then created and reconstructions were made with these camera data. Gamma analyses were then performed to assess the ability of the proposed system to detect these introduced errors. We investigated two possible scenarios in this study. In the first case, the intensity of one beamlet was mistakenly increased to double of the prescribed intensity. The chosen beamlet was centered at (x = −14 mm, y = −14 mm) and has an intensity less than half of the maximum intensity. It made up less than 2% of the combined intensity of all 69 beams. The doubling of intensity of this beam caused an increase in local light output of up to 22%. In the second case, the isocenter was shifted in the transverse plane from (x = 0 mm, y = 0 mm) to (x = 1 mm, y = −1 mm). Various gamma analyses were performed to evaluate the performance of the reconstruction. A flow chart of the performed gamma analyses is depicted in figure 4.
Figure 4.
A flow chart describing the different gamma analyses that were performed. Original Light Distribution: the original treatment plan; Original Light Reconstruction: the reconstructed distribution of the original treatment plan; Erroneous Light Distribution: the treatment plan with introduced error; Erroneous Light Reconstruction: the reconstructed distribution of the erroneous treatment plan. The reconstruction Γ assessed the performance of the reconstruction. The plan error Γ was used to identify errors in the erroneous distribution.
All routines except the calculation of the proton dose distribution were performed using Matlab R2012a (MathWorks, Natick, MA). The MAP reconstruction algorithm was optimized for parallel processing.
3. Results
On average, it took 15 min to compute one iteration using 12-core processing (AMD 2200MHz). Calculation of the profile-based initial estimate took about 4 s without RC and 5 s with RC. Because the modification factor RC is only applicable to individual proton beams, the initial estimates with RC must be calculated beam by beam. Therefore, for the prostate plan with 69 beams, the computation time for the profile-based initial estimate with RC is less than 6 min.
3.1.Reconstruction Accuracy
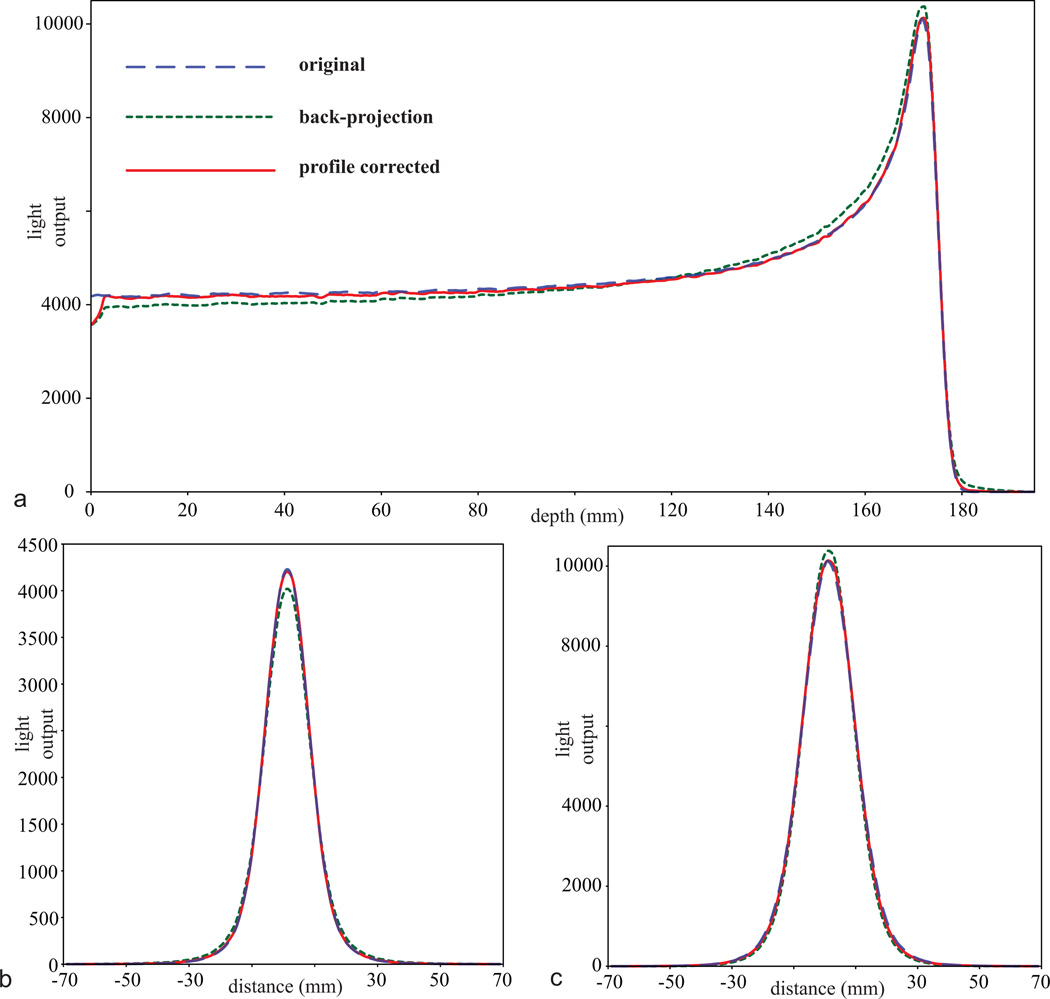
Figure 5 shows the profiles of the reconstructed light output distribution from the single proton beam model. Near the entrance, the reconstructed light output distribution was underestimated around the proton beam axis and overestimated away from it. This trend slowly reversed until about two-third of the proton depth, at which the reconstructed light output distribution became overestimated around the proton beam axis and underestimated away from it. The reconstructed light output distribution using the profile-based f(0) with RC was closer to the actual light output distribution than the reconstruction using the back-projection f(0). The profiles from the reconstruction using profile-based f(0) without RC and uniform f(0) are not shown for clarity of the graph. In general, the profiles from the reconstruction using profile-based f(0) without RC appeared closer to the truth than those from the back-projection f(0), but not as close as those of the profile-based f(0) with RC. Profiles from the reconstruction using uniform f(0) were furthest from the original light output distribution. Owing to refraction and lens perspective, the cameras were unable to detect the light output from the edges of the detector. As a result, a drop of light distribution was observed in the first 5 mm from the proton beam entrance.
Figure 5.
Light output profiles of the original single proton beam (blue dashed), the reconstructed volume using back-projection as the initial estimate after 20 iterations (green dotted), and the reconstructed volume using the profile-based initial estimate with correction factor (profile corrected) after 20 iterations (red solid), with (a) depth profiles at the center of the proton beam, (b) lateral profiles near the entrance at 15 mm depth, and (c) lateral profiles near the Bragg peak at 172 mm depth.
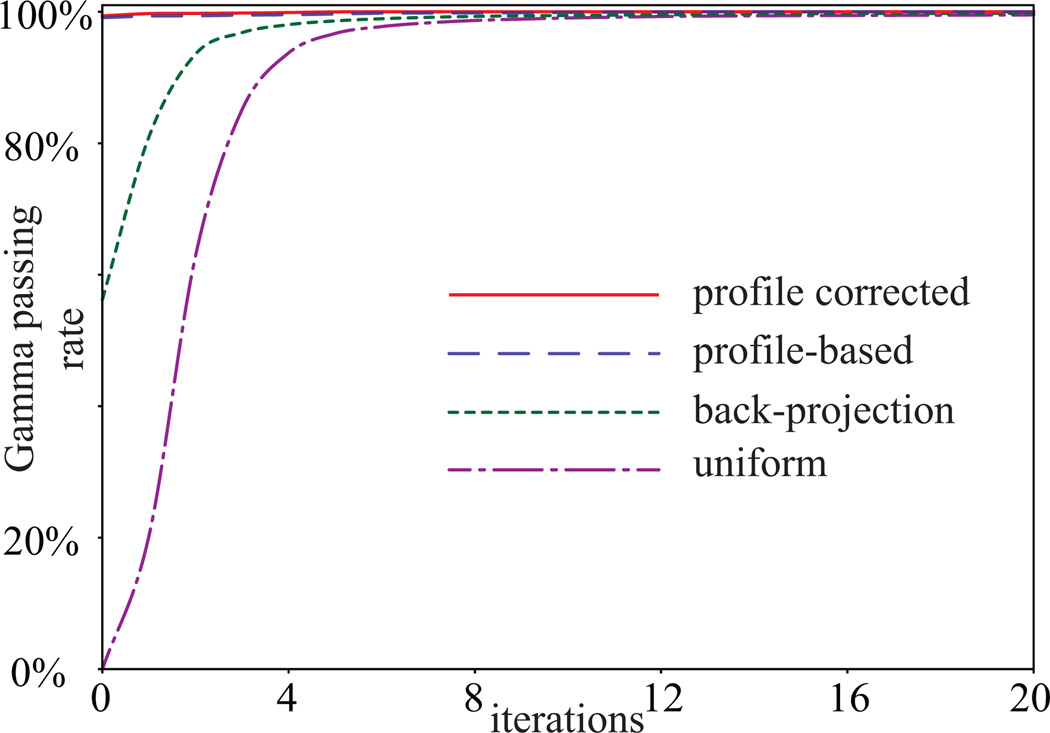
Due to the artefacts created by refraction and lens perspective, the first 14 mm of the light distribution was omitted from the gamma analysis. Figure 6 shows the reconstruction gamma passing rate (3%/3 mm local) of the 3D reconstructed light distribution as a function of number of iterations. The reconstruction gamma passing rate of the reconstructed distribution using profile-based f(0) with RC was the highest among all f(0) in each iteration. Both profile-based f(0) led to 100% passing rate after 20 iterations. The passing rates of the reconstruction after 20 iterations were 99.6% using the uniform background f(0) and 99.8% using the back-projection f(0). Studying the convergence of the reconstructions and their reconstruction gamma passing rates, we established a convergence condition to break the loop of MAP reconstruction: If the root mean square difference between the light output distributions in the current iteration and the previous iteration is less than 0.5%, the loop will break. Under this convergence condition, the number of iterations for both the single beam model and the prostate treatment model is shown in table I.
Figure 6.
Gamma passing rate (3%/3 mm local) of the 3D reconstructed light output distributions using different initial estimates (uniform background, back-projection, profile-based without correction factor, and profile-based with correction factor) as a function of iterations.
Table I.
Number of iterations of the 3D reconstructions
| No. of iterations | ||||
|---|---|---|---|---|
| Beam model | Uniform background | Back-projection | Profile-based without correction |
Profile-based with correction |
| Single beam | 19 | 13 | 9 | 6 |
| Prostate plan | 17 | 12 | 6 | 5 |
Tables II and III show the gamma passing rates of the reconstructed light output distribution of the single beam model and the prostate treatment model respectively. In addition to the standard 3%/3 mm local requirement, 2%/2 mm local and 1%/1 mm local requirements were also assessed and included in the tables. Among all four methods, the profile-based f(0) with RC produced the best performances, with the fewest iterations to convergence and highest corresponding reconstruction gamma passing rate. The performances followed the same trend for the prostate treatment model.
Table II.
Gamma passing rates of the 3D reconstructions of the single beam model
| Reconstruction Γ | ||||
|---|---|---|---|---|
| Gamma requirement |
Uniform background | Back-projection | Profile-based without correction |
Profile-based with correction |
| 3%/3 mm | 99.5% | 99.6% | 99.9% | 100.0% |
| 2%/2 mm | 99.3% | 99.4% | 99.8% | 99.9% |
| 1%/1 mm | 98.3% | 97.8% | 99.1% | 99.6% |
Table III.
Gamma passing rates of the 3D reconstructions of the prostate plan
| Reconstruction Γ | ||||
|---|---|---|---|---|
| Gamma requirement |
Uniform background | Back-projection | Profile-based without correction |
Profile-based with correction |
| 3%/3 mm | 96.9% | 97.5% | 99.4% | 99.8% |
| 2%/2 mm | 93.8% | 94.9% | 98.5% | 99.1% |
| 1%/1 mm | 78.9% | 81.1% | 92.7% | 94.8% |
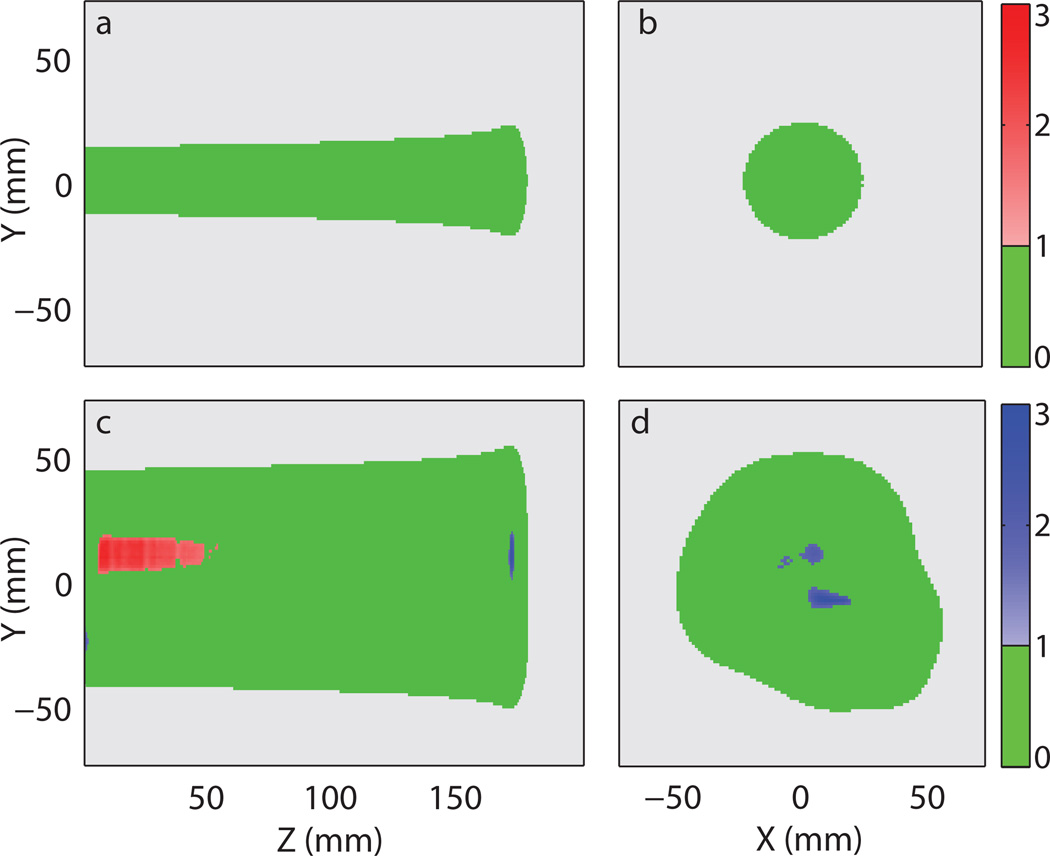
Figure 7 shows the reconstruction gamma maps (3%/3 mm local) of the reconstructed light distributions using the profile-based method with RC. For the single beam model, nearly all voxels passed the gamma requirement. For the prostate plan, several isolated regions close to the axial center of the treatment failed the gamma requirement. There were some regions with overestimated light output near the proton beams entrance. These regions were generally low light output regions surrounded by relatively higher light output regions. Around the Bragg peak, there were some voxels with underestimated light output. These voxels were also surrounded by regions with relatively higher light output.
Figure 7.
Reconstruction gamma maps (3%/3 mm local) of the reconstructed light distributions using the profile-based method with correction factor. (a) 2D gamma maps of the single beam model at x = 0 mm and (b) around the Bragg peak at z = 172 mm. (c) 2D gamma maps of the prostate treatment model at x = 6 mm and (d) around the Bragg peak at z = 172 mm. The following colour scheme was used: Green - passing gamma requirement, light grey – low output region below threshold, red – failing gamma requirement with positive difference in light output, and blue – failing gamma requirement with negative difference in light output. The values represented by the colour bars on the right are the gamma values.
3.2.Error Detection
We created two scenarios where the deliveries were different from the prescribed plan. The gamma passing rates (3%/3 mm local) of the reconstructed light output volumes obtained from the erroneous deliveries are shown in table IV. The number of iterations for the reconstruction was identical to that shown in table I. The baseline plan error Γ is the gamma passing rate that the erroneous plan should produce. In both scenarios, reconstruction using the profile-based f(0) with RC yielded gamma passing rate within 1% of the baseline plan error Γ. All other initial estimates resulted in gamma passing rate more than 1% different from the baseline plan error Γ in either or both scenarios. Because there were some inherent errors in the reconstructed volumes due to reconstruction artefacts, it is interesting to see the change in gamma passing rate due to the introduced errors. Table V shows the differences in gamma passing rate (3%/3 mm local) between the erroneous plan and the original plan using the respective initial estimates (ie. values from table IV subtracted values from table III: 3%/3 mm). Both profile-based methods yielded differences that were within 1% of the baseline difference in both scenarios.
Table IV.
Gamma passing rate of the 3D reconstructions of the erroneous prostate plan
| Plan error Γ | |||||
|---|---|---|---|---|---|
| Error model | Baseline plan error Γ |
Uniform background |
Back-projection | Profile-based without correction |
Profile-based with correction |
| 2× intensity | 97.1% | 94.4% | 94.4% | 95.6% | 96.1% |
| Shifted iso | 96.6% | 90.9% | 92.9% | 96.9% | 97.5% |
iso – isocenter
Table V.
Difference in gamma passing rate between the erroneous and the correct treatment plans
| Gamma difference | |||||
|---|---|---|---|---|---|
| Error model | Baseline difference |
Uniform background |
Back-projection | Profile-based without correction |
Profile-based with correction |
| 2× intensity | −2.9% | −2.5% | −3.2% | −3.8% | −3.7% |
| Shifted iso | −3.4% | −6.0% | −4.6% | −2.5% | −2.3% |
iso – isocenter
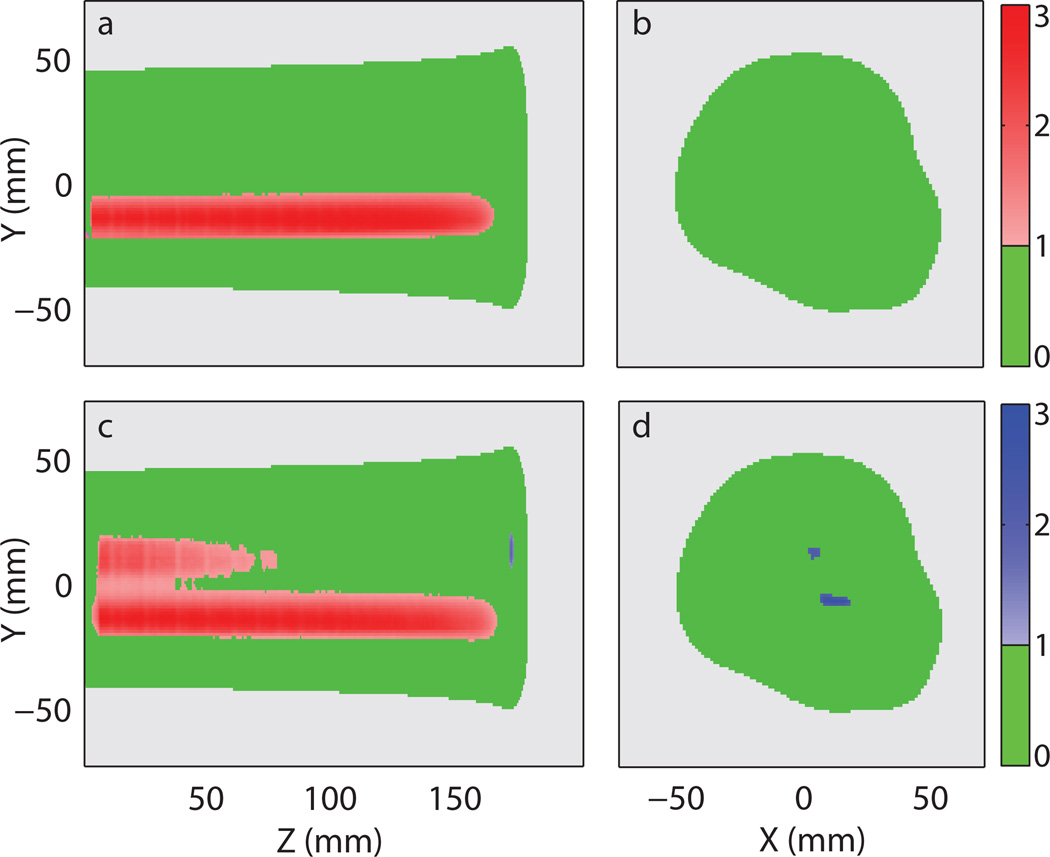
Figure 8 shows the plan error gamma maps (3%/3 mm local) of the light output distribution in the scenario where one of the beamlet intensity was doubled. The beamlet with increased intensity can be spotted clearly in figure 8a, where the plan error gamma maps of the erroneous delivery were shown. Doubling the intensity caused the related voxels to fail in gamma analysis with positive light output difference. Similar light output difference at a similar location can be seen in the gamma maps of the reconstructed light distribution as shown in figure 8c. It is interesting to see that the reconstruction artefacts seen in figure 7c and d are also present in figure 8c and d at similar locations.
Figure 8.
Plan error gamma maps (3%/3 mm local) of the light distribution from the prostate treatment plan with the intensity of one proton beam twice its prescribed value. (a) 2D gamma maps of the erroneous delivery at x = 6 mm and (b) around the Bragg peak at z = 172 mm. (c) 2D gamma maps of the reconstructed light distribution using the profile-based method with correction factor at x = 6 mm and (d) around the Bragg peak at z = 172 mm. The following colour scheme was used: Green - passing gamma requirement, light grey – low output region below threshold, red – failing gamma requirement with positive difference in light output, and blue – failing gamma requirement with negative difference in light output. The values represented by the colour bars on the right are the gamma values.
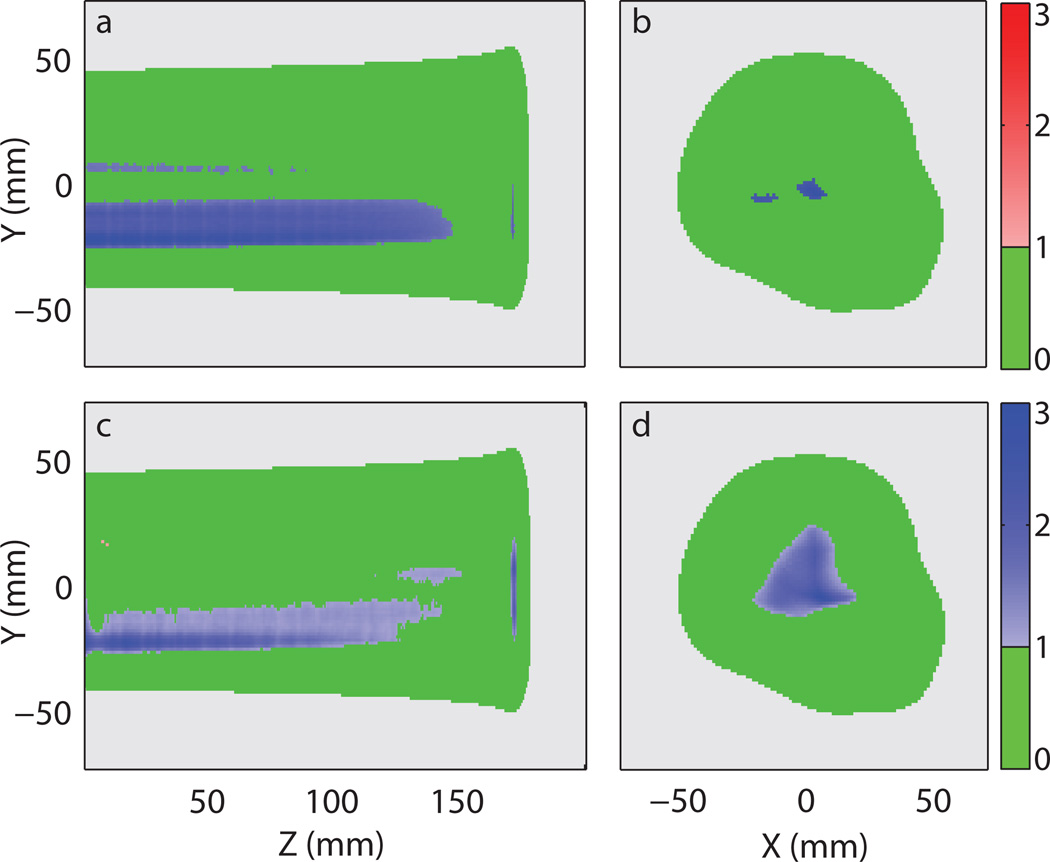
Shifting of the isocenter also resulted in a decreased gamma passing rate (3%/3 mm local). In this particular case, the light output in most failing voxels was lower than the prescribed value as shown in figure 9a and b. The plan error gamma map computed with the reconstructed light distribution yielded a similar error pattern as shown in figure 9c and d. Since the shift caused an overall decrease in light output in the failing regions, it cancelled out some of the reconstruction artefacts of overestimation when comparing figure 7c with 9c. This resulted in a higher gamma passing rate than the baseline plan error Γ.
Figure 9.
Plan error gamma maps (3%/3 mm local) of the light distribution from the prostate treatment plan with the isocenter shifted by 1 mm in x and 1 mm in y. (a) 2D gamma maps of the erroneous delivery at x = 6 mm and (b) around the Bragg peak at z = 172 mm. (c) 2D gamma maps of the reconstructed light distribution using the profile-based method with correction factor at x = 6 mm and (d) around the Bragg peak at z = 172 mm. The following colour scheme was used: Green - passing gamma requirement, light grey – low output region below threshold, red – failing gamma requirement with positive difference in light output, and blue – failing gamma requirement with negative difference in light output. The values represented by the colour bars on the right are the gamma values.
4. Discussion
Owing to the cubic geometry of our liquid scintillator, it is only practical to obtain data from three viewing angles. However, the limited viewing angles cannot satisfy the Nyquist criterion, and thus the resulting 3D reconstruction can include artefacts. Therefore, we performed this simulation study to investigate the performance of iterative reconstruction of the scintillation light distribution using our scintillator system. To improve the quality of the reconstructed light distribution, we also developed the profile-based method to generate an initial light output estimate for the iterative reconstruction. Our simulation results showed that when using the proposed profile-based initial estimate with RC, the reconstructed light distribution appeared to be very similar to the actual light output distribution. For a single proton beam, the corresponding gamma passing rate (3%/3 mm local) of the reconstructed volume reached 100.0% after 6 iterations. The gamma passing rate (3%/3 mm local) of the reconstructed prostate plan was 99.8% after 5 iterations. This indicates that with the proposed profile-based method, our unique scintillator system can reconstruct 3D light output volumes that agree well with the actual volumes.
We believe that the profile-based method is applicable to heavy charged particle beams because the energy is predominately deposited near the beam path. The correction factor computed in (5) is based on empirical observation. And as we found in this study, the correction factor provided a more accurate initial estimate and resulted in a better final reconstruction outcome. This observation was consistent across multiple criteria, including the depth profile, number of iterations to convergence, and final reconstruction gamma passing rate. In the single beam model, we found that the greatest differences between the reconstructed volume and the actual distribution were located at the entrance and the Bragg peak, where the differences between the initial estimate and actual distribution were greatest. For the prostate plan, the scintillation light distribution was relatively complex, and some reconstruction artefacts arose due to the very limited projection angles in our proposed system. However, even with this limitation, only 0.2% of voxels failed the gamma requirement (3%/3 mm local). Most of the failed regions were low-light output regions near the entrance, and only small regions of failed voxels were observed near the Bragg peak.
In this study, we utilized the standard 3%/3 mm requirement for the gamma analysis, and the local normalization method was employed instead of the standard global normalization method. However, as shown in tables II and III, the gamma passing rate was above 99% for both models using the 2%/2 mm requirement. This shows that the proposed method has the potential to meet the more stringent gamma threshold that may be necessary for proton treatment plans. However, the proposed method may not be sufficient for gamma analysis with a 1%/1 mm requirement as the corresponding gamma passing rate was only 94.8% for the reconstructed prostate plan.
One of the main goals of developing the 3D liquid scintillator detector is to implement it as a QA device for individual treatment plans. The QA system would involve delivering the treatment plan to the liquid scintillator. Gamma analysis would then be performed to compare the reconstructed light output distribution and the planned light output distribution on a per field basis. Errors could be detected by assessing the gamma passing rate and investigating the gamma maps. In this study, we have shown that our proposed system in principal was able to detect the error in two different scenarios. Using the profile-based f(0) with RC, the plan error gamma passing rate of the reconstructed volume decreased to a level similar to the baseline plan error Γ. Further investigation of the plan error gamma map of the reconstructed volume also showed patterns similar to those observed in the baseline plan error gamma map.
As shown in figure 8c, the reconstruction artefact present in figure 7c also appeared as failing regions on the plan error gamma map. However, it is relatively easy to distinguish the artefact from the actual error. In these two scenarios, the failing regions all spanned nearly the entire proton beam range, while none of the reconstruction artefact spanned more than half of the proton beam range. Moreover, in a multi-field treatment plan, it would be unnecessary to include the entrance regions in the gamma analysis due to the lower dose relative to the whole treatment plan. Since most of the regions suffering from reconstruction artefacts were near the entrance, they would have little impact to the final QA procedure.
The projection matrix in this simulation study is used to create the camera data as well as to reconstruct the 3D volume. In other words, the projection matrices used are perfect and the errors in this study are a result of the added noise and the limitation of the 3D reconstruction. In an actual study, we anticipate additional error with the calculated projection matrix and thus an increase in the final error with the 3D reconstruction. However, with careful calibration, we expect the error of the calculated projection matrix to be reasonably small.
This is the first study we have performed to investigate the feasibility of reconstructing 3D volume with only three viewing angles. Therefore, we chose to use only the more basic proton beam models with the same energy. There is also a practical basis in the decision to reconstruct a single beam energy at a time. While the scanning proton beam at our facility moves rapidly in the lateral direction, there is a 2 s pause during the change in beam energies. Thus it is convenient to image one energy layer at a time. Another reason for this approach is that the initial estimate correction factor RC is most effective for mono-energetic proton beams. In the future, we will study reconstruction of scintillation light distributions with multiple beam energies.
5. Conclusions
In this study, we proved the feasibility of obtaining the 3D scintillation light output distribution using our proposed scintillator system with three CCD cameras. In addition, we demonstrated the ability of our proposed profile-based method to produce 3D volume reconstructions with improved accuracy and fewer iterations than conventional methods. We also showed that our proposed system could successfully detect errors in a treatment plan. The proposed system has the potential to enable efficient, high-resolution 3D QA of clinical proton beams.
Acknowledgments
We acknowledge Dr. Richard E. Wendt, III, and William D. Erwin for their constructive advice on 3D reconstruction techniques. We would also like to thank Justin Mikell and Jared Ohrt for their suggestions on computing the 3D gamma analysis.
References
- Archambault L, Poenisch F, Sahoo N, Robertson D, Lee A, Gillin MT, Mohan R, Beddar S. Verification of proton range, position, and intensity in IMPT with a 3D liquid scintillator detector system. Medical Physics. 2012;39:1239–1246. doi: 10.1118/1.3681948. [DOI] [PMC free article] [PubMed] [Google Scholar]
- Arjomandy B, Sahoo N, Ciangaru G, Zhu R, Song X, Gillin M. Verification of patient-specific dose distributions in proton therapy using a commercial two-dimensional ion chamber array. Medical Physics. 2010;37:5831–5837. doi: 10.1118/1.3505011. [DOI] [PubMed] [Google Scholar]
- Beddar S, Archambault L, Sahoo N, Poenisch F, Chen GT, Gillin MT, Mohan R. Exploration of the potential of liquid scintillators for real-time 3D dosimetry of intensity modulated proton beams. Medical Physics. 2009;36:1736–1743. doi: 10.1118/1.3117583. [DOI] [PMC free article] [PubMed] [Google Scholar]
- Boon SN, van Luijk P, Schippers JM, Meertens H, Denis JM, Vynckier S, Medin J, Grusell E. Fast 2D phantom dosimetry for scanning proton beams. Medical Physics. 1998;25:464–475. doi: 10.1118/1.598221. [DOI] [PubMed] [Google Scholar]
- Bruyant PP. Analytic and Iterative Reconstruction Algorithms in SPECT. Journal of Nuclear Medicine. 2002;43:1343–1358. [PubMed] [Google Scholar]
- Cirio R, Garelli E, Schulte R, Amerio S, Boriano A, Bourhaleb F, Coutrakon G, Donetti M, Giordanengo S, Koss P, Madon E, Marchetto F, Nastasi U, Peroni C, Santuari D, Sardo A, Scielzo G, Stasi M, Trevisiol E. Two-dimensional and quasi-three-dimensional dosimetry of hadron and photon beams with the Magic Cube and the Pixel Ionization Chamber. Physics in Medicine and Biology. 2004;49:3713. doi: 10.1088/0031-9155/49/16/017. [DOI] [PubMed] [Google Scholar]
- De Pierro AR, Yamagishi MEB. Fast EM-like methods for maximum "a posteriori" estimates in emission tomography. Medical Imaging, IEEE Transactions on. 2001;20:280–288. doi: 10.1109/42.921477. [DOI] [PubMed] [Google Scholar]
- Dhanesar S, Sahoo N, Kerr M, Taylor MB, Summers P, Zhu XR, Poenisch F, Gillin M. Quality assurance of proton beams using a multilayer ionization chamber system. Medical Physics. 2013;40:092102-1–092102-9. doi: 10.1118/1.4817481. [DOI] [PubMed] [Google Scholar]
- Garreau M, Coatrieux JL, Collorec R, Chardenon C. A knowledge-based approach for 3-D reconstruction and labeling of vascular networks from biplane angiographic projections. Medical Imaging, IEEE Transactions on. 1991;10:122–131. doi: 10.1109/42.79469. [DOI] [PubMed] [Google Scholar]
- Guo P, Adamovics J, Oldham M. A practical three-dimensional dosimetry system for radiation therapy. Medical Physics. 2006;33:3962–3972. doi: 10.1118/1.2349686. [DOI] [PMC free article] [PubMed] [Google Scholar]
- Hebert T, Leahy R. A generalized EM algorithm for 3-D Bayesian reconstruction from Poisson data using Gibbs priors. Medical Imaging, IEEE Transactions on. 1989;8:194–202. doi: 10.1109/42.24868. [DOI] [PubMed] [Google Scholar]
- ICRU. Prescribing, recording, and reporting proton-beam therapy, report 78. Journal of the ICRU. 2007;7:1–210. [Google Scholar]
- Johansson SÅ, Magnusson P, Fransson A, Olsson LE, Christoffersson J-O, Montelius A, Mattsson S. Dosimeter gel and MR imaging for verification of calculated dose distributions in clinical radiation therapy. Acta Oncologica. 1997;36:283–290. doi: 10.3109/02841869709001264. [DOI] [PubMed] [Google Scholar]
- Karger CP, Jäkel O, Hartmann GH, Heeg P. A system for three-dimensional dosimetric verification of treatment plans in intensity-modulated radiotherapy with heavy ions. Medical Physics. 1999;26:2125–2132. doi: 10.1118/1.598728. [DOI] [PubMed] [Google Scholar]
- Karger CP, Jäkel O, Palmans H, Kanai T. Dosimetry for ion beam radiotherapy. Physics in Medicine and Biology. 2010;55:R193. doi: 10.1088/0031-9155/55/21/R01. [DOI] [PubMed] [Google Scholar]
- Kirov AS, Piao JZ, Mathur NK, Miller TR, Devic S, Trichter S, Zaider M, Soares CG, LoSasso T. The three-dimensional scintillation dosimetry method: test for a 106 Ru eye plaque applicator. Physics in Medicine and Biology. 2005;50:3063. doi: 10.1088/0031-9155/50/13/007. [DOI] [PubMed] [Google Scholar]
- Kirov AS, Shrinivas S, Hurlbut C, Dempsey JF, Binns WR, Poblete JL. New water equivalent liquid scintillation solutions for 3D dosimetry. Medical Physics. 2000;27:1156–1164. doi: 10.1118/1.598993. [DOI] [PubMed] [Google Scholar]
- Nohtomi A, Sakae T, Terunuma T, Tsunashima Y, Hosono K, Hayakawa Y. Measurement of depth-dose distribution of protons by an imaging plate. Nuclear Instruments and Methods in Physics Research Section A: Accelerators, Spectrometers, Detectors and Associated Equipment. 2003;511:382–387. [Google Scholar]
- Pellot C, Herment A, Sigelle M, Horain P, Maitre H, Peronneau P. A 3D reconstruction of vascular structures from two X-ray angiograms using an adapted simulated annealing algorithm. Medical Imaging, IEEE Transactions on. 1994;13:48–60. doi: 10.1109/42.276144. [DOI] [PubMed] [Google Scholar]
- Ponisch F, Archambault L, Briere TM, Sahoo N, Mohan R, Beddar S, Gillin MT. Liquid scintillator for 2D dosimetry for high-energy photon beams. Medical Physics. 2009;36:1478–1485. doi: 10.1118/1.3106390. [DOI] [PMC free article] [PubMed] [Google Scholar]
- Robertson D, Hui C, Archambault L, Mohan R, Beddar S. Optical artefact characterization and correction in volumetric scintillation dosimetry. Physics in Medicine and Biology. 2014;59:23. doi: 10.1088/0031-9155/59/1/23. [DOI] [PMC free article] [PubMed] [Google Scholar]
- Robertson D, Mirkovic D, Sahoo N, Beddar S. Quenching correction for volumetric scintillation dosimetry of proton beams. Physics in Medicine and Biology. 2013;58:261. doi: 10.1088/0031-9155/58/2/261. [DOI] [PMC free article] [PubMed] [Google Scholar]
- Rudin LI, Osher S, Fatemi E. Nonlinear total variation based noise removal algorithms. Physica D: Nonlinear Phenomena. 1992;60:259–268. [Google Scholar]
- Sawakuchi GO, Mirkovic D, Perles LA, Sahoo N, Zhu XR, Ciangaru G, Suzuki K, Gillin MT, Mohan R, Titt U. An MCNPX Monte Carlo model of a discrete spot scanning proton beam therapy nozzle. Medical Physics. 2010;37:4960–4970. doi: 10.1118/1.3476458. [DOI] [PMC free article] [PubMed] [Google Scholar]
- Wendling M, Zijp LJ, McDermott LN, Smit EJ, Sonke J-J, Mijnheer BJ, van Herk M. A fast algorithm for gamma evaluation in 3D. Medical Physics. 2007;34:1647–1654. doi: 10.1118/1.2721657. [DOI] [PubMed] [Google Scholar]
- Zeidan OA, Sriprisan SI, Lopatiuk-Tirpak O, Kupelian PA, Meeks SL, Hsi WC, Li Z, Palta JR, Maryanski MJ. Dosimetric evaluation of a novel polymer gel dosimeter for proton therapy. Medical Physics. 2010;37:2145–2152. doi: 10.1118/1.3388869. [DOI] [PubMed] [Google Scholar]
- Zhao L, Newton J, Oldham M, Das IJ, Cheng C-W, Adamovics J. Feasibility of using PRESAGE® for relative 3D dosimetry of small proton fields. Physics in Medicine and Biology. 2012;57:N431. doi: 10.1088/0031-9155/57/22/N431. [DOI] [PMC free article] [PubMed] [Google Scholar]


