

Abstract
Although several novel approaches for hippocampal subregion delineation have been developed, they need to be applied prospectively and may be limited by long scan times, the use of high field (> 3T) imaging systems, and limited reliability metrics. Moreover, the majority of MR imaging data collected to date has employed a T1-weighted acquisition, creating a critical need for an approach that provides reliable hippocampal subregion segmentation using such a contrast. We present a highly reliable approach for the identification of 6 subregions comprising the hippocampal formation from MR images including the subiculum, dentate gyrus / cornu Ammonis 4 (DG/CA 4), entorhinal cortex, fimbria, and anterior and posterior segments of cornu Ammonis 1-3 (CA 1-3). MR images were obtained in the coronal plane using a standard 3D spoiled gradient sequence acquired on a GE 3T scanner through the whole head in approximately 10 minutes. The average ICC for inter-rater reliability across right and left volumetric regions-of-interest was .85 (range = .71 to .98; median = .86) and the average ICC for intra-rater reliability was .92 (range = .66 to .99; median = .97). The mean Dice index for inter-rater reliability across right and left hemisphere subregions was .75 (range = .70 to .81; median = .75) and the mean Dice index for intra-rater reliability was .85 (range = .82 to .90; median = .85). An investigation of hippocampal asymmetry revealed significantly greater right compared to left hemisphere volumes in the anterior segment of CA 1-3 and in the subiculum.
Keywords: magnetic resonance imaging, hippocampus, subregion, 3 Tesla, delineation criteria
Introduction
There is considerable evidence that the hippocampal formation plays a critical role in the pathophysiology of neurologic conditions such as Alzheimer's Disease (Mielke et al., 2012; Whitwell et al., 2012) and psychiatric disorders such as schizophrenia (Szeszko et al., 2003; Szeszko et al., 2002; Zierhut et al., 2013; Zierhut et al., 2013b; Tamminga, Stan, & Wagner, 2010). The majority of work investigating the hippocampal formation in these and other disorders using magnetic resonance (MR) imaging has employed a T1-weighted contrast and used gross anatomic measures comprising all cornu Ammonis (CA) subfields, the dentate gyrus, the subiculum, and the entorhinal cortex. It is known, however, that the subregions comprising the hippocampal formation have different afferent and efferent connections with unique functional significance (Guzowski, Knierim, & Moser, 2004; Amaral & Lavenex, 2007). Thus, increased interest in discerning the internal architecture of the hippocampal formation to address questions regarding neurobiology has led to numerous approaches for the identification of subregions using MR imaging. For example, prior work in aging (La Joie et al., 2010; Burger, 2010), Alzheimer's Disease (Mueller et al., 2010; Mueller et al., 2007; Mueller & Weiner, 2009), schizophrenia (Zierhut et al., 2013; Zierhut et al., 2013b; Harrison & Eastwood, 2001), insomnia (Neylan et al., 2010), multiple sclerosis (Gold et al., 2010; Sicotte et al., 2008), post-traumatic stress disorder (Wang et al., 2010), temporal lobe epilepsy (Mueller et al., 2009), and normative populations (Malykhin, Lebel, Coupland, Wilman, & Carter, 2010b) has provided evidence for differential involvement of specific subregions in the neurobiology of these disorders and their associated functions.
Several prior approaches for hippocampal subregion delineation have limited their method to the identification of subregions (e.g. CA 1, dentate gyrus) within the body of the hippocampus where their arrangement is most clearly identified and homogeneous (Mueller et al., 2009; Mueller et al., 2010; Mueller & Weiner, 2009; Wang et al., 2010). Similarly, other investigators have divided the hippocampus into the head, body, and tail (Malykhin, Carter, Seres, & Coupland, 2010; Narr et al., 2004; Witthaus et al., 2010) to facilitate measurements. Researchers have also attempted to “unfold” the hippocampus, or translate the 3-dimensional positioning of its subregions into two-dimensional space (Donix et al., 2010; Ekstrom et al., 2009). Moreover, an additional method involves the use of surface shape analysis by projecting post-mortem atlases onto 3-dimensional renderings of the whole hippocampus (Boccardi et al., 2010; Cole et al., 2010; Frisoni et al., 2008, Xie et al., 2009). Although this approach can be useful, it is limited to subregions located on the external surface of the hippocampal formation. For example, the shape of CA 4 and the dentate gyrus (DG) cannot be fully resolved due to their more medial location. Moreover, we are unaware of any approach for hippocampal subregion segmentation using a T1-weighted contrast which can be applied retrospectively to large datasets (e.g., ADNI; Apostolova et al., 2009; Carmichael et al., 2012).
Due to its complex three dimensional shape, the orientation of the hippocampal formation varies significantly along the rostrocaudal axis. Recent reviews suggest that the hippocampus can be divided along its long axis (Fanselow & Dong, 2010) consistent with evidence from proton MR spectroscopy (King et al., 2008) and functional MR (Demaster & Ghetti, 2013) imaging studies. Posterior and anterior hippocampal regions have a unique pattern of connectivity and have been linked to different functions (Poppenk, Evensmoen, Moscovitch, & Nadel, 2013; Nadel, Hoscheidt, & Ryan, 2013) that may be of relevance to neuropsychiatric disorders such as schizophrenia (Szeszko et al., 2002). In our prior work (e.g., Szeszko et al., 2003; Szeszko et al., 2006; Wellington, Bilder, Napolitano, & Szeszko, 2013) we divided the hippocampus into anterior and posterior segments based on functional magnetic resonance imaging data demonstrating a dissociation in functions for the posterior and anterior parts of the hippocampus with regard to familiarity of stimuli (Strange, Fletcher, Henson, Friston, & Dolan, 1999; Strange & Dolan, 2001). Animal studies suggest that the ventral (corresponding to the anterior hippocampus in humans) or rostral hippocampus has strong connections with prefrontal regions (Barbas & Blatt, 1995; Carr & Sesack, 1996) and may be involved in context coding (Nadel et al., 2013; Rajah, Kromas, Han, & Pruessner, 2010). In contrast, other data indicate that the dorsal hippocampus (corresponding to the posterior hippocampus in humans) plays a role in spatial behavior (Nadel et al., 2013), thus supporting the idea that this region of the hippocampus is part of a functional network connected to sensory cortical areas including the parietal cortex (Save & Poucet, 2000; Guazzelli, Bota, & Arbib, 2001). Although a distinction in the hippocampal rostrocaudal axis has been made in MR imaging studies at the gross anatomic level, to our knowledge it has not been fully incorporated into the delineation of a specific hippocampal subregion.
In the majority of prior post-mortem studies hippocampal subregions have typically been distinguished from each other using vascularization patterns and cellular features (Duvernoy, 1988). Moreover, a recent study demonstrates the feasibility of labeling hippocampal subfields using a high resolution MR imaging dataset based directly on microscopic features extracted from histology (Adler et al., 2014). These cytoarchitectural identifiers are extremely difficult to detect using in-vivo imaging, although various arguments have been made for the visibility of certain cellular layers and substructures at very high (> 3T) field strengths (Kerchner et al., 2010; Thomas et al., 2008; Wieshmann et al., 1999; Theysohn et al., 2009). A limitation with such approaches, however, is that these magnets are not typically available outside of clinical academic research facilities. At lower (< 7T) field strengths, investigators have relied predominantly on anatomical landmarks and post-mortem atlases rather than cytoarchitectural features to identify hippocampal subregions on MR images (e.g., Gold et al., 2010; La Joie et al., 2010; Malykhin et al., 2010; Sicotte et al., 2008). To date several approaches have been developed for the investigation of hippocampal subregions, and groups are actively collaborating to sort through specific issues plaguing mensuration protocols (see www.hippocampalsubfields.com).
Approaches have used manual techniques (Mueller et al., 2007; Malykhin et al., 2010b; La Joie et al., 2010), automated techniques (Van Leemput et al., 2009; Bonnici et al., 2012; Pipitone et al., in press), or a combination of these two approaches (Yushkevich et al., 2010). Although automated and semi-automated processes for hippocampal subregion delineation have been demonstrated to be highly valuable given their potential to accommodate high throughput, manual mensuration remains the gold standard to which these other methods are compared. Several approaches for the identification of hippocampal subregions may be constrained by the investigation of subregions within only a limited part of the hippocampus, long scan times that are not typically clinically feasible, and the use of very high field (> 3T) MR imaging systems that are unavailable outside of research centers (Table 1). Moreover, a critical issue across many studies concerns the consistent lack of inter-rater reliability assessments and/or the investigation of intra-rater reliability within only a limited part of the hippocampal formation that may not be applicable to other areas.
Table 1. High field in-vivo studies investigating hippocampal subregions.
| Study | Field Strength | Scan Duration | Subregions | Intra-rater Reliability | Inter-rater Reliability | Entire Structure included in Reliability Assessment? |
|---|---|---|---|---|---|---|
| La Joie et al., 2010 | 3.0 T | 9.7 min | CA1 DG/CA2-4 Subiculum |
ICC range: .89-.96 | None | Yes |
| Malykhin et al., 2010 | 4.7 T | 13.5 min | CA1-3 DG Subiculum |
ICC range: .95-.96 | None | Yes |
| Mueller et al., 2007a | 4.0 T | 5.3 min | CA1 CA2 DG/CA3-4 EC Subiculum |
ICC range: .66-.99 | ICC range: .39-.93 | No |
| Van Leemput et al., 2009b | 3.0 T | 36.5 min | CA1 CA2-3 DG/CA4 Fimbria H. Fissure Presub Subiculum |
DI mean: .79 | None | No |
| Winterburn et al., 2013 | 3.0 T | 20 min | CA1 CA2-3 DG/CA4 Subiculum SR/SL/SM |
DIc mean: .74 | None | Yes |
| Current Protocol | 3.0 T | 10 min 25 sec |
Ant CA1-3 Pos CA1-3 DG/CA4 EC Fimbria Subiculum |
DI mean: .85 ICC range: .71-.99 |
DI mean: .75 ICC range: .66-.99 |
Yes |
Note. Ant = anterior; CA = cornu Ammonis; DI = Dice index; DG = dentate gyrus; EC = entorhinal cortex; H. Fissure = hippocampal fissure; ICC = intra-class correlation coefficient; Pos = posterior; Presub = presubiculum; SR/SL/SM = stratum radiatum/stratum lacunosum/stratum moleculare.
T2 – weighted field echo.
Van Leemput et al. (2009) created delineation criteria for 10 subregions, but only reported reliability statistics for seven.
Winterburn et al. (2013) utilized a Dice Kappa and the statistic reported here is based on their calculations regarding manual tracings.
The primary goal of this study was to develop a methodology for hippocampal subregion segmentation that can be generalized to other magnetic resonance (MR) images acquired at a 3T using a T1-weighted contrast. Although other superior in-vivo approaches have been developed for hippocampal subregion and subfield delineation, they are not based on a T1-weighted contrast and need to be acquired prospectively. We also sought to develop strategies for dealing with issues germane to other approaches, such as those described by Konrad and colleagues (2009). We based our delineation criteria largely on post-mortem atlases (Duvernoy, 1988; Harding, Halliday, & Kril, 1998; Yushkevich et al., 2009) and prior published work (Malykhin et al., 2010b; Mueller et al., 2007; Van Leemput et al., 2009; Yushkevich et al., 2010). We also relied on anatomical rather than cytoarchitectural features to facilitate the implementation of these criteria on MR images where such features would be more evident. We tested the feasibility of our approach by computing intra-rater reliability, inter-rater reliability, and examining Dice indices for right and left hippocampal regions-of-interest. We subsequently present a range of volumetric data in 10 healthy volunteers and investigate hippocampal asymmetry within our regions-of-interest.
Method
Subjects
Initial training involved extensive discussion of the relevant anatomy and repeated mensuration of hippocampal subregions between two operators to develop the delineation criteria. Reliability assessments were then examined for five (3M/2F) individuals not previously viewed or discussed by the two operators. Following this reliability assessment a single operator (KR) conducted volumetric measurements in 10 (5M/5F) healthy volunteers with a mean (SD) age of 22.8 (7.5) years recruited from advertisements in local newspapers and word of mouth. None of the healthy volunteers reported a history of any Axis I psychiatric disorder as determined using the Structured Clinical Interview for DSM-IV-TR Axis I Disorders – Non-Patient Edition (First, Spitzer, Gibbon, & Williams, 2001). Additional exclusion criteria included: (1) having a serious medical condition known to affect the brain; (2) contraindications to MR imaging; and (3) pregnancy. All procedures were approved by the North Shore – Long Island Jewish Medical Center Institutional Review Board. Written informed consent was obtained from all study participants. For individuals under the age of 18, written informed consent was obtained from a parent and written assent was provided by the individual.
Handedness
The handedness of the 10 healthy volunteers was determined using a modified 20-item version of the Edinburgh Inventory. General scores for right-handedness and left-handedness were calculated utilizing the relevant items. A laterality quotient was then derived with the following formula: (Total R – Total L)/(Total R + Total L). This quotient therefore ranged from +1.00 (totally right-handed) to -1.00 (totally left-handed). Using these criteria healthy volunteers had a mean laterality quotient of .87 (SD = .11).
MR Imaging Methods
MR images were acquired in the coronal plane using a 3D spoiled gradient (SPGR) sequence (TR = 7.5 ms, TE = 3 ms, matrix = 256 × 256, FOV = 240 mm) on a single 3T scanner (GE Signa HDx; General Electric, Milwaukee, Wisconsin), producing 216 contiguous images (slice thickness = 1 mm) through the whole head in 10 minutes and 25 seconds with in-plane resolution of .94 mm × .94 mm. All scans were reviewed by a radiologist and a member of the research team and none were determined to have any significant abnormalities. All scans were subsequently aligned along the anterior and posterior commissures using previously published software (Ardekani & Bachman, 2009) and resampled into a 512 × 512 matrix yielding voxel dimensions of .47mm × .47mm × 1mm. Volumetric measurements were conducted using ITK-SNAP (Yushkevich et al., 2006). Delineation of the subregions was conducted in the coronal plane using the image contrast while simultaneously examining the MR images using triplanar view. Tracings began on the most posterior slice of the hippocampus and progressed anteriorly. The delineation of each hippocampus was monitored from the coronal and sagittal perspectives. All tracings were reviewed as a 3D reconstruction, but this process did not substantively contribute to the identification of subregions.
Hippocampal Subregion Delineation Criteria
In this study we developed a reliable approach for the identification of 6 regions comprising the hippocampal formation from MR images including the subiculum, dentate gyrus / cornu Ammonis 4 (DG / CA 4), entorhinal cortex, fimbria, and anterior and posterior segments of cornu Ammonis 1-3 (CA 1-3). It is acknowledged that the terminology used to define the hippocampus and its constituent parts is critical to the field and there is extensive controversy regarding which regions should be considered part of the hippocampus. For the purpose of this study we considered the hippocampus proper to comprise CA 1-3 and DG / CA 4. These subregions, along with the remaining additional structures (i.e., the entorhinal cortex, subiculum, and fimbria), comprised the hippocampal formation. We have used similar nomenclature in prior published work (e.g., Szeszko et al., 2003; Wellington et al., 2013; Bogerts et al., 1990; Bogerts et al., 1993). We measured subregions throughout the entire length of the hippocampus using a manual region-of-interest approach with reliable tracing software (Yushkevich et al., 2006). Through the use of postmortem atlases (Duvernoy, 1988; Harding et al., 1998; Yushkevich et al., 2009) and prior published research (Malykhin et al., 2010b; Mueller et al., 2007; Van Leemput et al., 2009; Yushkevich et al., 2010), delineation criteria were established for six subregions within the hippocampal formation (see Figures 1A-C and Figure 2). These criteria relied on anatomical landmarks and intensity level changes within the images.
Figure 1. Illustration of the hippocampal delineation criteria beginning posteriorly and moving anteriorly on every other slice.
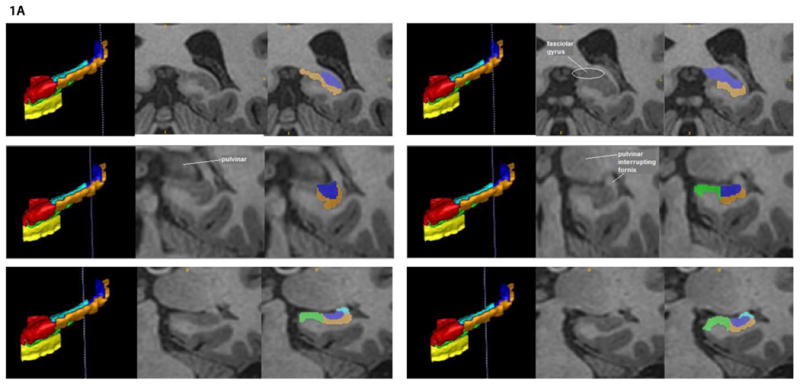
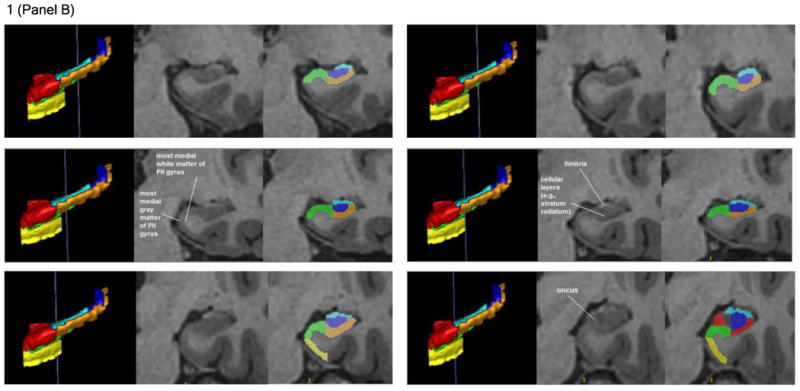
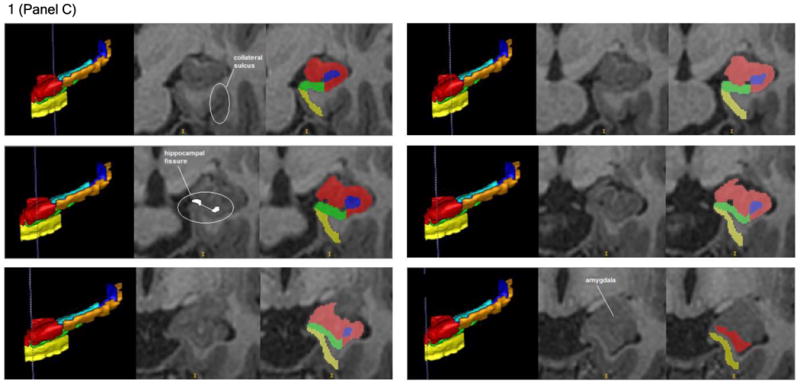
Notes: The vertical blue lines on the 3D sagittal hippocampal meshes display where the associated coronal images are located on the anterior-posterior axis. Anatomical landmarks utilized for segmentation are labeled in the center image of each row, which depicts the T1 coronal slices. Segmented T1 coronal slices are indicated in the image to the extreme right of each row. In both the 3D meshes and the segmented T1 images, the Anterior CA 1-3 subregion is colored red, Posterior CA 1-3 is orange, the subiculum is green, DG / CA 4 is blue, the entorhinal cortex is yellow, and the fimbria is cyan.
Note: PH gyrus = parahippocampal gyrus.
Figure 2. A 3D mesh of an individual's hippocampus produced by ITK-SNAP and viewed from the a) superior perspective, b) inferior perspective, c) anterior perspective, d) posterior perspective, e) medial perspective (left hippocampus only), and f) lateral perspective (left hippocampus only).

Note. The color scheme for the hippocampal subregions is identical to that depicted in Figure 1A-C.
Posterior CA 1-3
Starting in the most posterior slice of the hippocampus proper, all of the hippocampal gray matter that appeared was allocated to subregion CA 1-3 for two slices (i.e., approximately two millimeters). After this point, subregion CA 1-3 was distinguished from subregion DG / CA 4 based on differences in the images' intensity (see upper left row of Figure 1A), which indicated the location of cellular layers that lie between CA 1-3 and DG / CA 4 (i.e., the stratum radiatum of the cornu Ammonis, the stratum moleculare of the cornu Ammonis, and the stratum moleculare of the dentate gyrus; see the middle right row of Figure 1B as an example). Simultaneous with the appearance of the thalamus' pulvinar nucleus in the coronal view (see middle left row of Figure 1A), the medial boundary of CA 1-3 became the most medial point at which the subregion of DG / CA 4 folded in upon the rest of the hippocampus proper. Throughout the posterior hippocampal formation, the lateral boundary of CA 1-3 was the lateral border of the hippocampus proper's gray matter (see Figure 1A and Figure 1B). The inferior boundary of CA 1-3 in the posterior hippocampal formation was the white matter of the parahippocampal gyrus, whereas the superior boundary of this subregion was first the white matter medial to the lateral ventricle, then the fornix, and then the fimbria (see Figure 1A and Figure 1B).
Anterior CA 1-3
When it appeared, the gray matter of the uncus marked the beginning of the anterior hippocampal formation and was included in the subregion of CA 1-3 (see bottom right row of Figure 1B). In the anterior hippocampal formation, the medial boundary of CA 1-3 was primarily the CSF of the temporal horn (see Figure 1C). As in the posterior hippocampal formation, the subregion of CA 1-3 was distinguished infero-medially from the subiculum in the anterior hippocampal formation by the placement of subregion DG / CA 4 (see Figures 1A-C). When DG / CA 4 terminated anteriorly, the subiculum became the inferior boundary of CA 1-3 until the two most anterior slices of the hippocampus proper, in which CA 1-3 was identified as all the gray matter in the hippocampus proper, and its inferior boundary once more became the white matter of the parahippocampal gyrus (see bottom right row of Figure 1C). The lateral boundary of this subregion in the anterior segment of the hippocampal formation remained the most lateral gray matter of the hippocampus proper (see Figure 1C). CA 1-3's superior boundary in the anterior hippocampal formation remained the fimbria until that subregion's rostral termination (see bottom right row of Figure 1B and top left row of Figure 1C). After that point, it became the CSF of the temporal horn and eventually the gray matter of the amygdala (see the bottom right row of Figure 1C). The subregion of CA 1-3 was superiorly distinguished from the amygdala by demarcating a boundary along the alveus, which was detected by observing differences in image intensity.
Subiculum
The first posterior slice on which the subiculum was identified was designated as being two slices anterior to the most posterior slice in which the pulvinar nucleus of the thalamus became visible (see the middle left and right rows of Figure 1A). The subiculum's medial boundary throughout the majority of the hippocampal formation was defined by the shape of the parahippocampal gyrus. Specifically, a line was drawn between the most medial point of white matter and the most medial point of gray matter on the parahippocampal gyrus to create the medial border of the subiculum (see middle left row of Figure 1B). The subiculum's lateral boundary was the inferior medial boundary of CA 1-3 (see Figures 1A-C). Its inferior boundary was the white matter of the parahippocampal gyrus (see Figures 1A-C). Finally, the superior boundary of the subiculum throughout the posterior hippocampal formation was the superior termination of the parahippocampal gyrus's gray matter (see Figure 1A and Figure 1B). When the uncal apex appeared, the subiculum was superiorly distinguished from the Anterior CA 1-3 subregion by locating the hippocampal fissure in more rostral slices. It was observed how the hippocampal fissure progressed posteriorly, until the coronal slice displaying the uncal apex was reached and conclusions could be drawn about where the superior boundary of the subiculum was located (see bottom right row of Figure 1B). The superior boundary of the subiculum in the anterior hippocampal formation then continued to be the hippocampal fissure (see, for example, the middle left row of Figure 1C). The hippocampal fissure's anterior progression was also used to predict the location of the subiculum's superior boundary in the most rostral slices of the hippocampal formation, where the CSF of the hippocampal fissure becomes less detectable from changes in the image's intensity (see bottom left row of Figure 1C). In the anterior hippocampal formation, the lateral boundary of the subiculum became the most lateral hippocampal gray matter. This was distinguished from the lateral boundary of CA 1-3 by differences in the image's intensity. The subiculum terminated anteriorly two slices posterior to the initial anterior appearance of the hippocampus proper's gray matter (see bottom right row of Figure 1C). We acknowledge that our delineation of the subiculum includes multiple smaller areas of the subicular complex, including the pre-subiculum, para-subiculum, and post-subiculum.
Dentate Gyrus / CA 4
We designated the first posterior slice on which the DG / CA 4 was identified as being two slices anterior to the most posterior slice on which hippocampal gray matter became visible. In the posterior hippocampus proper, the medial boundary of DG / CA 4 transitioned from the white matter medial to the lateral ventricle to the CSF of the temporal horn (see the top rows of Figure 1A). We fully acknowledge the possibility that components of the fasciolar gyrus were included in the delineation of this subregion. The lateral boundary of the DG / CA 4 subregion in the posterior hippocampus proper began as the fornix and became CA 1-3 moving anteriorly (see Figure 1A). In the posterior hippocampus proper, the inferior boundary of DG / CA 4 is CA 1-3 and the superior boundary of this subregion began as the white matter medial to the lateral ventricle and became the fimbria progressing through the hippocampus anteriorly (see Figure 1A and Figure 1B). In the anterior hippocampus proper, DG / CA 4 gradually became surrounded on all sides by CA 1-3 until it terminated anteriorly. This termination always occurred before the anterior conclusion of the subiculum (see Figure 1C).
Entorhinal Cortex
We included the entorhinal cortex in our hippocampal measurements based on the traditional concept that the hippocampal formation comprises the cortical structures extending from the dentate gyrus to the entorhinal cortex (Amaral & Lavenex, 2007), including the cornu Ammonis subregions, the dentate gyrus, the subiculum, and the entorhinal cortex (O'Mara, 2005). The first posterior slice on which the entorhinal cortex could be identified was two slices posterior to the most posterior slice on which the uncal apex became visible (see the bottom rows of Figure 1B). The entorhinal cortex extended anteriorly until the first anterior slice in which the gray matter of the hippocampus proper was visible. Throughout the structure, the medial boundary of the entorhinal cortex was the CSF of the temporal horn (see Figure 1C). Considerable care was taken to ensure that the entorhinal cortex could be distinguished medially from the dura in more anterior slices. The lateral boundary of the entorhinal cortex was the white matter of the parahippocampal gyrus. The inferior boundary of this subregion was determined by the most inferior point of the parahippocampal gyrus medial to the collateral sulcus (see top left row of Figure 1C). The superior boundary of the entorhinal cortex was created by connecting the most medial point of the parahippocampal gyrus's white matter with the most medial point of the parahippocampal gyrus' gray matter. This line also served as the inferior boundary of the subiculum when applicable (see middle left row of Figure 1B).
Fimbria
Given the fimbria is composed of white matter, its identification was determined primarily by image intensity changes (see middle right row of Figure 1B for an example). The first posterior slice on which the fimbria could be identified was two slices anterior to the posterior slice in which the pulvinar of the thalamus began to interrupt the fornix (see middle right row of Figure 1A). The last anterior slice of the fimbria was designated as being two slices anterior to the most posterior slice on which the uncus was visible (see bottom right row of Figure 1B). The lateral, medial, and superior boundaries of the fimbria were defined by the CSF of the temporal horn, whereas the inferior boundary of the fimbria was established by the subregions of CA 1 -3 and DG / CA 4 (see the bottom rows of Figure 1A and all of Figure 1B).
Reliability and Statistics
Two operators manually traced the regions-of-interest in the right and left hemispheres of five individuals blind to the other operator's work using ITK-SNAP (Yushkevich et al., 2006). Manual segmentation of a single (i.e., one hemisphere) hippocampus took approximately 2.5 hours. One operator (KR) manually traced these regions-of-interest again approximately 1 week later to determine intra-rater reliability. Reliability was assessed using the Dice index (Dice, 1945), which is defined as 2(A∩B)/(A+B). That is, the size of intersection (agreement or overlap) between two labels (i.e., A∩B) is divided by their average size (i.e., [A+B]/2). The Dice index ranges from 0 (no overlap) to 1 (perfect agreement) and was computed for hippocampal subregions using both inter-rater and intra-rater reliability. In addition, volumes for the subregions delineated on these five cases were estimated by ITK-SNAP and then used to calculate intraclass correlation coefficients (ICCs) using the Statistical Package for the Social Sciences (SPSS). A two-way mixed effects model based on the ICC value for a single operator was utilized. Thus, each subject is assessed by both operators, but the operators are the only ones of interest. Importantly, ICCs were computed based on the premise that a single operator would conduct the tracings and not that the average of the two operators would be used for the measurements. Delineation was then completed by one tracer (KR) in the scans of 10 healthy volunteers. Regarding these 10 cases, we compared asymmetry in right and left hemisphere hippocampal subregion volumes using paired samples t-tests.
Results
Inter-rater and intra-rater ICCs for the reliability cases are provided in Table 2. For inter-rater reliability 8 of the 12 subregions (right and left) had ICCs greater than .80. An investigation of intra-rater reliability indicated that 10 of 12 subregions achieved ICCs greater than .80. Average Dice indices for the cases in the reliability trial were fairly consistent across the hippocampal subregions, ranging from .70 to .81 for inter-rater reliability and from .82 to .90 for intra-rater reliability (Figure 3).
Table 2. Intra-class correlation coefficients for reliability trial.
| Inter-rater reliability | Intra-rater reliability | |||
|---|---|---|---|---|
| Region | Left | Right | Left | Right |
| A CA 1-3 | .98 | .98 | .99 | .99 |
| P CA 1-3 | .73 | .88 | .97 | .97 |
| Subiculum | .90 | .74 | .89 | .96 |
| DG/CA 4 | .95 | .84 | .96 | .98 |
| Entorhinal Cortex | .71 | .93 | .99 | .92 |
| Fimbria | .76 | .84 | .66 | .75 |
Note. A CA 1-3 = anterior cornu Ammonis 1-3; P CA 1-3 = posterior cornu Ammonis 1-3; DG/CA 4 = dentate gyrus / cornu Ammonis 4.
Figure 3. Mean inter-rater and intra-rater Dice coefficients for hippocampal subregions in the reliability trial.

Note. The color scheme for the hippocampal subregions is identical to that depicted in Figure 1A-C.
Descriptive statistics for the 6 subregions applied to 10 healthy volunteers are provided in Table 3. Paired samples t-tests (Table 4) indicated that all subregions in the right hemisphere were significantly and positively correlated with their respective contralateral regions in the left hemisphere except the posterior CA 1-3 and the fimbria. Investigation of volumetric asymmetries indicated that the right anterior CA 1-3 and right subiculum were significantly larger compared to the left anterior CA 1-3 and left subiculum, respectively.
Table 3. Descriptive statistics for hippocampal subregion volumes (mm3) in 10 healthy volunteers.
| Left Hemisphere | Right Hemisphere | |||||||
|---|---|---|---|---|---|---|---|---|
| Region | Mean | Median | SD | Range | Mean | Median | SD | Range |
| A CA 1-3 | 1151 | 1018 | 319 | 767-1666 | 1321 | 1310 | 306 | 886-1750 |
| P CA 1-3 | 564 | 567 | 87 | 386-679 | 537 | 544 | 58 | 468-638 |
| Subiculum | 627 | 604 | 71 | 543-764 | 678 | 658 | 111 | 551-927 |
| DG/CA 4 | 665 | 658 | 152 | 455-877 | 600 | 591 | 120 | 436-796 |
| EC | 328 | 286 | 96 | 235-538 | 325 | 286 | 80 | 251-470 |
| Fimbria | 146 | 144 | 15 | 123-168 | 146 | 146 | 26 | 103-184 |
Note. Volumes are in cubic millimeters. SD = Standard deviation; A CA 1-3 = anterior cornu Ammonis 1-3; P CA 1-3 = posterior cornu Ammonis 1-3; DG/CA 4 = dentate gyrus / cornu Ammonis 4; EC = entorhinal cortex.
Table 4. Between hemisphere comparisons of hippocampal subregion volumes (mm3).
| Paired Samples Correlations | Paired Samples Testa | |||
|---|---|---|---|---|
| Pairb | Correlation | p-value | Mean Paired Difference | p-value |
| A CA 1-3 | .94 | <.001 | 170 | .001 |
| P CA 1-3 | .61 | .061 | -27 | .251 |
| Sub | .90 | <.001 | 51 | .020 |
| DG/CA 4 | .75 | .013 | -64 | .076 |
| EC | .86 | .001 | -3 | .844 |
| Fimbria | .43 | .219 | 0 | 1.000 |
Note. Volumes are in cubic millimeters. CA = cornu Ammonis; Sub = subiculum; DG dentate gyrus; EC = entorhinal cortex.
Differences were computed by subtracting the left-hemisphere volume from the right hemisphere volume.
Each pair consists of the named structure in the right and left hemisphere.
Discussion
We present a novel approach for the delineation of hippocampal subregions from MR images acquired at 3T using a T1-weighted contrast. Although several innovative methods have been developed for manual mensuration of hippocampal subregions (e.g., those based on a T2-weighted contrast) which provide the ability to visualize subfields, they may not be applicable to a T1-weighted contrast and need to be acquired prospectively. We therefore believe this study fills an important gap in the literature given that the majority of MR imaging data collected to date has utilized a T1-weighted contrast. In addition, although 3-dimensional approaches are available to segment the entire hippocampal formation and to identify hippocampal subfields (e.g., CA 2/3, CA 1, subiculum) using a T1-weighted contrast (Bearden et al., 2008), they are approximate and do not provide information regarding its medial surface. A significant strength of our study is the emphasis on reliability metrics to establish feasibility and generalizability. Specifically, our approach is supported by the use of excellent intra-rater and inter-rater reliability, including Dice indices. Moreover, in contrast to several prior segmentation schemes our approach and associated reliability metrics were applied to the entire rostrocaudal axis of the hippocampus.
Prior work for hippocampal segmentation using other contrasts may be limited by reliability metrics. For example, in the study by Mueller et al. (2007) intra-rater and inter-rater reliability were computed using two operators to measure 10 cases, but delineation criteria were applied only to five adjacent slices in the hippocampal body. Bonnici et al. (2012) similarly restricted the reliability measurements of their manual delineation criteria regarding the subregions of CA 1, CA 3, DG, and the subiculum. As a result, their relatively high Dice indices (i.e., ranging from .7 to .86 for intra-rater reliability and from .57 to .80 for inter-rater reliability) may not reflect the reliability of their delineation criteria across the majority of the hippocampal structure, including the hippocampus/amygdala transition area. Furthermore, intra-class correlations were not computed as an additional gauge of reliability. In contrast to Mueller et al. (2007) and Bonnici et al. (2012), both Malykhin et al. (2010b) and La Joie et al. (2010) conducted reliability measures on their manual tracings of subregions throughout the entire structure of the hippocampus. In the study by Malykhin et al. (2010b) these authors established delineation criteria for the subiculum, CA 1–3, and the dentate gyrus. In the study by La Joie et al. (2010), volunteers underwent a T1-weighted structural scan (acquired in 9.7 minutes) and, in addition, a high resolution proton density weighted sequence was acquired perpendicular to the long axis of the hippocampus (in 7.6 minutes). Thus, the authors' goal was to develop a new magnetic resonance imaging sequence designed with the specific goal of measuring the hippocampus. La Joie et al. (2010) delineated CA 1, the subiculum, and “other,” which included CA 2-4 and the dentate gyrus. Intra-rater reliability assessed using intra-class correlations in both Malykhin et al. (2010b) and La Joie et al. (2010) was high, ranging from .95 to .98 and from .89 to .96, respectively. However, in both studies inter-rater reliability measures were not computed, thus making it difficult to determine whether the established delineation criteria would effectively generalize to other operators.
Approaches for automatic or semi-automatic hippocampal segmentation are extremely valuable for studies requiring high throughput, although the reliability of these approaches has not been demonstrated to be consistently high. Concerning automatic segmentation, Van Leemput and colleagues (2009) used a 32-channel head coil to produce ultra high resolution MR images based on Markov random field priors. The mean intra-rater Dice index for seven hippocampal subregions was 0.79, although reliability was assessed within only two consecutive coronal slices of the hippocampus midbody where the orientation of subregions is typically the most clear and consistent. No inter-rater reliability statistics were computed. Dice overlap measures between their manual and automated approaches (see their figure 3, lower right) ranged from approximately 0.2 to .75. Moreover, a potential disadvantage of this approach is the long acquisition time (i.e., > 37 minutes) given that images were averaged 5 times to achieve a high signal to noise ratio. This may preclude the use of this sequence in some clinical populations. Also, it is unknown whether these methods can be successfully generalized to MR images with lower resolution and signal-to-noise ratio (e.g., Teicher, Anderson, & Polcari, 2012). Similarly, in another study Bonnici et al. (2012) used multi-voxel pattern analysis to automatically classify subregions, but did not present reliability statistics between this approach and their manual mensuration delineation criteria.
In one study Yushkevich et al. (2010) developed a “nearly automatic” program for hippocampal subregion delineation criteria within the hippocampal body using a technique established by Mueller and Weiner (2009) from focal 0.4 × 0.5 × 2.0 mm3 resolution T2-weighted MR images acquired in under 5 minutes. Their approach requires that an operator partition images into the hippocampal head, body, and tail. The intra-class correlation coefficient expressing agreement between automatic segmentation and manual segmentation for one operator was relatively large for subfields CA 1 (0.89), the dentate gyrus (0.94), and the hippocampal head (0.91). Intra-class correlations between the automatic and manual approaches were substantially lower (range = 0.19 to 0.5) for CA 2, CA 3, the entorhinal cortex, the subiculum, the hippocampal tail, and the parahippocampal gyrus. This indicates that the values produced by the automated approach for these regions may be less reliable. Similarly, Winterburn and colleagues (2013) proposed a coupling of high-resolution along with contrast T1- and T2-weighted imaging to identify CA 1, CA 2 / CA 3, CA 4 / dentate gyrus, stratum radiatum / stratum lacunosum / stratum moleculare, and the subiculum in approximately 36 minutes. High resolution FSPGR-BRAVO images were acquired in a scan time of approximately 20 minutes, and T2-weighted images using a FSE CUBE in approximately 16 minutes. Moreover, for both image contrasts 3 separate acquisitions were performed yielding 3 separate image volumes. The T1 and T2 acquisitions were acquired in 2 separate sessions for each volunteer “to minimize discomfort for the subject.” Although this methodology has significant merits and strengths, it may be difficult to practically scan psychiatric patients and pediatric populations using this approach. To assess reliability, a single hippocampus from each subject was re-segmented by the same operator with values ranging from .64 to .83. No inter-rater reliability was performed, and the stratum radiatum, stratum lacunosum, and stratum moleculare were measured as a unitary structure.
The delineation of the dentate gyrus and CA 4 subregions may have particular relevance for psychiatric and neurologic disorders that have implicated hippocampal abnormalities in their pathogenesis. Specifically, the dentate gyrus is highly pertinent to psychiatric disorders involving adult neurogenesis as this process typically occurs in the subgranular zone of this subregion. For example, it has been hypothesized that schizophrenia is related to an immature dentate gyrus possibly caused by reduced neurogenesis (DeCarolis & Eisch, 2010). In addition, a recent study by Fabricius, Helboe, Steiniger-Brach, Fink-Jensen, and Pakkenberg (2010) found smaller dentate gyri in male rats that had been isolated after weaning. The social isolation of rats has previously been suggested as an animal model of schizophrenia, as it results in neurochemical changes similar to those found in individuals with the disorder. Accompanying behavior alterations have involved locomotor hyperactivity, discrepancies in prepulse inhibition in the acoustic startle paradigm, and multiple cognitive deficits (Fabricius et al., 2010). To investigate the hippocampal subregions of the dentate gyrus and CA 4, this study has implemented a slice-by-slice delineation approach in contrast to a method involving surface analysis. A potential limitation of this latter technique is that it does not permit investigators to examine subregions encased within the overall hippocampal structure and thus cannot determine whether volumetric abnormalities can be attributed to internal (i.e., DG and CA 4) or external (i.e., CA 1) hippocampal subregions.
To our knowledge, this is the first study to report significant volume asymmetry within hippocampal subregions. Our findings thus converge with the considerable existing evidence for significant right greater than left total hippocampal volume asymmetry from MR imaging data (Wellington et al., 2013; Pedraza, Bowers, & Gilmore, 2004). In one study Woolard and Heckers (2012) reported asymmetry limited to the anterior hippocampus. They also concluded that the magnitude of right greater than left anterior hippocampal volume asymmetry was associated with basic cognitive performance in a cohort of 110 healthy subjects. Our data thus extend prior work by implicating right greater than left volume asymmetry in the anterior CA 1-3 and subiculum, although these findings should be considered tentative until replicated in larger samples. Their functional significance should also be investigated.
In this study, as in our prior work (Szeszko et al., 2003; Wellington et al., 2013; Bogerts et al., 1990; Bogerts et al., 1993), we defined the hippocampus proper to comprise the subregions of CA 1-3 and DG / CA 4. In contrast, the hippocampal formation includes the hippocampus proper as well as the entorhinal cortex, subiculum and fimbria. As a result, it was possible for us to compute volumetric estimates of the hippocampus proper from our data by summing the generated volumes from the reliable subregions of anterior CA 1-3, posterior CA 1-3, and DG / CA 4. We are aware that previous stereological estimates regarding the hippocampus proper have included areas of the subiculum (La Joie et al., 2010; Malykhin et al., 2010; Winterburn et al., 2013). Whereas the cellular structure of the subiculum is thought to resemble that of the cornu Ammonis subregions, the cytoarchitecture of the pre-subiculum and post-subiculum are more comparable to that of the entorhinal cortex (Amaral & Lavenex, 2007). As our delineation of the subiculum merges these distinct components of the subicular complex, the similarities to the entorhinal cortex noted above encouraged us to eliminate the possibility that the pre-subiculum and para-subiculum subregions would be included in a volumetric estimate of the hippocampus proper by excluding our “subiculum” region-of-interest from our calculations.
The analysis of volumes for the hippocampus proper yielded some intriguing results. Specifically, we found trend-level (p = .07) effects for the hippocampus proper to be significantly larger in the right compared to the left hemisphere. This is consistent with previous findings that have determined the right hippocampus to be slightly larger than the left (Harrison, 2004). However, as reported in Table 4, the subregions that comprise the hippocampus proper display differing volumetric patterns across hemispheres. Namely, the right anterior CA 1-3 region was significantly larger than its left hemisphere counterpart (p = .001) whereas the right DG / CA 4 subregion demonstrated a trend for being significantly smaller compared to its counterpart in the left hemisphere (p = .08). These findings imply that the effect observed in the hippocampus proper is due primarily to the difference between hemispheres in the anterior CA 1-3 subregion. Furthermore, it appears that the DG / CA 4 region-of-interest could possibly demonstrate a different volumetric pattern across hemispheres than the anterior CA 1-3 subregion. These results may be particularly noteworthy given that specific functions have been attributed to the right hippocampus (i.e., spatial memory) and left hippocampus (i.e., verbal memory; Harrison, 2004), as well as the anterior hippocampus and posterior hippocampus (Strange et al., 1999; Strange & Dolan, 2001).
There were several limitations to the current study that should be acknowledged. Despite excellent reliability, our approach still necessitates the manual delineation of hippocampal subregions and thus requires considerable operator effort to complete the tracings. On the other hand, manual approaches for hippocampal mensuration remain the gold standard by which other approaches can be compared. It should also be acknowledged that our use of an atlas-based approach for hippocampal subregion delineation may have disadvantages. Specifically, because the operator could not determine vascularization patterns or cellular structures from MR images, the subregions defined in this study provide only estimates regarding where these specialized regions are located. For example, the distinction between CA 1 and the subiculum is traditionally marked by the end of the stratum radiatum, a layer of CA 1 that is comprised of dendrites from its pyramidal neurons (Duvernoy, 1988).
An additional limitation is that this approach and contrast ultimately required that we merge unique hippocampal subregions. For example, the hippocampal areas of CA 1, CA 2, and CA 3 were merged into a single subregion (CA 1-3). As CA 3 occurs more superiolaterally in the body of the hippocampus, it is possible that this approach may result in the partial exclusion of this subfield. Similarly, the identified “subiculum” subregion included cellularly distinct components of the subicular complex, and the dentate gyrus and CA 4 were combined into a single subregion (DG / CA 4) that did not consistently exclude the fasciolar gyrus. Based on our extensive initial pilot work, we concluded that the reliable separation of these individual subfields was not possible in our MR images. We also acknowledge that results based on the anterior/posterior distinction of CA 1-3 may have changed if different guidelines were used. In addition, although there is no widely accepted standard for assessment of test-retest reliability, our choice of one week was short and may have contributed to the high intra-rater ICCs. Ultimately, however, we believe that it is more critical for mensuration studies to investigate inter-rater reliability, which is the standard most often used in volumetric neuroimaging studies (in contrast to intra-rater reliability) so that results can be replicated by other individuals. We also acknowledge that others have included separate volumetric estimates regarding the head and tail of the hippocampus, but that these analyses have not yet been conducted on our dataset and thus, may be considered a limitation of the proposed methodology. Lastly, our sample size is small and the preliminary nature of the asymmetry findings must be acknowledged and replicated using larger sample sizes.
In summary, we describe a novel approach for manual hippocampal subregion volumetry using T1-weighted MR images acquired at 3T. Our approach has demonstrated excellent inter-and intra-rater reliability compared to several prior automated and semi-automated approaches.
Acknowledgments
This work was supported in part by grants from NARSAD (PRS) and the National Institute of Mental Health to Dr. Szeszko (R01 MH076995), the NSLIJ Research Institute General Clinical Research Center (M01 RR018535), an Advanced Center for Intervention and Services Research (P30 MH090590) and a Center for Intervention Development and Applied Research (P50 MH080173)
References
- Adler DH, Pluta J, Kadivar S, Craige C, Gee JC, Avants BB, Yushkevich PA. Histology-derived volumetric annotation of the human hippocampal subfields in postmortem MRI. Neuroimage. 2014;84:505–523. doi: 10.1016/j.neuroimage.2013.08.067. [DOI] [PMC free article] [PubMed] [Google Scholar]
- Amaral D, Lavenex P. Hippocampal neuroanatomy. In: Anderson P, Morris R, Amaral D, Bliss T, O'Keefe J, editors. The hippocampus book. Oxford University Press; New York: 2007. pp. 37–114. [Google Scholar]
- Apostolova LG, Morra JH, Green AE, Hwang KS, Avedissian C, Woo E, Cummings JL, Toga AW, Jack CR, Jr, Weiner MW, Thompson PM Alzheimer's Disease Neuroimaging Initiative. Automated 3D mapping of baseline and 12-month associations between three verbal memory measures and hippocampal atrophy in 490 ADNI subjects. Neuroimage. 2010;51(1):488–499. doi: 10.1016/j.neuroimage.2009.12.125. [DOI] [PMC free article] [PubMed] [Google Scholar]
- Ardekani BA, Bachman AH. Model-based automatic detection of the anterior and posterior commissures on MRI scans. Neuroimage. 2009;46(3):677–682. doi: 10.1016/j.neuroimage.2009.02.030. [DOI] [PMC free article] [PubMed] [Google Scholar]
- Barbas H, Blatt GJ. Topographically specific hippocampal projections target functionally distinct prefrontal areas in the rhesus monkey. Hippocampus. 1995;5:511–533. doi: 10.1002/hipo.450050604. [DOI] [PubMed] [Google Scholar]
- Bearden CE, Soares JC, Klunder AD, Nicoletti M, Dierschke N, Hayashi KM, Narr KL, Brambilla P, Sassi RB, Axelson D, Ryan N, Birmaher B, Thompson PM. Three-dimensional mapping of hippocampal anatomy in adolescents with bipolar disorder. J Am Acad Child Adolesc Psychiatry. 2008;47(5):515–525. doi: 10.1097/CHI.0b013e31816765ab. [DOI] [PMC free article] [PubMed] [Google Scholar]
- Boccardi M, Ganzola R, Rossi R, Sabattoli F, Laakso MP, Repo-Tiihonen E, Vaurio O, Könönen M, Aronen HJ, Thompson PM, Frisoni GB, Tiihonen J. Abnormal hippocampal shape in offenders with psychopathy. Hum Brain Mapp. 2010;31:438–447. doi: 10.1002/hbm.20877. [DOI] [PMC free article] [PubMed] [Google Scholar]
- Bogerts B, Ashtari M, Degreef G, Alvir JM, Bilder RM, Lieberman JA. Reduced temporal limbic structure volumes on magnetic resonance images in first episode schizophrenia. Psychiatry Res. 1990;35:1–13. doi: 10.1016/0925-4927(90)90004-p. [DOI] [PubMed] [Google Scholar]
- Bogerts B, Lieberman JA, Ashtari M, Bilder RM, Degreef G, Lerner G, Johns C, Masiar S. Hippocampus-amygdala volumes and psychopathology in chronic schizophrenia. Biol Psychiatry. 1993;33:236–246. doi: 10.1016/0006-3223(93)90289-p. [DOI] [PubMed] [Google Scholar]
- Bonnici HM, Chadwick MJ, Kumaran D, Hassabis D, Weiskopf N, Maguire EA. Multi-voxel pattern analysis in human hippocampal subfields. Front Hum Neurosci. 2012;6:1–13. doi: 10.3389/fnhum.2012.00290. [DOI] [PMC free article] [PubMed] [Google Scholar]
- Burger C. Region-specific genetic alterations in the aging hippocampus: implications for cognitive aging. Front Aging Neurosci. 2010;2:140. doi: 10.3389/fnagi.2010.00140. [DOI] [PMC free article] [PubMed] [Google Scholar]
- Carmichael O, Xie J, Fletcher E, Singh B, DeCarli C Alzheimer's Disease Neuroimaging Initiative. Localized hippocampus measures are associated with Alzheimer pathology and cognition independent of total hippocampal volume. Neurobiol Aging. 2012;33(6):1124.e31–41. doi: 10.1016/j.neurobiolaging.2011.08.016. [DOI] [PMC free article] [PubMed] [Google Scholar]
- Carr DB, Sesack SR. Hippocampal afferents to the rat prefrontal cortex: synaptic targets and relation to dopamine terminals. J Comp Neurol. 1996;369:1–15. doi: 10.1002/(SICI)1096-9861(19960520)369:1<1::AID-CNE1>3.0.CO;2-7. [DOI] [PubMed] [Google Scholar]
- Cole J, Toga AW, Hojatkashani C, Thompson P, Costafreda SG, Cleare AJ, Williams SC, Bullmore ET, Scott JL, Mitterschiffthaler MT, Walsh ND, Donaldson C, Mirza M, Marquand A, Nosarti C, McGuffin P, Fu CH. Subregional hippocampal deformations in major depressive disorder. J Affect Disord. 2010;126:272–277. doi: 10.1016/j.jad.2010.03.004. [DOI] [PMC free article] [PubMed] [Google Scholar]
- DeCarolis NA, Eisch AJ. Hippocampal neurogenesis as a target for the treatment of mental illness: a critical evaluation. Neuropharmacology. 2010;58:884–893. doi: 10.1016/j.neuropharm.2009.12.013. [DOI] [PMC free article] [PubMed] [Google Scholar]
- Demaster DM, Ghetti S. Developmental differences in hippocampal and cortical contributions to episodic retrieval. Cortex. 2013;49:1482–1493. doi: 10.1016/j.cortex.2012.08.004. [DOI] [PubMed] [Google Scholar]
- Dice LR. Measures of the amount of ecologic association between species. Ecology. 1945;26:297–302. [Google Scholar]
- Donix M, Burggren AC, Suthana NA, Siddarth P, Ekstrom AD, Krupa AK, Bookheimer SY. Family history of Alzheimer's disease and hippocampal structure in healthy people. Am J Psychiatry. 2010;167:1399–1406. doi: 10.1176/appi.ajp.2010.09111575. [DOI] [PMC free article] [PubMed] [Google Scholar]
- Duvernoy HM. In: The human hippocampus: an atlas of applied anatomy. Bergmann JF, editor. Verlag Müchen; Germany: 1988. [Google Scholar]
- Ekstrom AD, Bazih AJ, Suthana NA, Al-Hakim R, Ogura K, Zeineh M, Burggren AC, Bookheimer SY. Advances in high-resolution imaging and computational unfolding of the human hippocampus. Neuroimage. 2009;47:42–49. doi: 10.1016/j.neuroimage.2009.03.017. [DOI] [PMC free article] [PubMed] [Google Scholar]
- Fabricius K, Helboe L, Steiniger-Brach B, Fink-Jensen A, Pakkenberg B. Stereological brain volume changes in post-weaned socially isolated rats. Brain Res. 2010;1345:233–239. doi: 10.1016/j.brainres.2010.05.040. [DOI] [PubMed] [Google Scholar]
- Fanselow MS, Dong HW. Are the dorsal and ventral hippocampus functionally distinct structures? Neuron. 2010;65:7–19. doi: 10.1016/j.neuron.2009.11.031. [DOI] [PMC free article] [PubMed] [Google Scholar]
- First MB, Spitzer RL, Gibbon M, Williams JBW. Structured Clinical Interview for DSM-IV-TR Axis I Disorders – Non-patient Edition (SCID-I/NP), Revision. Biometrics Research Department, New York State Psychiatric Institute; 2001. [Google Scholar]
- Frisoni GB, Ganzola R, Canu E, Rüb U, Pizzini FB, Alessandrini F, Thompson PM. Mapping local hippocampal changes in Alzheimer's disease and normal ageing with MRI at 3 Tesla. Brain. 2008;131:3266–3276. doi: 10.1093/brain/awn280. [DOI] [PubMed] [Google Scholar]
- Gold SM, Kern KC, O'Connor MF, Montag MJ, Kim A, Yoo YS, Giesser BS, Sicotte NL. Smaller cornu Ammonis 2-3/dentate gyrus volumes and elevated cortisol in multiple sclerosis patients with depressive symptoms. Biol Psychiatry. 2010;68:553–559. doi: 10.1016/j.biopsych.2010.04.025. [DOI] [PMC free article] [PubMed] [Google Scholar]
- Guazzelli A, Bota M, Arbib MA. Competitive Hebbian learning and the hippocampal place cell system: modeling the interaction of visual and path integration cues. Hippocampus. 2001;11:216–239. doi: 10.1002/hipo.1039. [DOI] [PubMed] [Google Scholar]
- Guzowski JF, Knierim JJ, Moser EI. Ensemble dynamics of hippocampal regions CA3 and CA1. Neuron. 2004;44:581–584. doi: 10.1016/j.neuron.2004.11.003. [DOI] [PubMed] [Google Scholar]
- Harding AJ, Halliday GM, Kril JJ. Variation in hippocampal neuron number with age and brain volume. Cereb Cortex. 1998;8:710–718. doi: 10.1093/cercor/8.8.710. [DOI] [PubMed] [Google Scholar]
- Harrison PJ. The hippocampus in schizophrenia: a review of the neuropathological evidence and its pathophysiological implications. Psychopharmacology. 2004;174:151–162. doi: 10.1007/s00213-003-1761-y. [DOI] [PubMed] [Google Scholar]
- Harrison PJ, Eastwood SL. Neuropathological studies of synaptic connectivity in the hippocampal formation in schizophrenia. Hippocampus. 2001;11:508–519. doi: 10.1002/hipo.1067. [DOI] [PubMed] [Google Scholar]
- Kerchner GA, Hess CP, Hammond-Rosenbluth KE, Xu D, Rabinovici GD, Kelley DA, Vigneron DB, Nelson SJ, Miller BL. Hippocampal CA1 apical neuropil atrophy in mild Alzheimer disease visualized with 7-T MRI. Neurology. 2010;75:1381–1387. doi: 10.1212/WNL.0b013e3181f736a1. [DOI] [PMC free article] [PubMed] [Google Scholar]
- King KG, Glodzik L, Liu S, Babb JS, de Leon MJ, Gonen O. Anteroposterior hippocampal metabolic heterogeneity: three-dimensional multivoxel proton 1H MR spectroscopic imaging – initial findings. Radiology. 2008;249:242–250. doi: 10.1148/radiol.2491071500. [DOI] [PMC free article] [PubMed] [Google Scholar]
- Konrad C, Ukas T, Nebel C, Arolt V, Toga AW, Narr KL. Defining the human hippocampus in cerebral magnetic resonance images – an overview of current segmentation protocols. Neuroimage. 2009;47:1185–1195. doi: 10.1016/j.neuroimage.2009.05.019. [DOI] [PMC free article] [PubMed] [Google Scholar]
- La Joie R, Fouquet M, Mézenge F, Landeau B, Villain N, Mevel K, Pélerin A, Eustache F, Desgranges B, Chételat G. Differential effect of age on hippocampal subfields assessed using a new high-resolution 3T MR sequence. Neuroimage. 2010;53:506–514. doi: 10.1016/j.neuroimage.2010.06.024. [DOI] [PubMed] [Google Scholar]
- Malykhin NV, Carter R, Seres P, Coupland NJ. Structural changes in the hippocampus in major depressive disorder: contributions of disease and treatment. J Psychiatry Neurosci. 2010;35:337–343. doi: 10.1503/jpn.100002. [DOI] [PMC free article] [PubMed] [Google Scholar]
- Malykhin NV, Lebel RM, Coupland NJ, Wilman AH, Carter RC. In vivo quantification of hippocampal subfields using 4.7 T fast spin echo imaging. Neuroimage. 2010b;49:1224–1230. doi: 10.1016/j.neuroimage.2009.09.042. [DOI] [PubMed] [Google Scholar]
- Mielke MM, Okonkwo OC, Oishi K, Mori S, Tighe S, Miller MI, Ceritoglu C, Brown T, Albert M, Lyketsos CG. Fornix integrity and hippocampal volume predict memory decline and progression to Alzheimer's disease. Alzheimers Dement. 2012;8:105–113. doi: 10.1016/j.jalz.2011.05.2416. [DOI] [PMC free article] [PubMed] [Google Scholar]
- Mueller SG, Laxer KD, Barakos J, Cheong I, Garcia P, Weiner MW. Subfield atrophy pattern in temporal lobe epilepsy with and without mesial sclerosis detected by high-resolution MRI at 4 Tesla: preliminary results. Epilepsia. 2009;50:1474–1483. doi: 10.1111/j.1528-1167.2009.02010.x. [DOI] [PMC free article] [PubMed] [Google Scholar]
- Mueller SG, Schuff N, Yaffe K, Madison C, Miller B, Weiner MW. Hippocampal atrophy patterns in mild cognitive impairment and Alzheimer's disease. Hum Brain Mapp. 2010;31:1339–1347. doi: 10.1002/hbm.20934. [DOI] [PMC free article] [PubMed] [Google Scholar]
- Mueller SG, Stables L, Du AT, Schuff N, Truran D, Cashdollar N, Weiner MW. Measurement of hippocampal subfields and age-related changes with high resolution MRI at 4T. Neurobiol Aging. 2007;28:719–726. doi: 10.1016/j.neurobiolaging.2006.03.007. [DOI] [PMC free article] [PubMed] [Google Scholar]
- Mueller SG, Weiner MW. Selective effect of age, Apo e4, and Alzheimer's disease on hippocampal subfields. Hippocampus. 2009;19:558–564. doi: 10.1002/hipo.20614. [DOI] [PMC free article] [PubMed] [Google Scholar]
- Nadel L, Hoscheidt S, Ryan LR. Spatial cognition and the hippocampus: the anterior-posterior axis. J Cogn Neurosci. 2013;25:22–28. doi: 10.1162/jocn_a_00313. [DOI] [PubMed] [Google Scholar]
- Narr KL, Thompson PM, Szeszko P, Robinson D, Jang S, Woods RP, Kim S, Hayashi KM, Asunction D, Toga AW, Bilder RM. Regional specificity of hippocampal volume reductions in first-episode schizophrenia. Neuroimage. 2004;21:1563–1575. doi: 10.1016/j.neuroimage.2003.11.011. [DOI] [PubMed] [Google Scholar]
- Neylan TC, Mueller SG, Wang Z, Metzler TJ, Lenoci M, Truran D, Marmar CR, Weiner MW, Schuff N. Insomnia severity is associated with a decreased volume of the CA3/dentate gyrus hippocampal subfield. Biol Psychiatry. 2010;68:494–496. doi: 10.1016/j.biopsych.2010.04.035. [DOI] [PMC free article] [PubMed] [Google Scholar]
- O'Mara S. The subiculum: what it does, what it might do, and what neuroanatomy has yet to tell us. J Anat. 2005;207:271–282. doi: 10.1111/j.1469-7580.2005.00446.x. [DOI] [PMC free article] [PubMed] [Google Scholar]
- Pedraza O, Bowers D, Gilmore R. Asymmetry of the hippocampus and amygdale in MRI volumetric measurements of normal adults. J Int Neuropsychol Soc. 2004;10:664–678. doi: 10.1017/S1355617704105080. [DOI] [PubMed] [Google Scholar]
- Pipitone J, Park MT, Winterburn J, Lett TA, Lerch JP, Pruessner JC, Lepage M, Voineskos AN, Chakravarty M the Alzheimer’s Disease Neuroimaging Initiative. Multi-atlas segmentation of the whole hippocampus and subfields using multiple automatically generated templates. Neuroimage. doi: 10.1016/j.neuroimage.2014.04.054. (in press) [DOI] [PubMed] [Google Scholar]
- Poppenk J, Evensmoen HR, Moscovitch M, Nadel L. Long-axis specialization of the human hippocampus. Trends Cogn Sci. 2013;17:230–240. doi: 10.1016/j.tics.2013.03.005. [DOI] [PubMed] [Google Scholar]
- Rajah MN, Kromas M, Han JE, Pruessner JC. Group differences in anterior hippocampal volume and in the retrieval of spatial and temporal context memory in healthy young versus older adults. Neuropsychologia. 2010;48:4020–4030. doi: 10.1016/j.neuropsychologia.2010.10.010. [DOI] [PubMed] [Google Scholar]
- Save E, Poucet B. Hippocampal-parietal cortical interactions in spatial cognition. Hippocampus. 2000;10:491–499. doi: 10.1002/1098-1063(2000)10:4<491::AID-HIPO16>3.0.CO;2-0. [DOI] [PubMed] [Google Scholar]
- Sicotte NL, Kern KC, Giesser BS, Arshanapalli A, Schultz A, Montag M, Wang H, Bookheimer SY. Regional hippocampal atrophy in multiple sclerosis. Brain. 2008;131:1134–1141. doi: 10.1093/brain/awn030. [DOI] [PubMed] [Google Scholar]
- Strange BA, Dolan RJ. Adaptive anterior hippocampal responses to oddball stimuli. Hippocampus. 2001;11:690–698. doi: 10.1002/hipo.1084. [DOI] [PubMed] [Google Scholar]
- Strange BA, Fletcher PC, Henson RN, Friston KJ, Dolan RJ. Segregating the functions of human hippocampus. Proc Natl Acad Sci USA. 1999;96:4034–4039. doi: 10.1073/pnas.96.7.4034. [DOI] [PMC free article] [PubMed] [Google Scholar]
- Szeszko PR, Betensky JD, Mentschel C, Gunduz-Bruce H, Lencz T, Ashtari M, Malhotra AK, Bilder RM. Increased stress and smaller anterior hippocampal volume. Neuroreport. 2006;17(17):1825–1828. doi: 10.1097/01.wnr.0000246322.58814.b8. [DOI] [PubMed] [Google Scholar]
- Szeszko PR, Goldberg E, Gunduz-Bruce H, Ashtari M, Robinson D, Malhotra AK, Lencz T, Bates J, Crandall DT, Kane JM, Bilder RM. Smaller anterior hippocampal formation volume in antipsychotic-naïve patients with first-episode schizophrenia. Am J Psychiatry. 2003;160:2190–2197. doi: 10.1176/appi.ajp.160.12.2190. [DOI] [PubMed] [Google Scholar]
- Szeszko PR, Strous RD, Goldman RS, Ashtari M, Knuth KH, Lieberman JA, Bilder RM. Neuropsychological correlates of hippocampal volumes in patients experiencing a first episode of schizophrenia. Am J Psychiatry. 2002;159:217–226. doi: 10.1176/appi.ajp.159.2.217. [DOI] [PubMed] [Google Scholar]
- Tamminga CA, Stan AD, Wagner AD. The hippocampal formation in schizophrenia. Am J Psychiatry. 2010;167:1178–1193. doi: 10.1176/appi.ajp.2010.09081187. [DOI] [PubMed] [Google Scholar]
- Teicher MH, Anderson CM, Polcari A. Childhood maltreatment is associated with reduced volume in the hippocampal subfields CA3, dentate gyrus, and subiculum. Proc Natl Acad Sci USA. 2012;109:E563–E572. doi: 10.1073/pnas.1115396109. [DOI] [PMC free article] [PubMed] [Google Scholar]
- Theysohn JM, Kraff O, Maderwald S, Schlamann MU, de Greiff A, Forsting M, Ladd SC, Ladd ME, Gizewski ER. The human hippocampus at 7 T – in vivo MRI. Hippocampus. 2009;19:1–7. doi: 10.1002/hipo.20487. [DOI] [PubMed] [Google Scholar]
- Thomas BP, Welch EB, Niederhauser BD, Whetsell WO, Jr, Anderson AW, Gore JC, Avison MJ, Creasy JL. High-resolution 7T MRI of the human hippocampus in vivo. J Magn Reson Imaging. 2008;28:1266–1272. doi: 10.1002/jmri.21576. [DOI] [PMC free article] [PubMed] [Google Scholar]
- Van Leemput K, Bakkour A, Benner T, Wiggins G, Wald LL, Augustinack J, Dickerson BC, Golland P, Fischl B. Automated segmentation of hippocampal subfields from ultra-high resolution in vivo MRI. Hippocampus. 2009;19:549–557. doi: 10.1002/hipo.20615. [DOI] [PMC free article] [PubMed] [Google Scholar]
- Wang Z, Neylan TC, Mueller SG, Lenoci M, Truran D, Marmar CR, Weiner MW, Schuff N. Magnetic resonance imaging of hippocampal subfields in posttraumatic stress disorder. Arch Gen Psychiatry. 2010;67:296–303. doi: 10.1001/archgenpsychiatry.2009.205. [DOI] [PMC free article] [PubMed] [Google Scholar]
- Wellington RL, Bilder RM, Napolitano B, Szeszko PR. Effects of age on prefrontal subregions and hippocampal volumes in young and middle-aged healthy humans. Hum Brain Mapp. 2013;34(9):2129–2140. doi: 10.1002/hbm.22054. [DOI] [PMC free article] [PubMed] [Google Scholar]
- Whitwell JL, Wiste HJ, Weigand SD, Rocca WA, Knopman DS, Roberts RO, Boeve BF, Petersen RC, Jack CR, Jr Alzheimer Disease Neuroimaging Initiative. Comparison of imaging biomarkers in the Alzheimer Disease Neuroimaging Initiative and the Mayo Clinic Study of Aging. Arch Neurol. 2012;69:614–622. doi: 10.1001/archneurol.2011.3029. [DOI] [PMC free article] [PubMed] [Google Scholar]
- Wieshmann UC, Symms MR, Mottershead JP, MacManus DG, Barker GJ, Tofts PS, Revesz T, Stevens JM, Shorvon SD. Hippocampal layers on high resolution magnetic resonance images: real or imaginary? J Anat. 1999;195:131–135. doi: 10.1046/j.1469-7580.1999.19510131.x. [DOI] [PMC free article] [PubMed] [Google Scholar]
- Winterburn JL, Pruessner JC, Chavez S, Schira MM, Lobaugh NJ, Voineskos AN, Chakravarty MM. A novel in vivo atlas of human hippocampal subfields using high-resolution 3 T magnetic resonance imaging. Neuroimage. 2013;74:254–265. doi: 10.1016/j.neuroimage.2013.02.003. [DOI] [PubMed] [Google Scholar]
- Witthaus H, Mendes U, Brüne M, Özgürdal S, Bohner G, Gudlowski Y, Kalus P, Andreasen N, Heinz A, Klingebiel R, Juckel G. Hippocampal subdivision and amygdalar volumes in patient in an at-risk mental state for schizophrenia. J Psychiatry Neurosci. 2010;35:33–40. doi: 10.1503/jpn.090013. [DOI] [PMC free article] [PubMed] [Google Scholar]
- Woolard AA, Heckers S. Anatomical and functional correlates of human hippocampal volume asymmetry. Psychiatry Res. 2012;201:48–53. doi: 10.1016/j.pscychresns.2011.07.016. [DOI] [PMC free article] [PubMed] [Google Scholar]
- Xie J, Alcantara D, Amenta N, Fletcher E, Martinez O, Persianinova M, DeCarli C, Carmichael O. Spatially localized hippocampal shape analysis in late-life cognitive decline. Hippocampus. 2009;19:526–532. doi: 10.1002/hipo.20618. [DOI] [PMC free article] [PubMed] [Google Scholar]
- Yushkevich PA, Avants BB, Pluta J, Das S, Minkoff D, Mechanic-Hamilton D, Glynn S, Pickup S, Liu W, Gee JC, Grossman M, Detre JA. A high-resolution computational atlas of the human hippocampus from post-mortem magnetic resonance imaging at 9.4 T. Neuroimage. 2009;44:385–398. doi: 10.1016/j.neuroimage.2008.08.04. [DOI] [PMC free article] [PubMed] [Google Scholar]
- Yushkevich PA, Piven J, Hazlett HC, Smith RG, Ho S, Gee JC, Gerig G. User-guided 3D active contour segmentation of anatomical structures: significantly improved efficiency and reliability. Neuroimage. 2006;31:1116–1128. doi: 10.1016/j.neuroimage.2006.01.015. [DOI] [PubMed] [Google Scholar]
- Yushkevich PA, Wang H, Pluta J, Das SR, Craige C, Avants BB, Weiner MW, Mueller S. Nearly automatic segmentation of hippocampal subfields in vivo focal T2-weighted MRI. Neuroimage. 2010;53:1208–1224. doi: 10.1016/j.neuroimage.2010.06.040. [DOI] [PMC free article] [PubMed] [Google Scholar]
- Zierhut KC, Graßmann R, Kaufmann J, Steiner J, Bogerts B, Schiltz K. Hippocampal CA1 deformity is related to symptom severity and antipsychotic dosage in schizophrenia. Brain. 2013;136:804–814. doi: 10.1093/brain/aws335. [DOI] [PubMed] [Google Scholar]
- Zierhut KC, Schulte-Kemna A, Kaufmann J, Steiner J, Bogerts B, Schiltz K. Distinct structural alterations independently contributing to working memory deficits and symptomatology in paranoid schizophrenia. Cortex. 2013b;49:1063–1072. doi: 10.1016/j.cortex.2012.08.027. [DOI] [PubMed] [Google Scholar]