Abstract
Mathematical modeling is a powerful tool for unraveling the complexities of the molecular regulatory networks underlying all aspects of cell physiology. To support this claim, we review our experiences modeling the cyclin-dependent kinase (CDK) network that controls events of the eukaryotic cell cycle. The model was derived from classic experiments on the biochemistry and molecular genetics of CDKs and their partner proteins. Because the dynamical properties of CDK activity depend in large part on positive and negative feedback loops in the regulatory network, it is difficult to predict its behavior by intuitive reasoning alone. Mathematical modeling is the correct tool for reliably determining the properties of the network in comparison to observed properties of dividing cells and for predicting the behavior of the control system under novel conditions. In this review we describe six unexpected predictions of our 1993 model of the CDK control system in frog egg extracts and the remarkable experiments, performed much later, that verified all six predictions. The dynamical properties of the CDK network are consequences of feedback signals and ultrasensitive responses of regulatory proteins to CDK activity, and we describe the experimental evidence for the predicted ultrasensitivity. This case study illustrates the novel insights that mathematical modeling, analysis and simulation can provide cell physiologists, and it points the way to a new “dynamical perspective” on molecular cell biology.
Keywords: Mathematical model, cell cycle control, M-phase promoting factor, bifurcation theory
Introduction
Although mathematical modeling of biological interactions played important roles in developing scientific theories of population biology, genetics, evolutionary theory, neuroscience, and organismal physiology in the 20th century, it was ignored for the most part in the areas of molecular, cell and developmental biology. To be sure, there were early efforts to develop mathematical theories of bacterial operons, allosteric regulation, circadian rhythms, and embryonic pattern formation, but these efforts (as useful as they may seem to regular readers of this journal) never percolated into the zeitgeist (or textbooks) of molecular cell biology. This neglect is understandable, perhaps, in the heady atmosphere of 1980-2000, when new tools for manipulating DNA enabled molecular geneticists to identify and characterize the genes and proteins that underlie all basic features of cell physiology. Molecular cell biologists were too busy cloning genes to pay much attention to the few theoreticians who were trying to use mathematical models to understand the dynamical properties of the complex regulatory networks being uncovered by the experimentalists.
The golden age of molecular cell biology culminated in the publication of the “Millennium Issue” of Cell (Vol. 100, No. 1, 7 January 2000), in which giants of the field summarized the astounding progress made on many fronts over the previous twenty years. Amid the triumphalist themes of this issue were occasional hints of something new on the horizon, as exemplified by a quote from Paul Nurse (2000): “Perhaps a proper understanding of the complex regulatory networks making up cellular systems like the cell cycle will require a shift from common sense thinking…to a more abstract world, more readily analyzable in terms of mathematics.”
The shift was already underway; thanks to a new focus on “computational biology” at the National Institute of General Medical Sciences, under the direction of Marvin Cassman at the time. As money and attention began to turn toward mathematical and computational approaches to molecular cell biology, the initial benign neglect of experimentalists turned to outright hostility from some corners. However, within the last few years the battles have subsided, and “computational cell biology” is now firmly entrenched in academic and research institutions around the globe.
In this review article, we present an example of this new way of thinking about molecular regulatory systems in cell physiology. Our example concerns the cyclins and kinases (the genes and proteins) that govern progression through the cell cycle in frog eggs and early embryos and in frog egg extracts. In the process of describing our mathematical theory of this control system, we hope to answer the questions: what is computational cell biology? And what good is it?
Molecular Regulation of Cell Cycle Progression
The DNA replication-division cycle is the sequence of events by which a cell replicates its genome (making exact copies—called sister chromatids—of each DNA molecule) and then partitions the sister chromatids to two daughter cells at division, so that each daughter receives one and only one copy of every chromosome. The DNA replication-division cycle is usually coordinated with the cell growth-division cycle, in which all other components of the cell (proteins, RNAs, organelles, etc.) are doubled in number and divided more-or-less evenly to the two daughter cells (Mitchison 2003). But we are considering cases of the control of DNA replication and division in non-growing cells (frog eggs and extracts), so we shall ignore issues relating cell growth to DNA replication.
The DNA replication-division cycle (the “cell cycle” henceforth) is usually subdivided into four phases: G1 (unreplicated chromosomes), S (DNA synthesis), G2 (replicated chromosomes) and M (mitosis, i.e., nuclear and cell division). The combined phases of G1+S+G2 are sometimes referred to simply as “interphase”. During early embryonic cell division cycles, G1 and G2 phases are often very short, so we shall refer to embryonic cell cycles as alternating between interphase (the phase of DNA synthesis) and mitosis (the phase of chromosome partitioning and cell division).
A fundamental question confronting cell biologists of the 1970s and 1980s concerned the molecular mechanisms governing this alternation between interphase and mitosis. What molecular events triggered DNA synthesis followed by entry into mitosis? What molecular events were responsible for exit from mitosis (nuclear and cell division) and return to interphase? These questions were attacked on two fronts: by biochemical methods and genetic analysis.
M-phase promoting factor
On the biochemical front, a major breakthrough was the identification by Masui and Markert (1971) of a biochemical factor that promotes maturation of frog oocytes. Frog ovaries contain copious quantities of immature oocytes, which are arrested in G2 phase of the first meiotic cell cycle. In response to progesterone, a hundred or more of these oocytes undergo a maturation process, proceeding through meiosis I and into meiosis II, arresting at metaphase of the second meiotic cycle. These mature oocytes are ready for fertilization, which induces them to enter the mitotic cell cycles of the early embryo (the fertilized egg). Masui and Markert discovered that maturation can be induced, in the absence of progesterone, by extracts prepared from mature oocytes. Not knowing the identity of this component of mature oocytes that induces maturation of immature oocytes, they called it “maturation promoting factor,” or MPF for short.
Picking up on this theme, Marc Kirschner and his collaborators showed that MPF activity is low in interphase and high in mitosis during the mitotic cycles of early embryos (Gerhart et al. 1984). Because MPF peaks at both meiotic and mitotic metaphase, its meaning has changed to “M-phase promoting factor.” What precisely is this mysterious factor? The hunt was on among biochemists, but MPF proved notoriously difficult to purify.
Cell division cycle genes
Meanwhile, Leland Hartwell was taking a different approach (Hartwell et al. 1970, Hartwell et al. 1974). He proposed a screen to identify genes that are necessary for successful completion of the cell cycle in a simple eukaryotic cell (budding yeast) that is particularly amenable to genetic analysis. After mutagenizing yeast cells, Hartwell et al. streaked them out on a petri dish with nutrients, made a replicate plate, and then cultured one plate at 23°C and the other plate at 37°C. Hartwell was looking for cells that could form colonies at 23°C (the permissive temperature) but not at 37°C (the restrictive temperature); and, furthermore, at the restrictive temperature the mutant cells should arrest uniformly at a particular stage of the cell cycle (e.g., with or without a bud; before, during or after S phase; in a particular stage of mitosis). Mutant cells exhibiting these phenotypic traits he called “cell division cycle” mutants, and, by genetic crosses, he identified ~50 CDC genes (CDC1, CDC2, …). Each gene was characterized by the stage of the cell cycle in which cells, carrying the temperature sensitive allele of the gene (cdc1, cdc2, …), arrested at 37°C. In this way, Hartwell et al. could assign to each CDC gene its own particular execution point, i.e., the cell cycle event where that particular gene plays a necessary role. The earliest event they called “Start”, and CDC28 was identified as a crucial player in the Start transition.
A few years later, Paul Nurse, at the time a postdoc in Murdoch Mitchison’s lab in Edinburgh, Scotland, repeated Hartwell’s genetic analysis in fission yeast, a distant relative of budding yeast. Nurse identified ~50 cdc genes in fission yeast, with the added twist that cdcts mutant cells should continue to grow at the restrictive temperature (Nurse et al. 1976). (Nurse wanted to eliminate from consideration any mutations that interfered with cell growth.) In the process of identifying cdc mutations in fission yeast, Nurse stumbled upon a mutant strain that grows and divides quite happily but at an unusually small size, about half the size of wild-type cells (Nurse 1975). He called this characteristic the “wee” phenotype (Scottish for “small”), and he showed that mutations of a single gene, wee1, are primarily responsible for the phenotype. (Fission yeast cells are rod-shaped. Wild-type cells, wee1+, divide at 14 μm in length; mutant cells, wee1-, divide at 7 μm in length.) The significance of the wee1+ gene is that it appears to be involved in regulation of the cell division cycle rather than in the machinery of DNA replication and mitosis.
Using standard methods of yeast genetics, Nurse found two cdc genes that interact with wee1+, namely cdc2+ and cdc25+ (Nurse 1985). The proteins encoded by wee1+ and cdc25+ (call them Wee1 and Cdc25) somehow measure cell length, inhibiting mitosis and cell division if a cell is too small (the apparent role of Wee1), or promoting mitosis and cell division when a cell grows large enough (the apparent role of Cdc25). The genetic evidence suggested that Wee1 and Cdc25 act by inhibiting and activating Cdc2, respectively.
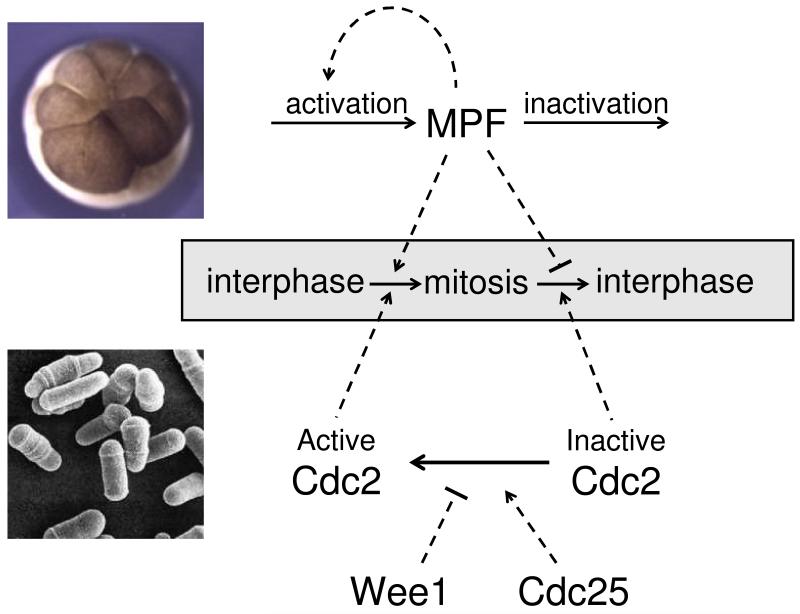
By this point in time (late 1970s), the biochemical and genetic evidences were suggesting two very different views of cell cycle regulation, as illustrated in Figure 1.
Figure 1. Two views of cell cycle regulation circa 1980.
Top: Biochemical studies of frog eggs focused on the role of M-phase promoting factor (MPF) in driving cells from interphase (DNA synthesis) into mitosis. Injection of active MPF into cells can stimulate premature entry into M phase. MPF activity disappears as cells exit mitosis and return to interphase. Bottom: Genetic studies in fission yeast focused on the roles of three genes in controlling the transitions between interphase and mitosis. The cdc2 gene encodes a protein (Cdc2) that is a dosage-independent initiator of mitosis. The wee1 and cdc25genes encode proteins that inhibit and activate Cdc2, respectively, in dosage-dependent pathways. Overexpression of wee1 delays mitosis until cells grow larger than normal, whereas overexpression of cdc25induces cells to divide at a smaller size.
Discovery of cyclin proteins
In the early 1980s, Tim Hunt was studying the proteins expressed in sea urchin embryos during their early synchronous mitotic cycles by the method of gel electrophoresis. Although most of the bands on his gels showed no change from one time to the next, two bands showed remarkable oscillations. As cells progressed though the cell cycle, these bands got darker and darker until, in late mitosis, the bands disappeared abruptly, only to accumulate again in the next cell cycle. Hunt called these proteins “cyclin A” and “cyclin B” (Evans et al. 1983).
Identification of gene products
In the 1980s, yeast cell cycle genes were cloned and characterized in labs run by Paul Nurse, Kim Nasmyth, and others. They found that cdc2+ in fission yeast and CDC28 in budding yeast both encode protein kinases, and, furthermore, that these protein kinases are functionally interchangeable between species (Beach et al. 1982). Wee1 was found to be a protein kinase as well (Russell & Nurse 1987), and Cdc25 a protein phosphatase (Russell & Nurse 1986, Gould et al. 1990). Wee1 and Cdc25 were determined to act by phosphorylating and dephosphorylating Cdc2. The kinase activity of Cdc2 is inhibited by Wee1-dependent phosphorylation, and Cdc2 is activated when this inhibitory phosphate group is removed by Cdc25.
Identification of MPF
In 1988, James Maller’s team of protein biochemists succeeded in purifying MPF (Lohka et al. 1988). At the final step of the purification, MPF activity was associated with two proteins of apparent molecular weights 32 kD and 44 kD. Using antibodies supplied by Nurse and Hunt, Maller quickly determined that the smaller protein was Cdc2 and the larger protein was cyclin B (Dunphy et al. 1988, Gautier et al. 1988, Gautier et al. 1990). MPF was now recognized as a heterodimeric protein kinase, consisting of a catalytic subunit (Cdc2) and a regulatory subunit (cyclin B). The yeast proteins, Cdc2 and Cdc28, were renamed Cdk1 (cyclin-dependent kinase) in recognition of their dependence on binding to a cyclin partner to become active kinases. Nonetheless, in the frog-egg cell-cycle literature it is still common to refer to the kinase subunit of MPF as Cdc2, and we shall use Cdk1 and Cdc2 interchangeably.
Frog egg extracts
In 1989, Murray and Kirschner (1989) described a method for making frog egg extracts that could support repeated cycles of DNA synthesis and nuclear division in vitro, thereby creating a powerful tool for studying the biochemistry of MPF activation and inactivation during mitotic nuclear division cycles. They demonstrated that progression of an extract through interphase (DNA synthesis) and into mitosis is dependent on the synthesis of only one protein, cyclin B; and that exit from mitosis and return to interphase is driven by the proteolysis of cyclin B by the ubiquitin-proteasome system. (The proteasome is an organelle that degrades proteins that have been polyubiquitinated. Ubiquitin is a small peptide that is conjugated to proteins singled out for destruction. The ubiquitin-conjugating enzyme that labels cyclin B for destruction during anaphase and telophase is called the “Anaphase Promoting Complex.” The APC requires an auxiliary protein, Cdc20, to target its activity toward cyclin B as nuclei complete the division process.)
Using frog egg extracts, William Dunphy and other investigators (Kumagai & Dunphy 1992, Tang et al. 1993, Mueller et al. 1995) showed that Wee1 and Cdc25 become phosphorylated as MPF is activated and extracts enter mitosis. The evidence suggested that Wee1 is inactivated by Cdc2-dependent phosphorylation and that Cdc25 is activated by Cdc2-dependent phosphorylation.
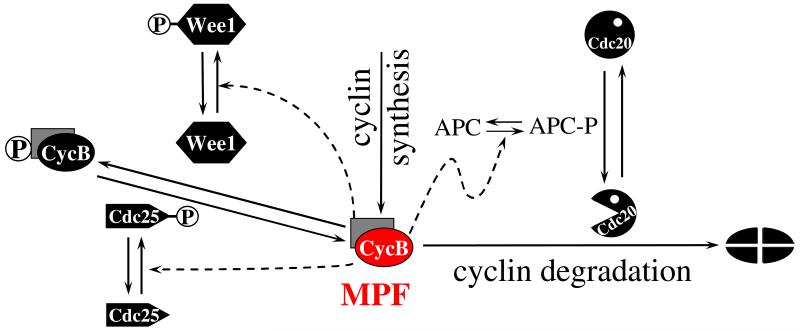
By 1990 a picture of MPF regulation was beginning to emerge from these separate lines of inquiry (Nurse 1990); see Figure 2. Notice, in particular, that MPF and Cdc25 are engaged in a positive feedback loop (each protein activates the other) and that MPF and Wee1 are engaged in a double-negative feedback loop (each protein inactivates the other). Furthermore, MPF and Cdc20 are engaged in a negative feedback loop (MPF activates Cdc20 indirectly through the APC, but the APC:Cdc20 complex inactivates MPF by labeling its cyclin subunit for proteolysis). These feedback loops play significant roles in the dynamics of the MPF control system, but it is not intuitively obvious exactly what their consequences may be. Is it obvious, for example, that the reaction network in Figure 2 is consistent with all the facts (as they were known at the time) about cell cycle regulation in early embyros and yeast cell mutants? Might a careful examination of the dynamical properties of this control system predict some unexpected new properties of MPF-driven regulation of cell cycle events? To answer these sorts of questions requires careful examination of a proper mathematical model of the control system.
Figure 2. Unified view of cell cycle regulation circa 1990 (Nurse 1990).
M-phase promoting factor (MPF) was recognized to be a heterodimer of Cdc2 (kinase subunit; gray rectangle) and cyclin B (regulatory/targeting subunit; red oval). Because kinase subunits are present in excess, MPF activity can be raised or lowered by controlling the availability of cyclin subunits. In frog eggs and fission yeast cells, this control is exercised primarily at the level of protein degradation, by controlling the activity of the APC:Cdc20 ubiquitination machinery. Alternatively, MPF activity can be inhibited by Wee1-catalyzed phosphorylation of Cdc2, and MPF activity can be restored by Cdc25-catalyzed removal of the inhibitory phosphate group. Wee1 and Cdc25 are, in turn, phosphorylated by active MPF. Phosphorylation of Wee1 decreases its kinase activity, whereas phosphorylation of Cdc25 increases its phosphatase activity.
Mathematical Models of the MPF Control System
As the picture in Figure 2 was emerging, several early attempts to model the MPF control system were published by Hyver & Le Guyader (1990), Norel & Agur (1991), Goldbeter (1991) and Tyson (1991). Each of these models had its own characteristic strengths and weaknesses, but we think it is fair to say that they were replaced by our 1993 model (Novak & Tyson 1993a, Novak & Tyson 1993b), which provided a more comprehensive and accurate description of cell cycle control. The 1993 model applies equally well to MPF fluctuations in frog eggs and extracts (Novak & Tyson 1993b) and to mutant phenotypes of fission yeast (Novak & Tyson 1995). It is this model that we shall focus on.
Using standard principles of biochemical kinetics (as in the earlier studies just cited), we cast Figure 2 into a set of nonlinear ordinary differential equations (ODEs) for the concentrations (or “activities”) of the constituent proteins (see Table I). By a combination of phase plane analysis, bifurcation theory, and numerical simulations, we studied this control system in great detail, with special attention to quantitative reckoning of the experimental facts. We will not review this evidence for the validity of the model but instead focus on the predictions derived from the model.
Table I. The Novak-Tyson model of the MPF control system in frog egg extracts (Fig. 2).
| u(t) = active MPF | |||
| v(t) = total cyclin | |||
|
| |||
| kapc(u) = activity of APC:Cdc20 | |||
| kwee(u) = activity of Wee1 | |||
| k25(u) = activity of Cdc25 | |||
| Goldbeter-Koshland Function | |||
|
| |||
| k1 = 0.018 min−1 | θ = 0.3 | J = 0.02 | |
| k25′ = 0.04 min−1 | k25″ = 40 min−1 | kwee′ = 0 | kwee″ = 3 min−1 |
| kapc′ = 0.03 min−1 | kapc″ = 0 | Bistability | |
| kapc′ = 0.01 min−1 | kapc″ = 1 min−1 | Oscillations | |
Cyclin thresholds
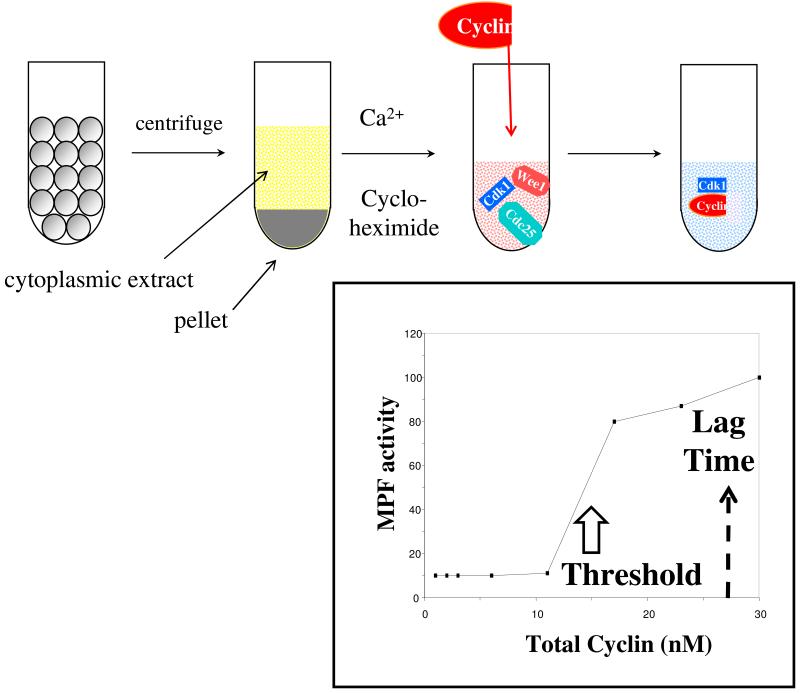
In 1990, Solomon et al. (1990) published a paper on the activation of Cdk1 by binding to cyclin. They used “interphase arrested” frog egg extracts, which have been treated with a drug to block cyclin synthesis. Such extracts contain copious amounts of Cdk1, Wee1 and Cdc25, but they cannot activate Cdk1 because they lack cyclin B. By adding a known amount of a non-degradable form of cyclin B to interphase-arrested extracts, Solomon et al. could adjust the total concentration of cyclin B to any value and thereby determine how MPF activity depends on cyclin concentration. They found striking evidence for a distinct cyclin threshold for MPF activation (see Figure 3). If total cyclin concentration is 12 nM or less, then the extract exhibits a low (background) level of MPF activity; but at [total cyclin] ≈ 15 nM there is an abrupt jump to a high level of MPF activity, which increases steadily with additional cyclin added. Furthermore, Solomon et al. pointed out that there is a constant time lag of ~15 min from the moment of cyclin addition (above threshold) until the time of half-maximal activation of MPF.
Figure 3. Cyclin threshold for activation of MPF (Solomon et al. 1990).
Top: Solomon’s protocol for assaying the dependence of MPF activity on total cyclin concentration. Mature frog oocytes (arrested in meiosis II with high MPF activity) are crushed by centrifugation and the cytoplasmic components are separated from the debris. The addition of calcium ions to the extract activates APC:Cdc20, causing degradation of cyclin B and loss of MPF activity. The addition of cycloheximide (an inhibitor of protein synthesis) prevents de novo production of cyclin B from maternal stores of mRNA. This preparation is called an interphase-arrested extract. To such extracts Solomon added exogenously prepared cyclin B molecules that had been genetically engineered to lack the C-terminal amino acid sequence necessary for APC-induced proteolysis. In this way, Solomon created a cytoplasmic extract with a fixed and known concentration of cyclin B. These cyclin B molecules combined with endogenous Cdc2 molecules to form MPF heterodimers, which could be either active (unphosphorylated) or inactive (phosphorylated on the Cdc2 subunit by the action of Wee1 in the extract). Bottom: Solomon measured MPF activity as a function of total cyclin concentration in the extract. He observed a distinct cyclin threshold for MPF activation, at [total cyclin] ≈ 15 nM. For total cyclin concentrations well above this threshold, Solomon observed a time lag of ~15 min from the time of cyclin addition to the time when MPF activity reached 50% of its ultimate maximum activity.
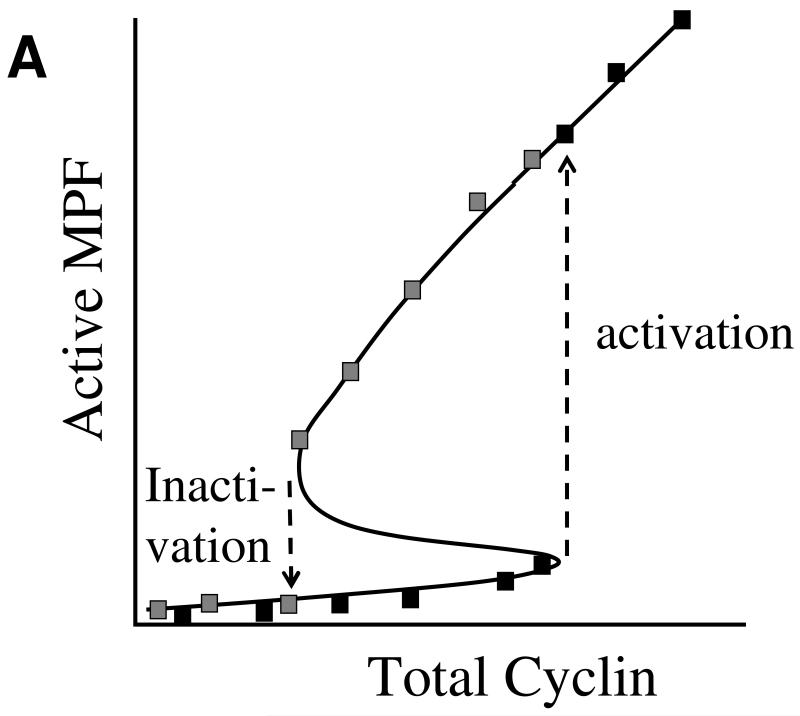
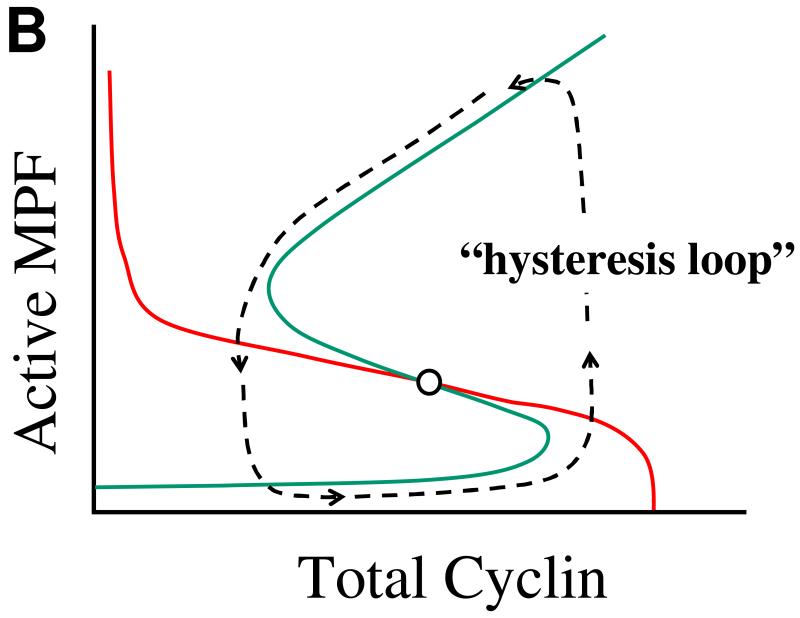
To account for Solomon’s observations, we removed cyclin synthesis and degradation from our model equations and considered only the phosphorylation and dephosphorylation of MPF by Wee1 and Cdc25. Looking for steady state solutions of these ODEs, we plotted a one-parameter bifurcation diagram of MPF activity as a function of total cyclin in the (simulated) extract (see Figure 4A). Because of the feedback loops in the control system, the bifurcation diagram shows a region of bistability for intermediate cyclin concentrations. The bistable region is bounded by two saddle-node bifurcations: one is a threshold for MPF activation (upon increasing cyclin concentration), and the other is a lower threshold for MPF inactivation (upon decreasing cyclin concentration). This lower threshold is a clear and non-intuitive prediction of the mathematical model.
Figure 4. The MPF bistable switch.
(A) The Novak-Tyson ODEs (Table 1) predict that MPF activity in an interphase-arrested frog egg extract may function as a bistable switch in response to the addition of a fixed amount of non-degradable cyclin B. For low levels of added cyclin, MPF activity is very small (the “off” state), whereas for high levels of cyclin, MPF activity is very large (the “on” state). Black (gray) squares: MPF activity as a function of total cyclin concentration if the extract starts in the off-state (on-state) and cyclin concentration is increased (decreased). For increasing cyclin concentrations, MPF activity turns on abruptly at the activation threshold (the upward pointing arrow). If the switch starts in the on-state, then the concentration of cyclin must be decreased below the inactivation threshold (the downward pointing arrow) in order to flip the switch back to the off-state. (B) In a cycling extract (without the addition of cycloheximide), endogenous (degradable) cyclin is synthesized from maternal mRNA in the extract and degraded by the APC-proteosome system in the extract. In this case, cyclin concentration is increasing when MPF activity is low and decreasing when MPF activity is large, and the dynamical system executes relaxation oscillations around a hysteresis loop. The blue and red curves are “nullclines” for MPF and cyclin, respectively (Novak & Tyson 1993a, Novak & Tyson 1993b).
Critical slowing down
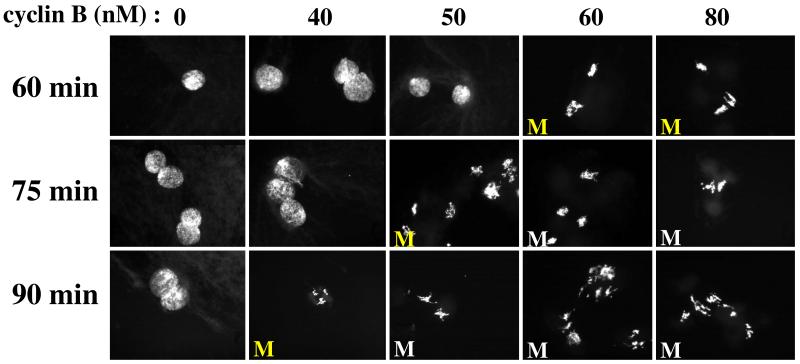
If one adds a supra-threshold amount of non-degradable cyclin to an interphase-arrested frog egg extract, the newly formed Cdk1:cyclin dimers are rapidly phosphorylated (inactivated) by Wee1 in the extract, and it takes ~15 min to engage the positive feedback loops and reactivate MPF (as observed by Solomon). But this is true only if the final concentration of cyclin is well above threshold. If the final concentration is only slightly above the threshold, then, according to the mathematical model, the lag time gets considerably longer than 15 min. In fact, the lag time becomes infinitely long as the cyclin concentration approaches the threshold from above. This phenomenon is well known in the theory of dynamical systems, where it is called “critical slowing down.” It is an inescapable consequence of the bistable character of the model, and it is in direct contradiction to the experimental evidence provided in Solomon’s paper.
Checkpoint function
It was a well-known fact at the time that the addition of unreplicated DNA to a frog egg extract delays the activation of MPF and the entry of nuclei into mitosis (Dasso & Newport 1990). We predicted that this “checkpoint” effect of unreplicated DNA operates by raising the threshold for cyclin-induced activation of MPF.
Spontaneous oscillations
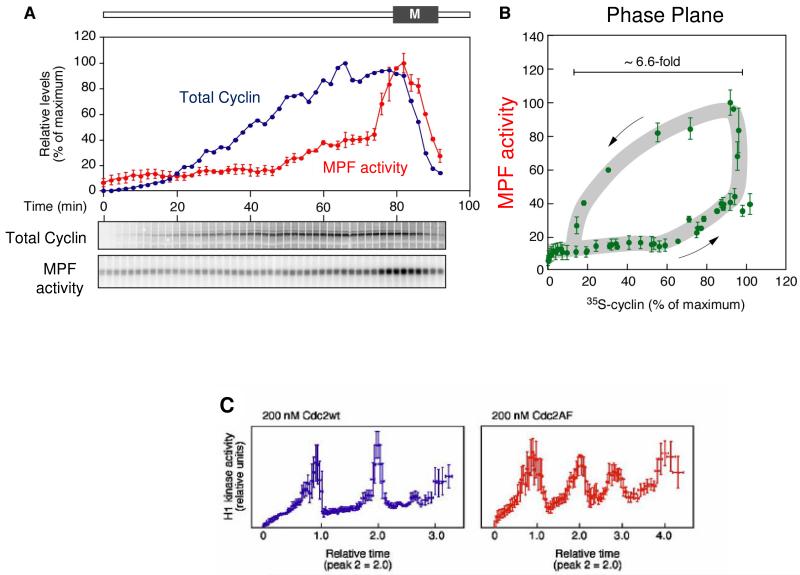
Next, we studied spontaneous oscillations of MPF in the model when cyclin is being synthesized and degraded. The model predicts (quite obviously, from a theoretical perspective) that MPF activity should exhibit “relaxation oscillations” around the bistable region of the bifurcation diagram (Figure 4B). The model also predicts that, if the positive feedback loops are compromised (by adding a non-phosphorylable form of Cdk1), then the control system might still oscillate due to the negative feedback loop through APC and Cdc20 (see Figure 2). Our numerical simulations of these oscillations showed that, in comparison to the relaxation oscillations in the presence of Cdk1 phosphorylation, the negative feedback oscillations should be faster, of lower amplitude, and more sinusoidal.
Propagating waves of MPF activity
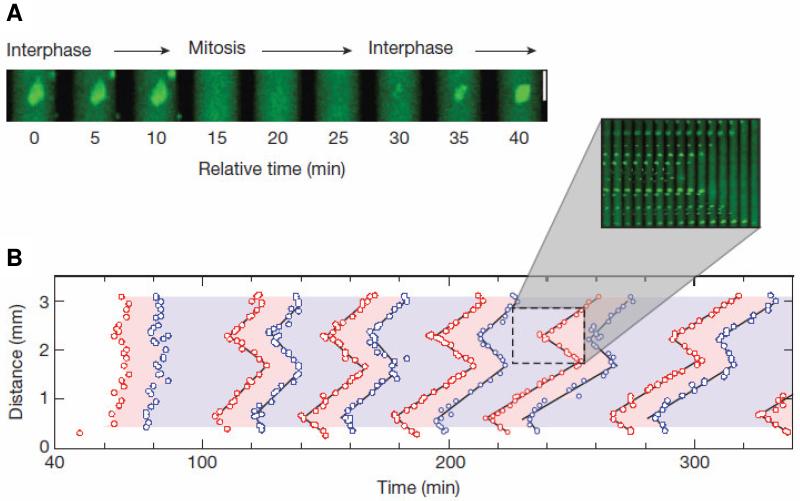
In a companion paper (Novak & Tyson 1993a), we pointed out that the MPF control system would support waves of MPF activation that propagate from one nucleus to surrounding nuclei in tissues that are not subdivided by cell membranes (“syncytial” tissues). Furthermore, by a back-of-an-envelope calculation, we predicted that these waves should propagate with a speed of ~50 μm/min. We drew attention to two obscure published reports of such waves in slime mold microplasmodia and in nuclear division cycles of fruit fly embryos. The clear prediction was that such waves should propagate in frog egg extracts, but such an experiment seemed technically impossible at the time.
For future reference, these predictions of the Novak-Tyson model are collected in Table II.
Table II. Predictions and confirmations of the Novak-Tyson model of MPF control in frog egg extracts.
| Prediction# | Confirmation | |
|---|---|---|
| 0 | Cyclin threshold for MPF activation | (Solomon et al. 1990) |
| 1 | Cyclin threshold for MPF inactivation | (Pomerening et al. 2003, Sha et al. 2003) |
| 2 | Critical slowing down of MPF activation | (Sha et al. 2003) |
| 3 | Elevated cyclin threshold by unreplicated DNA | (Sha et al. 2003) |
| 4 | Relaxation oscillations in cycling extracts | (Pomerening et al. 2005) |
| 5 | Sinusoidal oscillations in Cdc2AF extracts | (Pomerening et al. 2005) |
| 6 | Propagating wave of MPF activation | (Chang & Ferrell 2013) |
0 is a “postdiction”; 1-6 are predictions. Predictions 1-5 are made in Novak & Tyson (1993b), and prediction 6 is described in Novak & Tyson (1993a).
Experimental Confirmation of Model Predictions
All six predictions of the Novak-Tyson model have been confirmed in a paper from Jill Sible’s lab at Virginia Tech (Sha et al. 2003) and in an impressive series of papers from Jim Ferrell’s lab at Stanford (Pomerening et al. 2003, Pomerening et al. 2005, Chang & Ferrell 2013). In Figures 5-7 we reproduce three figures from Sha et al. (2003) that confirm predictions 1-3 in Table II. Similar results were reported by Pomerening et al. (2003) at about the same time. In Figure 8 we reproduce two figures from Pomerening et al. (2005) that confirm predictions 4-5 in Table II, and in Figure 9 we reproduce a figure from Chang & Ferrell (2013) that confirms prediction 6. See the figure legends for details.
Figure 5. Hysteresis in the activation and inactivation of MPF in frog egg extracts.
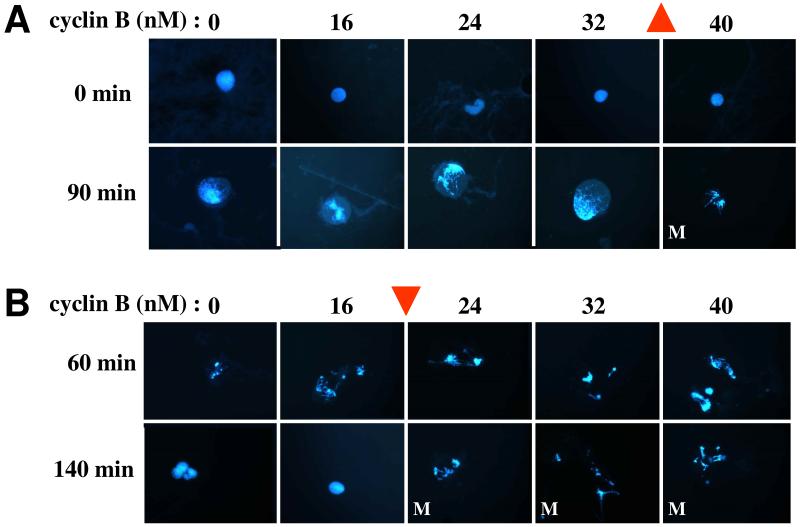
Images from Sha et al. (2003); used by permission. (A) Interphase-arrested frog egg extracts are prepared as in Fig. 3A. Sperm nuclei are added to the extract to report on MPF activity: in interphase the nuclei are compact with dispersed chromatin (stained blue by DAPI in the first row of fluorescent images). Furthermore, interphase nuclei have an intact nuclear membrane, which is clearly visible in phase contrast images (not shown). When the freshly prepared extract is in interphase, non-degradable cyclin B is added to separate aliquots in increasing amounts from 0 to 40 nM. Ninety minutes later, nuclei in the 40 nM aliquot have entered mitosis (condensed chromatin and dispersed nuclear membrane), but nuclei in the other aliquots are still in interphase. The cyclin threshold for MPF activation in this experiment is ~35 nM (up arrow). (B) Frog egg extracts are allowed to enter mitosis at t = 60 min, when separate aliquots are treated with cycloheximide (to block any further synthesis of cyclin B) and supplemented with increasing concentrations of non-degradable cyclin B. Because MPF activity is high in these extracts, the APC:Cdc20 machinery is active and the endogenously synthesized cyclin B is degraded. But the supplementary, non-degradable cyclin is left behind. By t = 140 min, nuclei in the 16 nM aliquot have returned to interphase, but nuclei in the 24 nM aliquot are still in mitosis. The cyclin threshold for MPF inactivation in this experiment is ~20 nM (down arrow). For total cyclin B concentration = 24 and 32 nM, the extract can persist stably in the low MPF steady state (panel A) or in the high MPF steady state (panel B), confirming the prediction of bistability and hysteresis in the MPF control system.
Figure 7. Unreplicated DNA raises the cyclin threshold for MPF activation in frog egg extracts.
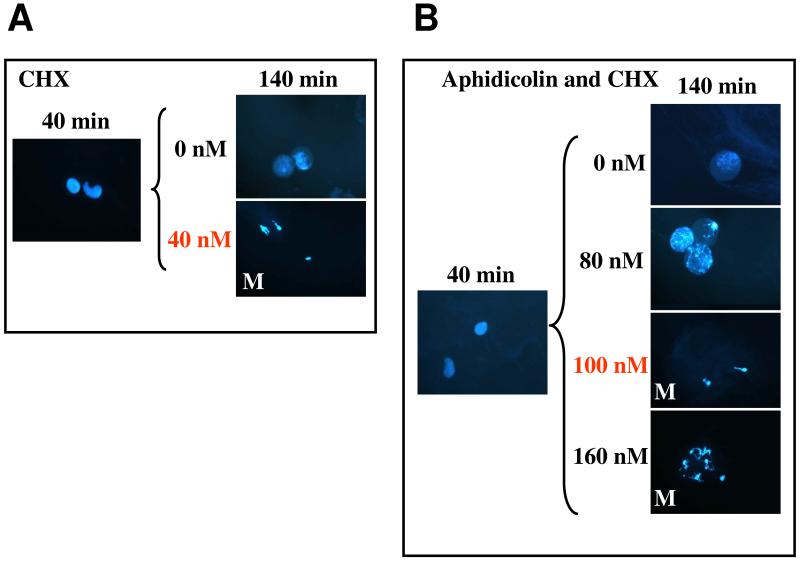
Images from Sha et al. (2003); used by permission. (A) Interphase arrested extracts are supplemented with 0 or 40 nM non-degradable cyclin B at t = 0 and checked for entry into mitosis at t = 40 and 140 min. The cyclin threshold for activation of MPF is less than 40 nM, as in Fig. 5 and 6. (B) Same as panel A, except that aphidicolin (an inhibitor of DNA synthesis) is added to the extract at t = 40 min. In the presence of unreplicated DNA, the cyclin threshold for MPF activation is raised to ~90 nM.
Figure 8. MPF oscillations in cycling extracts.
Data from Pomerening et al. (2005); used by permission. Frog egg cytoplasmic extracts are prepared without addition of either cycloheximide or exogenous non-degradable cyclin B. The extract synthesizes endogenous degradable cyclin B from maternal mRNA. Such extracts can exhibit three or more spontaneous cycles of MPF activation and inactivation. (A) Careful measurements of total cyclin concentration and MPF activity during the first mitotic cycle. (B) Replotting the data in panel A on the phase plane, MPF activity versus total cyclin concentration, parameterized by time (increasing in direction of arrows). The oscillation follows the hysteresis loop predicted in Fig. 4B. (C) MPF oscillations in cycling extracts supplemented with 200 nM Cdc2 protein that is phosphorylable (Cdc2wt, left) or non-phosphorylable (Cdc2AF, right). The Cdc2wt extract exhibits relaxation oscillations (spikes of MPF activation). As predicted by the model, oscillations in the Cdc2AF extract (with compromised positive feedback loops) are more sinusoidal, more rapid, and of lower amplitude.
Figure 9. Waves of MPF activation in spatially extended extracts.
Data from Chang & Ferrell (2013); used by permission. (A) Cycling frog egg extracts, supplemented with sperm nuclei, are dispersed in long, thin capillary tubes. During interphase, the nuclear envelope is intact and the nuclei fluoresce green. In mitosis, when the nuclear envelope breaks down, the fluorescence disperses through the cytoplasm. As nuclei complete mitosis, the nuclear envelope re-forms and the green nuclear fluorescence re-appears. In this preparation nuclei go through repetitive mitotic cycles with a period of ~40 min. (B) Space-time plots of nuclear entry into mitosis (red points) and exit from mitosis (blue points). Over time, mitotic entry and exit organizes into traveling waves (see inset). The slope of the space-time plots is the speed of these waves, ~60 μm/min.
Roles of Ultrasensitivity in Cell Cycle Regulation
The distinctive dynamical features of cell cycle regulation (bistability, oscillations, critical slowing down, wave propagation) are intimately associated with the positive and negative feedback loops in the network (Figure 2), operating through regulatory proteins (Wee1, Cdc25 and APC:Cdc20) that respond in an “ultrasensitive” way to CDK activity. Ultrasensitivity refers to a sigmoidal response to an input signal. The classical example is oxygen-loading of hemoglobin molecules as a function of oxygen tension in the lungs. In this case the sigmoidal response is due to cooperative binding of O2 molecules by the α and β subunits of the hemoglobin tetramer, and it is described by the well-known Hill function. However, ultrasensitive responses may arise for many reasons other than cooperativity.
In the original Novak-Tyson equations (Table I), ultrasensitivity is modeled in terms of “zero-order” ultrasensitivity, as originally envisioned by Goldbeter & Koshland (1981), who showed (quite surprisingly at the time) that, if (1) a protein X is phosphorylated by a kinase and dephosphorylated by a phosphatase, (2) the rates of these chemical modifications are governed by Michaelis-Menten kinetics, and (3) the total concentration of X is very much greater than the Michaelis constants of the kinase and phosphatase (so the chemical reactions are operating in the “zero-order” regime), then the fractional phosphorylation of X is an ultrasensitive function of the kinase-to-phosphatase ratio. Indeed, the fractional phosphorylation of X (at steady state) is given by a universal function, the “Goldbeter-Koshland function” G(u,θ,J) in Table 1, where u is the kinase-to-phosphatase ratio, θ is the switching threshold, and J is the ratio of Michaelis constant (assumed to be the same for kinase and phosphatase) to total concentration of X. It is easy to show, for J << 1, that G(u,θ,J) ≈ 0 for u < θ, and G(u,θ,J) ≈ 1 for u > θ. The Goldbeter-Koshland function in Table 1 provides the nonlinearity necessary to generate bistability and oscillations needed to account for the characteristic properties of cell cycle regulation in frog eggs and yeast cells.
Although zero-order ultrasensitivity seems natural for regulating the activities of Wee1, Cdc25 and APC, there is a serious snag. If MPF is the kinase that phosphorylates these proteins and if the kinase is saturated with its substrate (the zero-order regime), then MPF will not be available to bind to any other substrates that need to be phosphorylated in order to drive the cell into mitosis. Hence, early theories of cell cycle regulation left two open questions: Are the responses of these regulatory proteins indeed ultrasensitive? And, if so, what is the molecular basis of the observed ultrasensitivity?
The first question was answered affirmatively by James Ferrell’s research group in a series of careful experiments demonstrating ultrasensitive responses of Wee1 (Kim & Ferrell 2007), Cdc25 (Trunnell et al. 2011), and APC:Cdc20 (Yang & Ferrell 2013) to CDK activity in frog egg extracts. In Table III we collect data from Yang & Ferrell (2013) on the “effective” kinetic parameters for these three enzymes obtained by fitting the observed ultrasensitive signal-response curves to either a Hill function (parameters nH and EC50) or a Goldbeter-Koshland function (parameters J and θ). In our mathematical model of bistability and oscillations in frog egg extracts (Table I), we have used values of J and θ consistent with these experiments.
Table III. Ultrasensitivity parameters# for regulatory proteins.
The values of nH and θ = EC50 come from Yang & Ferrell (2013).
| Protein | n H | θ | J | q |
|---|---|---|---|---|
| Wee1 | 4 | 0.23 | 0.1 | 3 |
| Cdc25 | 11 | 0.31 | 0.02 | 6 |
| APC:Cdc20 | 11 | 0.33 | 0.02 | 6 |
nH = effective exponent in Hill function, θ = switching threshold in theoretical functions = EC50 in experiments, J = effective Michaelis constant in Goldbeter-Koshland function, q = parameter in multi-site phosphorylation function (for N = 10).
To answer the second question, we must take into account the fact that these regulatory proteins (and most other substrates of MPF) are phosphorylated on multiple sites (5-15 sites of phosphorylation) (Kumagai & Dunphy 1992, Mueller et al. 1995). In a number of papers, theoretical biologists have pointed out that multi-site phosphorylation can lead to an ultrasensitive dependence of the fractional phosphorylation of substrate molecules on the kinase-to-phosphatase ratio (Yang et al. 2004, Gunawardena 2005, Salazar & Hofer 2007, Salazar & Hofer 2009, Kapuy et al. 2009). If N = total number of phosphorylation sites, u = kinase activity, θ = phosphatase activity, and at least q+1 sites must be phosphorylated to activate the regulatory protein, then the fractional activity of the protein, as a function of the kinase-to-phosphatase ratio, is (Kapuy et al. 2009)
which is a sigmoidal function of u, similar to a Hill function or a Goldbeter-Koshland function. Indeed, the observed ultrasensitivity of Wee1, Cdc25 and APC:Cdc20 can also be described by this sigmoidal function for reasonable values of q and N, as indicated in Table III. In the theory of multi-site phosphorylation, all enzymatic reactions are assumed to be operating in the regime [substrate] << Michaelis constant, so MPF is never saturated by any of its substrates.
Although multi-site phosphorylation is a likely cause of ultrasensitivity in the cell cycle regulatory network, there are other possibilities, notably substrate competition, as described in Kim & Ferrell (2007) and Verdugo et al. (2013). Regardless of its molecular basis, we can consider “ultrasensitivity” as another prescient contribution to the field by mathematical modelers, notably Albert Goldbeter, which was later confirmed by careful quantitative measurements.
Other Mathematical Models of Cell Cycle Regulation
In the 1990s and 2000s many additional molecular details of the cell cycle control system in eukaryotes were revealed. This progress in experimental characterization of the system was accompanied by ever more comprehensive and accurate mathematical models, focused for the most part on the control systems in specific organisms, for example:
Fission yeast (Novak & Tyson 1997, Novak et al. 2001)
Budding yeast (Chen et al. 2000, Chen et al. 2004, Barberis et al. 2007, Faure et al. 2009, Barik et al. 2010, Brummer et al. 2010, Vinod et al. 2011, Zhang et al. 2011, Hancioglu & Tyson 2012)
Mammalian cells (Obeyesekere et al. 1994, Obeyesekere et al. 1995, Aguda 1999, Aguda & Tang 1999, Qu et al. 2003, Novak & Tyson 2004, Alfieri et al. 2009, Gerard & Goldbeter 2009, Toettcher et al. 2009, Singhania et al. 2011)
In addition, it is encouraging to see that many experimental studies of cell cycle regulation now incorporate mathematical modeling as an integral part of the project, as illustrated by several of works cited in our reference list.
A Dynamical Perspective on Molecular Cell Biology
In our opinion, mathematical models of molecular regulatory systems are “hypothesis testing” tools. The reaction diagram in Figure 2 was, at the time (1990), a hypothesis about how we imagined the CDK control network to be interconnected. In general, how are we to know whether such “working hypotheses” are correct or not? There are four tests that must be applied.
First, is a working hypothesis consistent with everything that is already known about the control system from careful, reliable experiments? If not, then there must be something seriously incorrect or incomplete about the model, and the nature of the discrepancies between theory and experiment may well suggest the origin of the problem. Consistency checks require accurate characterization of the consequences of a model. The very process of building a mathematical model forces us to be precise about the assumptions inherent in our hypothetical reaction network. And numerical simulations of the model equations allow us to make trustworthy predictions of how the model behaves under a variety of experimental conditions. The Novak-Tyson model of the eukaryotic cell cycle was thoroughly checked for consistency with known biochemical properties of MPF activation in frog oocytes, fertilized eggs and egg extracts (Novak & Tyson 1993b), and also for consistency with known phenotypes of cell cycle mutants in fission yeast (Novak & Tyson 1995, Novak & Tyson 1997).
Second, if a mathematical model is adequately verified against known experimental facts, then we would like the model to make clear predictions about how the control system is expected to behave under novel experimental conditions. The experimental tests should be “doable”, but one cannot reasonably demand the modeler to carry out the tests. In our early papers, we made six intriguing predictions, but we were in no position to do the experiments.
Third, when the tests are made, either they will provide confirming evidence for the working hypothesis, or, if they contradict the predictions of the model, they may point to ways to modify the model and improve our understanding of the control system. In this review, we have stressed how the six predictions of the Novak-Tyson model were confirmed in a series of careful, quantitative experiments carried out ten and more years later. This confirmation was not to say that the working hypothesis in Figure 2 was to be the “last word” on the cell cycle control system. Indeed, many new experimental facts have been discovered since 1993, and the “working hypothesis” for the CDK control system in eukaryotes has gotten increasingly complex. Nonetheless, the basic tests of consistency, predictive power, and experimental confirmation have served the community well over the years, and the necessity of carrying out these tests in terms of mathematical models has become more evident as our knowledge of the control system becomes more comprehensive and detailed (Chen et al. 2000, Novak et al. 2001, Tyson & Novak 2001, Chen et al. 2004).
Fourth, the mathematical model should provide us with new ways of thinking about cell cycle regulation. The classic theory, reviewed here, introduced the community of molecular cell biologists to a number of new ideas—bistability, relaxation oscillations, phase planes, critical slowing down, trigger waves—that have become standard parlance in the field. In recent papers, we have stressed the importance of bistability in accounting for irreversible transitions at all the major cell cycle checkpoints (Novak et al. 2007). This idea suggested many new experiments to look for evidences of bistability, and the predictions of the model have been confirmed in each case (Cross et al. 2002, Yao et al. 2008, Lopez-Aviles et al. 2009).
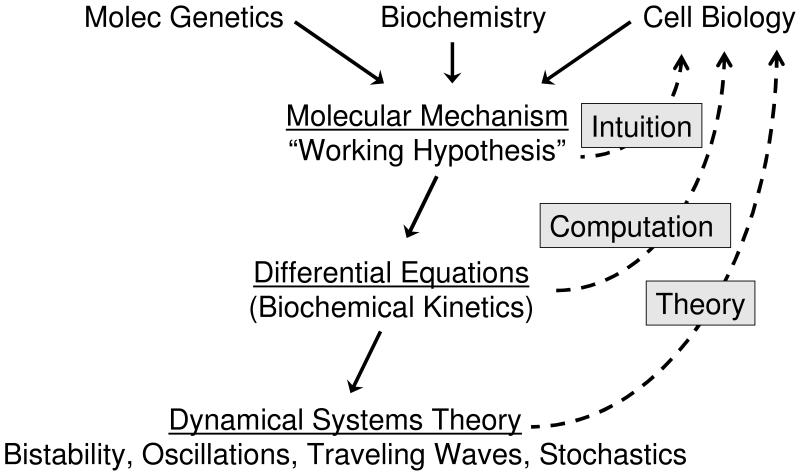
Perhaps the most sweeping of all these new ways of thinking is a new “dynamical perspective” on molecular cell biology (Figure 10) that is taking root in many universities and research institutes around the world. Modern techniques in genetics, biochemistry and cell biology are producing an avalanche of information that can be used to formulate complex hypotheses about the molecular regulation of any aspect of cell physiology. These regulatory mechanisms are now so complex and inter-related that we cannot depend on intuitive reasoning to carry out believable consistency checks or reliable predictions. We can build well-defined mathematical models of these hypothetical control systems by standard methods of biophysical chemistry, but these models usually entail a host of poorly defined kinetic constants. Without knowing values for these constants, we cannot simulate the behavior of the model in a computer, which is the first step in comparing the predictions of a model to the realities of experiments. The “dynamical perspective,” as illustrated in this review, relies on ideas from dynamical systems theory (phase planes, nullclines, bifurcation diagrams, stochastic models, etc.) to derive the qualitative features of a mathematical model (oscillations, bistability, robustness), which can be compared to the qualitative behaviors of living cells (signal-response curves, oscillations, checkpoints, mutant phenotypes). The first test of any model is to match the qualitative features of the experimental system. In doing so, the qualitative theory of dynamical systems will direct the modeler to those regions of parameter space (values of kinetic constants) where the model has the potential to match experimental observations. By providing initial guesses for parameter values, the qualitative theory (the dynamical perspective) sets the stage for numerical simulations that can quickly home in on accurate quantitative fits of a model to experimental data. Although in this review we have not illustrated how dynamical systems theory helps us to find “good” sets of parameter values, it has been our experience over the course of 30 years of modeling cell cycle control that this “guidance principle” of the dynamical perspective is one of its most useful functions.
Figure 10. A dynamical perspective on molecular cell biology.
See text for commentary.
Figure 6. Critical slowing down of MPF activation in frog egg extracts.
Images from Sha et al. (2003); used by permission. As in Fig. 5A, interphase arrested extracts are supplemented with a fixed amount of non-degradable cyclin B at t = 0. When supplemented with 80 or 60 nM cyclin B, sperm nuclei in the extract have entered mitosis by t = 60 min, but extracts supplemented with lower concentrations of cyclin B (50 or 40 nM; getting closer to the activation threshold) exhibit a longer lag time before entering mitosis (75 and 90 min, respectively).
Acknowledgements
Preparation of this article was supported in part by the National Institutes of Health (USA) Grant 5R01 GM078989-08 to J.J.T. and by the European Community’s Seventh Framework Grant MitoSys/241548 to B.N.
References
- Aguda BD. A quantitative analysis of the kinetics of the G(2) DNA damage checkpoint system. Proc Natl Acad Sci U S A. 1999;96(20):11352–11357. doi: 10.1073/pnas.96.20.11352. [DOI] [PMC free article] [PubMed] [Google Scholar]
- Aguda BD, Tang Y. The kinetic origins of the restriction point in the mammalian cell cycle. Cell Prolif. 1999;32(5):321–335. doi: 10.1046/j.1365-2184.1999.3250321.x. [DOI] [PMC free article] [PubMed] [Google Scholar]
- Alfieri R, Barberis M, Chiaradonna F, Gaglio D, Milanesi L, Vanoni M, Klipp E, Alberghina L. Towards a systems biology approach to mammalian cell cycle: modeling the entrance into S phase of quiescent fibroblasts after serum stimulation. BMC Bioinformatics. 2009;10(Suppl 12):S16. doi: 10.1186/1471-2105-10-S12-S16. [DOI] [PMC free article] [PubMed] [Google Scholar]
- Barberis M, Klipp E, Vanoni M, Alberghina L. Cell size at S phase initiation: an emergent property of the G1/S network. PLoS Comput Biol. 2007;3(4):e64. doi: 10.1371/journal.pcbi.0030064. [DOI] [PMC free article] [PubMed] [Google Scholar]
- Barik D, Baumann WT, Paul MR, Novak B, Tyson JJ. A model of yeast cell-cycle regulation based on multisite phosphorylation. Mol Syst Biol. 2010;6:405. doi: 10.1038/msb.2010.55. [DOI] [PMC free article] [PubMed] [Google Scholar]
- Beach D, Durkacz B, Nurse P. Functionally homologous cell cycle control genes in budding and fission yeast. Nature. 1982;300(5894):706–709. doi: 10.1038/300706a0. [DOI] [PubMed] [Google Scholar]
- Brummer A, Salazar C, Zinzalla V, Alberghina L, Hofer T. Mathematical modelling of DNA replication reveals a trade-off between coherence of origin activation and robustness against rereplication. PLoS Comput Biol. 2010;6(5):e1000783. doi: 10.1371/journal.pcbi.1000783. [DOI] [PMC free article] [PubMed] [Google Scholar]
- Chang JB, Ferrell JE., Jr. Mitotic trigger waves and the spatial coordination of the Xenopus cell cycle. Nature. 2013;500(7464):603–607. doi: 10.1038/nature12321. [DOI] [PMC free article] [PubMed] [Google Scholar]
- Chen KC, Calzone L, Csikasz-Nagy A, Cross FR, Novak B, Tyson JJ. Integrative analysis of cell cycle control in budding yeast. Mol Biol Cell. 2004;15(8):3841–3862. doi: 10.1091/mbc.E03-11-0794. [DOI] [PMC free article] [PubMed] [Google Scholar]
- Chen KC, Csikasz-Nagy A, Gyorffy B, Val J, Novak B, Tyson JJ. Kinetic analysis of a molecular model of the budding yeast cell cycle. Mol Biol Cell. 2000;11(1):369–391. doi: 10.1091/mbc.11.1.369. [DOI] [PMC free article] [PubMed] [Google Scholar]
- Cross FR, Archambault V, Miller M, Klovstad M. Testing a mathematical model of the yeast cell cycle. Mol Biol Cell. 2002;13(1):52–70. doi: 10.1091/mbc.01-05-0265. [DOI] [PMC free article] [PubMed] [Google Scholar]
- Dasso M, Newport JW. Completion of DNA replication is monitored by a feedback system that controls the initiation of mitosis in vitro: studies in Xenopus. Cell. 1990;61(5):811–823. doi: 10.1016/0092-8674(90)90191-g. [DOI] [PubMed] [Google Scholar]
- Dunphy WG, Brizuela L, Beach D, Newport J. The Xenopus cdc2 protein is a component of MPF, a cytoplasmic regulator of mitosis. Cell. 1988;54(3):423–431. doi: 10.1016/0092-8674(88)90205-x. [DOI] [PubMed] [Google Scholar]
- Evans T, Rosenthal ET, Youngblom J, Distel D, Hunt T. Cyclin: a protein specified by maternal mRNA in sea urchin eggs that is destroyed at each cleavage division. Cell. 1983;33(2):389–396. doi: 10.1016/0092-8674(83)90420-8. [DOI] [PubMed] [Google Scholar]
- Faure A, Naldi A, Lopez F, Chaouiya C, Ciliberto A, Thieffry D. Modular logical modelling of the budding yeast cell cycle. Mol Biosyst. 2009;5(12):1787–1796. doi: 10.1039/B910101m. [DOI] [PubMed] [Google Scholar]
- Gautier J, Minshull J, Lohka M, Glotzer M, Hunt T, Maller JL. Cyclin is a component of maturation-promoting factor from Xenopus. Cell. 1990;60(3):487–494. doi: 10.1016/0092-8674(90)90599-a. [DOI] [PubMed] [Google Scholar]
- Gautier J, Norbury C, Lohka M, Nurse P, Maller J. Purified maturation-promoting factor contains the product of a Xenopus homolog of the fission yeast cell cycle control gene cdc2+ Cell. 1988;54(3):433–439. doi: 10.1016/0092-8674(88)90206-1. [DOI] [PubMed] [Google Scholar]
- Gerard C, Goldbeter A. Temporal self-organization of the cyclin/Cdk network driving the mammalian cell cycle. Proc Natl Acad Sci U S A. 2009;106(51):21643–21648. doi: 10.1073/pnas.0903827106. [DOI] [PMC free article] [PubMed] [Google Scholar]
- Gerhart J, Wu M, Kirschner M. Cell cycle dynamics of an M-phase-specific cytoplasmic factor in Xenopus laevis oocytes and eggs. J Cell Biol. 1984;98(4):1247–1255. doi: 10.1083/jcb.98.4.1247. [DOI] [PMC free article] [PubMed] [Google Scholar]
- Goldbeter A. A minimal cascade model for the mitotic oscillator involving cyclin and cdc2 kinase. Proc Natl Acad Sci U S A. 1991;88(20):9107–9111. doi: 10.1073/pnas.88.20.9107. [DOI] [PMC free article] [PubMed] [Google Scholar]
- Goldbeter A, Koshland DE., Jr. An amplified sensitivity arising from covalent modification in biological systems. Proc Natl Acad Sci U S A. 1981;78(11):6840–6844. doi: 10.1073/pnas.78.11.6840. [DOI] [PMC free article] [PubMed] [Google Scholar]
- Gould KL, Moreno S, Tonks NK, Nurse P. Complementation of the mitotic activator, p80cdc25, by a human protein-tyrosine phosphatase. Science. 1990;250(4987):1573–1576. doi: 10.1126/science.1703321. [DOI] [PubMed] [Google Scholar]
- Gunawardena J. Multisite protein phosphorylation makes a good threshold but can be a poor switch. Proc Natl Acad Sci U S A. 2005;102(41):14617–14622. doi: 10.1073/pnas.0507322102. [DOI] [PMC free article] [PubMed] [Google Scholar]
- Hancioglu B, Tyson JJ. A mathematical model of mitotic exit in budding yeast: the role of Polo kinase. PLoS One. 2012;7(2):e30810. doi: 10.1371/journal.pone.0030810. [DOI] [PMC free article] [PubMed] [Google Scholar]
- Hartwell LH, Culotti J, Reid B. Genetic control of the cell-division cycle in yeast. I. Detection of mutants. Proc Natl Acad Sci U S A. 1970;66(2):352–359. doi: 10.1073/pnas.66.2.352. [DOI] [PMC free article] [PubMed] [Google Scholar]
- Hartwell LH, Culotti J, Pringle JR, Reid B. Genetic control of the cell division cycle in yeast. Science. 1974;183(4120):46–51. doi: 10.1126/science.183.4120.46. [DOI] [PubMed] [Google Scholar]
- Hyver C, Le Guyader H. MPF and cyclin: modelling of the cell cycle minimum oscillator. Biosystems. 1990;24(2):85–90. doi: 10.1016/0303-2647(90)90001-h. [DOI] [PubMed] [Google Scholar]
- Kapuy O, Barik D, Sananes MR, Tyson JJ, Novak B. Bistability by multiple phosphorylation of regulatory proteins. Prog Biophys Mol Biol. 2009;100(1-3):47–56. doi: 10.1016/j.pbiomolbio.2009.06.004. [DOI] [PMC free article] [PubMed] [Google Scholar]
- Kim SY, Ferrell JE., Jr. Substrate competition as a source of ultrasensitivity in the inactivation of Wee1. Cell. 2007;128(6):1133–1145. doi: 10.1016/j.cell.2007.01.039. [DOI] [PubMed] [Google Scholar]
- Kumagai A, Dunphy WG. Regulation of the cdc25 protein during the cell cycle in Xenopus extracts. Cell. 1992;70(1):139–151. doi: 10.1016/0092-8674(92)90540-s. [DOI] [PubMed] [Google Scholar]
- Lohka MJ, Hayes MK, Maller JL. Purification of maturation-promoting factor, an intracellular regulator of early mitotic events. Proc Natl Acad Sci U S A. 1988;85(9):3009–3013. doi: 10.1073/pnas.85.9.3009. [DOI] [PMC free article] [PubMed] [Google Scholar]
- Lopez-Aviles S, Kapuy O, Novak B, Uhlmann F. Irreversibility of mitotic exit is the consequence of systems-level feedback. Nature. 2009;459(7246):592–595. doi: 10.1038/nature07984. [DOI] [PMC free article] [PubMed] [Google Scholar]
- Masui Y, Markert CL. Cytoplasmic control of nuclear behavior during meiotic maturation of frog oocytes. J Exp Zool. 1971;177(2):129–145. doi: 10.1002/jez.1401770202. [DOI] [PubMed] [Google Scholar]
- Mitchison JM. Growth during the cell cycle. Int Rev Cytol. 2003;226:165–258. doi: 10.1016/s0074-7696(03)01004-0. [DOI] [PubMed] [Google Scholar]
- Mueller PR, Coleman TR, Dunphy WG. Cell cycle regulation of a Xenopus Wee1-like kinase. Mol Biol Cell. 1995;6(1):119–134. doi: 10.1091/mbc.6.1.119. [DOI] [PMC free article] [PubMed] [Google Scholar]
- Murray AW, Kirschner MW. Cyclin synthesis drives the early embryonic cell cycle. Nature. 1989;339(6222):275–280. doi: 10.1038/339275a0. [DOI] [PubMed] [Google Scholar]
- Norel R, Agur Z. A model for the adjustment of the mitotic clock by cyclin and MPF levels. Science. 1991;251(4997):1076–1078. doi: 10.1126/science.1825521. [DOI] [PubMed] [Google Scholar]
- Novak B, Pataki Z, Ciliberto A, Tyson JJ. Mathematical model of the cell division cycle of fission yeast. Chaos. 2001;11(1):277–286. doi: 10.1063/1.1345725. [DOI] [PubMed] [Google Scholar]
- Novak B, Tyson JJ. Modeling the cell division cycle: M-phase trigger, oscillations and size control. J Theor Biol. 1993a;165:101–134. [Google Scholar]
- Novak B, Tyson JJ. Numerical analysis of a comprehensive model of M-phase control in Xenopus oocyte extracts and intact embryos. J Cell Sci. 1993b;106:1153–1168. doi: 10.1242/jcs.106.4.1153. [DOI] [PubMed] [Google Scholar]
- Novak B, Tyson JJ. Quantitative Analysis of a Molecular Model of Mitotic Control in Fission Yeast. J. Theor. Biol. 1995;173:283–305. [Google Scholar]
- Novak B, Tyson JJ. Modeling the control of DNA replication in fission yeast. Proc Natl Acad Sci U S A. 1997;94(17):9147–9152. doi: 10.1073/pnas.94.17.9147. [DOI] [PMC free article] [PubMed] [Google Scholar]
- Novak B, Tyson JJ. A model for restriction point control of the mammalian cell cycle. J Theor Biol. 2004;230(4):563–579. doi: 10.1016/j.jtbi.2004.04.039. [DOI] [PubMed] [Google Scholar]
- Novak B, Tyson JJ, Gyorffy B, Csikasz-Nagy A. Irreversible cell-cycle transitions are due to systems-level feedback. Nat Cell Biol. 2007;9(7):724–728. doi: 10.1038/ncb0707-724. [DOI] [PubMed] [Google Scholar]
- Nurse P. Genetic control of cell size at cell division in yeast. Nature. 1975;256(5518):547–551. doi: 10.1038/256547a0. [DOI] [PubMed] [Google Scholar]
- Nurse P. Cell cycle control genes in yeast. Trends in genetics. 1985;1:51–55. doi: 10.1016/0168-9525(88)90171-0. [DOI] [PubMed] [Google Scholar]
- Nurse P. Universal control mechanism regulating onset of M-phase. Nature. 1990;344(6266):503–508. doi: 10.1038/344503a0. [DOI] [PubMed] [Google Scholar]
- Nurse P. A long twentieth century of the cell cycle and beyond. Cell. 2000;100(1):71–78. doi: 10.1016/s0092-8674(00)81684-0. [DOI] [PubMed] [Google Scholar]
- Nurse P, Thuriaux P, Nasmyth K. Genetic control of the cell division cycle in the fission yeast Schizosaccharomyces pombe. Mol Gen Genet. 1976;146(2):167–178. doi: 10.1007/BF00268085. [DOI] [PubMed] [Google Scholar]
- Obeyesekere MN, Herbert JR, Zimmerman SO. A model of the G1 phase of the cell cycle incorporating cyclin E/cdk2 complex and retinoblastoma protein. Oncogene. 1995;11(6):1199–1205. [PubMed] [Google Scholar]
- Obeyesekere MN, Tucker SL, Zimmerman SO. A model for regulation of the cell cycle incorporating cyclin A, cyclin B and their complexes. Cell Prolif. 1994;27(2):105–113. doi: 10.1111/j.1365-2184.1994.tb01409.x. [DOI] [PubMed] [Google Scholar]
- Pomerening JR, Kim SY, Ferrell JE., Jr. Systems-level dissection of the cell-cycle oscillator: bypassing positive feedback produces damped oscillations. Cell. 2005;122(4):565–578. doi: 10.1016/j.cell.2005.06.016. [DOI] [PubMed] [Google Scholar]
- Pomerening JR, Sontag ED, Ferrell JE., Jr. Building a cell cycle oscillator: hysteresis and bistability in the activation of Cdc2. Nat Cell Biol. 2003;5(4):346–351. doi: 10.1038/ncb954. [DOI] [PubMed] [Google Scholar]
- Qu Z, Weiss JN, MacLellan WR. Regulation of the mammalian cell cycle: a model of the G1-to-S transition. Am J Physiol Cell Physiol. 2003;284(2):C349–364. doi: 10.1152/ajpcell.00066.2002. [DOI] [PubMed] [Google Scholar]
- Russell P, Nurse P. cdc25+ functions as an inducer in the mitotic control of fission yeast. Cell. 1986;45(1):145–153. doi: 10.1016/0092-8674(86)90546-5. [DOI] [PubMed] [Google Scholar]
- Russell P, Nurse P. Negative regulation of mitosis by wee1+, a gene encoding a protein kinase homolog. Cell. 1987;49(4):559–567. doi: 10.1016/0092-8674(87)90458-2. [DOI] [PubMed] [Google Scholar]
- Salazar C, Hofer T. Versatile regulation of multisite protein phosphorylation by the order of phosphate processing and protein-protein interactions. FEBS J. 2007;274(4):1046–1061. doi: 10.1111/j.1742-4658.2007.05653.x. [DOI] [PubMed] [Google Scholar]
- Salazar C, Hofer T. Multisite protein phosphorylation--from molecular mechanisms to kinetic models. FEBS J. 2009;276(12):3177–3198. doi: 10.1111/j.1742-4658.2009.07027.x. [DOI] [PubMed] [Google Scholar]
- Sha W, Moore J, Chen K, Lassaletta AD, Yi CS, Tyson JJ, Sible JC. Hysteresis drives cell-cycle transitions in Xenopus laevis egg extracts. Proc Natl Acad Sci U S A. 2003;100(3):975–980. doi: 10.1073/pnas.0235349100. [DOI] [PMC free article] [PubMed] [Google Scholar]
- Singhania R, Sramkoski RM, Jacobberger JW, Tyson JJ. A hybrid model of mammalian cell cycle regulation. PLoS Comput Biol. 2011;7(2):e1001077. doi: 10.1371/journal.pcbi.1001077. [DOI] [PMC free article] [PubMed] [Google Scholar]
- Solomon MJ, Glotzer M, Lee TH, Philippe M, Kirschner MW. Cyclin activation of p34cdc2. Cell. 1990;63(5):1013–1024. doi: 10.1016/0092-8674(90)90504-8. [DOI] [PubMed] [Google Scholar]
- Tang Z, Coleman TR, Dunphy WG. Two distinct mechanisms for negative regulation of the Wee1 protein kinase. Embo J. 1993;12(9):3427–3436. doi: 10.1002/j.1460-2075.1993.tb06017.x. [DOI] [PMC free article] [PubMed] [Google Scholar]
- Toettcher JE, Loewer A, Ostheimer GJ, Yaffe MB, Tidor B, Lahav G. Distinct mechanisms act in concert to mediate cell cycle arrest. Proc Natl Acad Sci U S A. 2009;106(3):785–790. doi: 10.1073/pnas.0806196106. [DOI] [PMC free article] [PubMed] [Google Scholar]
- Trunnell NB, Poon AC, Kim SY, Ferrell JE., Jr. Ultrasensitivity in the Regulation of Cdc25C by Cdk1. Mol Cell. 2011;41(3):263–274. doi: 10.1016/j.molcel.2011.01.012. [DOI] [PMC free article] [PubMed] [Google Scholar]
- Tyson JJ. Modeling the cell division cycle: cdc2 and cyclin interactions. Proc Natl Acad Sci U S A. 1991;88(16):7328–7332. doi: 10.1073/pnas.88.16.7328. [DOI] [PMC free article] [PubMed] [Google Scholar]
- Tyson JJ, Novak B. Regulation of the eukaryotic cell cycle: molecular antagonism, hysteresis, and irreversible transitions. J Theor Biol. 2001;210(2):249–263. doi: 10.1006/jtbi.2001.2293. [DOI] [PubMed] [Google Scholar]
- Verdugo A, Vinod PK, Tyson JJ, Novak B. Molecular mechanisms creating bistable switches at cell cycle transitions. Open Biol. 2013;3(3):120179. doi: 10.1098/rsob.120179. [DOI] [PMC free article] [PubMed] [Google Scholar]
- Vinod PK, Freire P, Rattani A, Ciliberto A, Uhlmann F, Novak B. Computational modelling of mitotic exit in budding yeast: the role of separase and Cdc14 endocycles. J R Soc Interface. 2011;8(61):1128–1141. doi: 10.1098/rsif.2010.0649. [DOI] [PMC free article] [PubMed] [Google Scholar]
- Yang L, MacLellan WR, Han Z, Weiss JN, Qu Z. Multisite phosphorylation and network dynamics of cyclin-dependent kinase signaling in the eukaryotic cell cycle. Biophys J. 2004;86(6):3432–3443. doi: 10.1529/biophysj.103.036558. [DOI] [PMC free article] [PubMed] [Google Scholar]
- Yang Q, Ferrell JE., Jr. The Cdk1-APC/C cell cycle oscillator circuit functions as a time-delayed, ultrasensitive switch. Nat Cell Biol. 2013;15(5):519–525. doi: 10.1038/ncb2737. [DOI] [PMC free article] [PubMed] [Google Scholar]
- Yao G, Lee TJ, Mori S, Nevins JR, You L. A bistable Rb-E2F switch underlies the restriction point. Nat Cell Biol. 2008;10(4):476–482. doi: 10.1038/ncb1711. [DOI] [PubMed] [Google Scholar]
- Zhang T, Schmierer B, Novak B. Cell cycle commitment in budding yeast emerges from the cooperation of multiple bistable switches. Open Biol. 2011;1(3):110009. doi: 10.1098/rsob.110009. [DOI] [PMC free article] [PubMed] [Google Scholar]


