

Abstract
Detecting selection in B cell immunoglobulin (Ig) sequences is critical to understanding affinity maturation, and can provide insights into antigen-driven selection in normal and pathologic immune responses. The most common sequence-based methods for detecting selection analyze the ratio of replacement (R) and silent (S) mutations using a binomial statistical analysis. However, these approaches have been criticized for low sensitivity. An alternative method is based on the analysis of lineage trees constructed from sets of clonally-related Ig sequences. Several tree shape measures have been proposed as indicators of selection that can be statistically compared across cohorts. However, we show that tree shape analysis is confounded by underlying experimental factors that are difficult to control for in practice, including the sequencing depth and number of generations in each clone. Thus, though lineage tree shapes may reflect selection, their analysis alone is an unreliable measure of in vivo selection. To usefully capture the information provided by lineage trees, we propose a new method that applies the binomial statistical method to mutations identified based on lineage tree structure. This hybrid method is able to detect selection with increased sensitivity in both simulated and experimental data sets. We anticipate that this approach will be especially useful in the analysis of large-scale Ig sequencing data sets generated by high-throughput sequencing technologies.
Introduction
A diverse repertoire of immunoglobulin (Ig) receptors on B cells allows the adaptive immune response to recognize a universe of antigens. The initial diversity of naïve B cells results from a complex genetic rearrangement process in the bone marrow, where the Ig receptor heavy and light chains are formed through the recombination of V(D)J segments, with additional diversity generated at the junction boundaries (1–3). During T cell dependent immune responses, the affinity of B cell Ig receptors is fine-tuned by the dynamic process of affinity maturation. This critical component of adaptive immunity, which normally occurs within the specialized micro-environment of germinal centers (GCs), protects the host from recurring infections and ever-evolving pathogens (4). In the GC, antigen-activated B cells clonally expand and undergo somatic hypermutation (SHM), which introduces an average of approximately one point mutation per division in the variable region of the Ig gene (5, 6). These mutations can alter the affinity of the Ig receptor, and the resulting diversification provides the substrate for affinity maturation. B cells acquiring affinity increasing mutations are preferentially expanded (positive selection), most likely through a survival advantage (7). B cells that acquire mutations that decrease affinity or adversely impact structural integrity of the Ig receptor are removed from the population (negative selection) (8, 9). Multiple rounds of division, mutation and selection result in populations of high-affinity memory and long-lived plasma B cells, which help clear the current infection as well as protect the host against future infections (10–12).
The ability to detect selection, especially positive selection, in experimentally-derived Ig sequences is critical not only in understanding the role of affinity maturation in physiological immune responses, but also in pathological ones. Auto-reactive B cells derived from lupus-prone mice are clonally expanded and carry numerous somatic mutations with a distribution that suggests a role for selection (8, 13). In Rheumatoid Arthritis (RA), B cells form ectopic GC-like microstructures in the synovium and are the source of auto-reactive rheumatoid factors (14, 15). Similarly, expanded B cell clones contribute to CNS immunopathology in Multiple Sclerosis (MS), and analysis of antigen-driven selection could help identify mechanisms that drive the disease (16–18). Along with providing insights into disease pathology, the ability to detect selection may have prognostic value, as in the case of B cell lymphomas (19–21).
SHM introduces point mutations into the variable (V) region of Ig gene at the rate of ∼10-3 per base-pair per division (5, 6). In the absence of selection, the fraction of mutations that result in an amino acid change (i.e., replacements (R)), can be estimated based on a model of SHM hot/cold-spots and substitution bias (22–25). Since only R mutations can modify Ig receptor affinity, we expect selection to skew the observed ratio of R and silent (S) mutations. If the frequency of R mutations is higher than expected, this is assumed to indicate positive selection, while a reduced frequency is associated with negative selection. Selection is usually analyzed separately for the complementarity determining regions (CDRs), which are most likely to interact with antigen and the framework regions (FWRs), which are mainly responsible for maintaining structural integrity of the Ig molecule (13).
The earliest methods to rigorously test for selection operated on single sequences, and compared the observed frequency of R mutations to their expected frequency under the null hypothesis of no selection using a binomial statistical framework (13, 26, 27). However, these methods have been criticized for their high false positive rate (28, 29). This low specificity was due, at least in part, to a failure to fully account for the intrinsic biases of SHM, which can give the appearance of selection. In previous work, we developed the Focused binomial test, which improved specificity through a better model of intrinsic biases and corrected for the effects of cross-talk between positive and negative selection using a carefully derived null model (25). A further improvement, the Focused Z-test, allowed for the combined analysis of multiple sequences, potentially using different germline V(D)J segments, which increased the sensitivity for the detecting selection while maintaining specificity (30). All of these methods result in a p-value that can be used to reject the null hypothesis that the observed mutation pattern occurred in the absence of selection. Most recently, we developed a statistical framework for Bayesian estimation of Antigen-driven SELectIoN (BASELINe), which shifts the problem from one of simply detecting selection to one of quantifying selection (31). Despite these improvements, these R:S-based methods generally suffer from low sensitivity (32).
An alternate approach to detect selection is based on the analysis of B cell lineage trees, which can be created from sets of clonally-related Ig sequences using methods such as maximum parsimony (33–35). Unlike the R:S-based methods, lineage trees preserve the substantial information present in the pattern of shared and unique mutations among clonal sequences, which reflects the dynamics of the underlying diversification and selection processes (5, 8, 36, 37). Lineage tree analysis was instrumental in establishing germinal centers as the site of SHM, and the concept of step-wise affinity maturation (38, 39). B cell lineage tree shapes have been suggested to reflect the degree of underlying selection, with “pruned” trees reflecting greater selection compared to the “bushy” trees (37, 40). Simulation studies have been carried out to identify linkages between specific lineage tree shape measures and underlying selection (34, 41). These tree shape measures have been applied in several studies to compare selection in different lymphoid tissues, autoimmune diseases, and lymphomas (42–44). However, the specificity of these methods remains uncertain as current approaches do not account for the potentially confounding influences of experimental factors, such as the number of generations in the clone and the number of sequences sampled, which might give the appearance of spurious selection.
In this paper, we quantify the relationship between B cell lineage tree shape measures and immune selection, while accounting for critical experimental factors. Despite the correlation between several tree shape measures and selection, we show that existing measures are affected by experimental factors likely to lead to poor specificity in practice. This problem is overcome by utilizing a hybrid method that combines lineage tree information within an R:S-based framework that significantly improves the sensitivity for detecting selection over existing methods.
Methods
Simulation model of B cell affinity maturation
The simulation is based on the “Clone” model and its more recent extensions (6, 9, 25). It includes B cell clonal expansion, somatic hypermutation, and affinity-dependent death. The simulation is seeded with a single B cell and proceeds in discrete, synchronous generations. During each generation, all cells divide once and accumulate a Poisson distributed number of mutations with average µ=0.3. The impact of every mutation is determined stochastically according to the distribution described in Figure 1 of (25). Briefly, the probability that a mutation falls in the FWR is given by pFWR=0.75, and otherwise it falls in the CDR (1-pFWR=pCDR=0.25). Within each region, the probability of a mutation being an R is given by pR=0.75, and it is otherwise an S (1-pR=pS=0.25). All S mutations are neutral. R mutations that fall in the FWR are considered lethal with probability λ={0, 0.5}, and cells that accumulate such mutations are removed at the end of each generation. A value of λ=0 indicates no negative selection, while λ=0.5 is used for realistic levels of negative selection (9, 13).
Figure 1. The influence of positive and negative selection on lineage tree shape measures.

The probability distribution of (A) OD_Avg, (B) OD-Ratio, (C) PL_Avg and (D) DLFSN_Avg was computed for simulated data under different selection pressures: neutral selection (grey shaded area; s=1, λ=0), only positive selection (green line; s=7, λ=0), only negative selection (red line; s=1, λ=0.5) and the combination of positive and negative selections (blue line; s=7, λ=0.5). q=20 and D=22 for all simulations.
Negative selection is modeled by death (or removal) of the B cells that acquire lethal mutations at the end of each generation. Independent of lethal mutations, a fraction of B cells die at the end of every generation. R mutations in the CDR are considered advantageous (i.e. affinity increasing) with probability fCDR_A=0.75, and these mutation provide a survival advantage to the cell by decreasing the death rate (7). Specifically, the death rate (di) for a given B cell (i) is given by:
Where dmax=0.4 is the maximum death rate, ai is the number of advantageous mutations accumulated by the cell, and the selection factor (s={1,…,7}) determines the cumulative effect of advantageous mutations. An s value of 1 indicates no positive selection in the simulation, and increasing s causes each mutation to have a greater proportional effect on the death rate. Moderate values of s produce the greatest average affinity increases, with s=7 being optimal (data not shown).
Generating lineage trees
During the simulation, the entire B cell lineage was tracked. After D generations, q cells are randomly sampled from the population and the remaining cells are pruned from the lineage. The resulting tree, which is a sub-tree of the exact simulated lineage, is comparable to a lineage tree obtained using experimentally derived sequences created using maximum parsimony (6). Unless otherwise specified D=22 and q=20. All of the simulated data used in this study are available at: http://clip.med.yale.edu/papers/Uduman2013JI.
Lineage trees shape measures
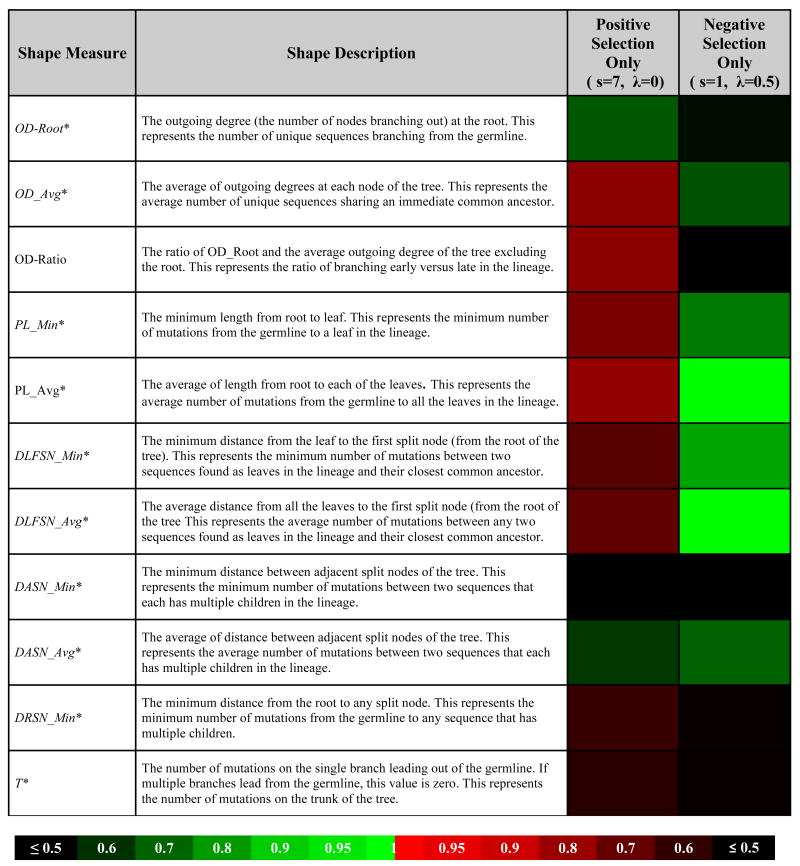
Twenty-nine graph theoretical properties were computed to quantify the shape of each lineage tree. These shape measures involve terms based on counting various types of nodes (sequences), and the distances (number of mutations) between them. In many cases, the maximum, minimum, and average value for each shape measure is also calculated. For example, the numbers of mutations from the root to the leaves of a lineage tree has an average (across all leaves), a maximum and a minimum. While all 29 shape measures were thoroughly analyzed, detailed results are presented for the seven shape measures that were reported by (45) to be highly correlated with selection and three additional measures that we found to be significantly correlated (Table 1). Please refer to Figure 1 of (45) for a visual representation of lineage tree shape measures.
Table I. Lineage tree shape measures.
|
Lineage tree shape measures, their description and heat map of the area under the curve (AUC) quantifying the impact of positive and negative selection on the shape measures.
Denotes shape measures from (45), and italicized shape measures were reported to be significantly correlated with selection.
Quantifying the influence of selection on lineage tree shape measures
To determine the effect of selection on a lineage tree shape measure, its empirical probability distribution was determined from a simulation that includes selection and compared with one in the absence of selection (λ=0, s=1). Several different kinds of selection are considered: only positive selection (λ=0, s=7), only negative selection (λ=0.5, s=1), and a combination of negative and positive selections (λ=0.5, s=7). The shift in these two probability distributions was quantified using numeric integration to estimate the area under the curve (AUC) as described in Equation 7 of (31).
Quantitative framework for detecting selection using lineage tree shape measures
To estimate the true and false positive rates for a shape measures' ability to detect selection we first determined the distribution of the shape measure under the null hypothesis of no selection (λ=0, s=1). Based on this null distribution, a cutoff value for the measure is given by the 5% tail of the distribution. The direction of the tail was determined beforehand based on the expected influence of selection on the tree shape measure's distribution. For each lineage tree simulated in the presence of selection, the null hypothesis of no selection was rejected if the tree shape measure was more extreme than the cutoff. The fraction of trees rejected over many simulated lineage trees provides the sensitivity or 1-specificity of the shape measures' ability to detect selection.
IgG sequence dataset from a healthy male
Peripheral blood mononuclear cells (PBMCs) were isolated from a healthy Personal Genome Project subject (46), and RNA was extracted from B lymphocytes. Immunoglobulin heavy chain (IgH) genes were amplified using gene specific reverse transcription and sequenced by emulsion PCR and 454 GS FLX. The sequences were processed through IMGT/HighV-QUEST (47) to identify V(D)J germline gene segments and aligned using IMGT numbering (48). Sequences were further filtered for functionality, quality redundancy and isotype resulting in 7,738 unique IgG sequences. Clonally related sequences were then identified by first grouping based on common V and J gene family assignments, and junction region length. Within these larger groups, sequences differing from one another, in the junction region, by three or fewer point mutations were defined as clones. This resulted in 1,369 clones containing multiple sequences (ranging from 2 to 36 sequences), with an average size of 2.9 sequences per clone. These data are available at: http://clip.med.yale.edu/papers/Uduman2013JI. BASELINe (31), using the Focused test statistic (25, 30), was applied to estimate selection strength.
Non-terminal branch mutations
Non-terminal branch mutations are defined as the set of mutations that occur on branches of the lineage tree that are not connected to a leaf (Figure S3 B). For computational efficiency, the set of non-terminal branch mutations was approximated as those that are shared between more than one sequence in a clone.
Results
Influences of selection on lineage tree shape measures
It is not possible to link tree shape measures with selection using experiments alone, since the parameters that influence selection are not easily modified or controlled. Instead, a computer simulation (described in Methods) was used to produce synthetic data sets with known levels of positive and/or negative selection pressures. Importantly, the simulation also allowed us to control experimental factors, such as number of sampled sequences (q) and cell generations (D). Using the simulation, we evaluated the influence of selection on 29 lineage tree shape measures, many of which have been previously proposed to correlate with selection (34, 45). Some of these shape measures, such as the average out-degree (number of children per node; OD_Avg), increase with both positive and negative selection (Figure 1A). Other shape measures, such as the distance between adjacent split nodes (DASN_Avg) have a negative correlation with selection (Figure 1D). Of the 29 lineage tree shape measures, a subset of 11 measures (see Table I, Figures 1 and S1) were chosen for detailed analysis based on either their ability to detect positive selection in simulated data with high sensitivity, or having previously been reported as highly correlated with selection (45).
While many tree shape measures were clearly modulated by selection, most exhibited properties that were not ideal for detecting positive and negative selection in practice. For example, the average distance between adjacent split nodes (DASN_Avg) decreases with both positive and negative selection so that this measure cannot differentiate between these different influences. Other shape measures were affected by positive and negative selection in opposing manners allowing these forces to cancel each other out. This group included: average outdegree (OD_Avg), average and minimum distance from the leaf to the split node closest to the root (DLFSN_Avg and DLFSN_Min), and the average and minimum path length (distance from the root to the leaves of the tree; PL_Avg and PL_Min). Interestingly, several other tree shape measures previously proposed to correlate with selection (45) did not show such a relationship in our model, including the minimum distance between adjacent split nodes (forks) in the trees (DASN_Min). Thus, while selection influences many lineage tree shape measures, it is not easy to interpret most of these in practice.
The most promising measures included the minimum distance from the root to any split node (DRSN_Min) and the distance from the root to the first node in the tree (T). These shape measures were increased by positive selection, but were not influenced by negative selection (Table I). However, the influence of positive selection on these measures was minor (AUC∼0.5). The most powerful tree shape measure was the ratio of branching early vs. late in the lineage (OD-Ratio). This measure was specifically influenced by positive selection and unlike DRSN_Min and T, the AUC increased significantly (AUC=0.85). Thus, OD-Ratio is a good candidate for detecting positive selection in practice.
The sensitivity of lineage tree shape measures for detecting positive selection
Having identified lineage tree shape measures with the desired properties, we next sought to quantify their sensitivity for detecting selection. The true positive rate (TP) was estimated by comparing the distribution of shape measures for simulated trees in the presence of selective pressures with a null distribution generated in the absence of any selective pressure (see Methods). Surprisingly, six of the shape measures proposed by Shahaf et al., (2008), including all of the minimum value measures (DASN_Min, DLFSN_Min, DRSN_Min and PL_Min) along with OD-Root, showed no ability to detect selection, even for the strongest positive selection strength (Figure 2). Of the remaining previously proposed measures, even the best, DLFSN_Avg, is able to detect only 13.9% of the lineage trees as being selected (for s=7). Similar performance was estimated for OD_Avg (13.0%) and PL_Avg (12.7%). OD-Ratio, a new tree shape measure proposed here, had the highest sensitivity at 17.7%. Both OD-Ratio and DLFSN_Avg detected selection better than the Focused Z-score (30), an R:S-based method that detected selection in 13.1% of the lineage trees (Figure 2). Overall, these results demonstrate the potential of lineage tree shapes to detect selection with increased sensitivity.
Figure 2. Sensitivity of lineage tree shape measures for detecting selection.

Fifteen thousand trees were simulated for a range of positive selection strengths (s={1,…,7}, λ=0), and the power to detect selection was assessed for each shape measure (individual lines) . True positive rates were calculated by comparison with the null distribution of neutral selection (s=1, λ=0) using a P value cutoff of α=0.05 as described in Methods. q=20 and D=22 for all simulations.
The confounding influence of experimental factors on lineage tree shape measures
In practice, lineage tree analysis involves comparing the shape measure distributions between two or more groups of trees (e.g., case and control) (34, 41–43, 49). Unlike the analysis presented in the previous section, where the null distribution only differed in parameters related to selection (λ and s), real experimental groups exhibit many differences. These experimental factors include the number of sequences used to create the lineage tree (sequencing depth) and the generation in the B cell clone at which the sequences were sampled. We hypothesized that differences in these factors alone could give the appearance of selection.
To evaluate the potential effect of sampling depth on lineage tree shape measures, several synthetic datasets were generated with varying numbers of sequences (q={10,20,50,100,200,300}). In all cases, selection was absent and the cells were sampled D=22 generations. For each number of sequences (q), the number of statistically significant trees was calculated using q=300 to generate the control. Since selection is absent in all cases, this provides an estimate for the false positive rate as a function of the number of sequences. Of the five lineage tree shape measures that exhibited a reasonable sensitivity for detecting positive selection (Figure 2), DASN_Avg is most affected by the sampling depth, with a false positive rate of 50.3% when trees contained 10 sequences (q=10) (Figure 3A). OD_Avg, DLFSN_Avg and PL_Avg also exhibited high false positives rates of 35.1%, 22.6% and 17.1%, respectively (Figure 3A). Even OD-Ratio, the shape measure with the highest sensitivity in detecting positive selection under ideal conditions, yielded a false positive rate of 13.9% (Figure 3A).
Figure 3. Low specificity of lineage tree-based approaches due to confounding experimental factors.

Fifteen thousand trees were simulated assuming neutral selection (s=1, λ=0) for a range of (A) the number of sequences sampled, and (B) the generation at which the sequences were sampled. False positive rates were calculated by comparison with the null distribution of neutral selection (s=1, λ=0) with (A) q=300 or (B) D=22 using a P value cutoff of α=0.05 as described in Methods.
Experimental data sets are also likely to vary in the number of generations (cell divisions), even when the sampling time can be fixed (e.g., equivalent number of days post-immunization). Even more problematic, comparisons are often carried out for different disease states (e.g., see (42, 43, 49)), in which case it is not clear how long the B cell clones have been dividing. To evaluate the potential confounding effects of this variability, synthetic data sets were generated by sampling exactly q=20 sequences at varying numbers of generations (D={12, 14, 16, 18, 20, 22}). Comparing these simulated tree shapes with a control based on D=22 generations clearly shows that differences in the number of generations yield high false positive rates for nearly all shape measures (Figure 3B). PL_Avg and DLFSN_Avg were affected the most, with false positive rates of 76.7% and 71.2%, respectively when trees differed by 10 division cycles. High false positive rates were also found for DASV_Avg (24.2%) and OD_Avg (20.7%), while the best performance was shown by OD-Ratio, which still had an unacceptably high false positive rate of 9.8%. Overall these results demonstrate that, even in the absence of any differences in selection pressure, variation in sampling depth and/or the number of generations can falsely give the appearance of selection. Thus, using lineage tree shape measures without properly accounting for such experimental variability can lead to incorrect interpretation of selection status.
Normalizations to correct for the effects of sampling depth and the number of generations has been suggested by previous work (34, 41, 49). Specifically, it was proposed that the effect of sampling depth could be normalized by dividing the shape measure by the number of nodes (sequences) in a lineage tree (34), while the effects of generation could be scaled by the average path length (PL_Avg) (49). The goal of such normalization is to allow lineage tree data from different sources and conditions to be compared without bias. However, despite their use in several studies (34, 41–44, 49), these proposed normalizations have never been directly tested. Results from simulated lineage trees suggest that the application of these normalizations actually decreases specificity (Figure S2). Note the trivial exceptions of DLFSN_Avg and PL_Avg, which achieved 100% specificity but lose sensitivity, since both of these shape measures approximate the average number of mutations and the normalized measure is thus always around one (Figure S2B). In summary, currently proposed normalization methods do not correct for the confounding effects of sampling depth or generation, and likely even decrease specificity.
Filtering for non-terminal branch mutations improves R:S-based methods
Given the specificity problems outlined above, along with the comparable sensitivity of lineage tree shape measures and R:S-based methods for detecting selection, we sought an alternate strategy that could combine the strengths of both approaches. We reasoned that the sensitivity of R:S-based methods might be improved by using information from lineage trees to identify a subset of mutations most likely to be selected. As mutation and selection are ongoing, step-wise processes (5), it is expected that mutations appearing towards the root of lineage trees have been subject to the strongest selection. Indeed, we have previously shown that recurrent mutations (most likely to increase affinity) tend to occur at “non-terminal” branches within in a lineage tree (i.e., branches that are not connected directly to leaves) (7). This relationship is a direct consequence of the clonal expansion and selection process, as it can also be observed in simulated data (Figure S3). In this case, mutations appearing near lineage tree leaves do not show any increase in the R frequency, and their inclusion in R:S-based tests may actually decrease sensitivity. To test this hypothesis, we implemented an R:S-based test (the Focused Z-score method) using mutations exclusively from non-terminal branches in the lineage tree, and applied this method on simulated trees to generate receiver operating characteristic (ROC) curves. These ROC curves show that using only non-terminal branch mutations improves the trade-off between sensitivity and specificity compared to using all unique mutations in the lineage tree (Figure 4). For example, at the standard alpha cut-off of 0.05, using mutations from non-terminal branches yields a sensitivity of 23%, compared to 18% when using all mutations. Importantly, this hybrid method maintains the expected specificity.
Figure 4. Performance of the hybrid method for detecting selection on simulated data.

ROC curves comparing the performance of the Focused Z Test (Uduman et al. 2011) when using all mutations (black curve) or only mutations from non-terminal branches in the lineage tree (gray curve). Sensitivity is based on detecting positive selection in simulated data with both positive and negative selection (s=7, λ=0.5). Specificity is based on detecting positive selection in simulated data with only negative selection (s=1, λ=0.5). The dotted line indicates the expected specificity at α = 0.05 and the “X” indicates the actual specificity at α = 0.05 on the corresponding ROC curves. The inset shows the same data focused around α=0.05. q=20 and D=22 for all simulations.
To verify that the proposed hybrid approach can also provide increased sensitivity for detecting selection in vivo, we analyzed isotype switched IgG sequences derived from a blood sample from a healthy individual (see Methods). As expected, using mutations from non-terminal branches led to a significant increase in the estimated positive selection strength in the CDR (P=0.016), and negative selection strength in the FWR (P=0.042) (Figure 5). Thus, when lineage tree information is available, focusing on the set of non-terminal branch mutations can provide a significant increase in sensitivity for detecting and quantifying selection.
Figure 5. Hybrid method detects stronger selection in vivo.

Estimated selection strength in isotype switched IgG sequences from a healthy male. BASELINe was used to quantify selection in the CDR (top half of the plot) and the FWR (bottom half of the plot) using the Focused test statistic. The curves depict the posterior probability distributions of the selection strength using all unique mutations in the lineage tree (dashed), or only unique mutations on non-terminal branches (solid).
Discussion
The most commonly used methods for detecting selection in Ig sequences are based on a binomial statistical framework that compares the observed frequency of R mutations to that expected under the null hypothesis of no (or neutral) selection. Despite recent advances, the overall sensitivity of these methods remains low (25, 30, 31). Methods based on the analysis of lineage trees provide an alternative approach to obtain insights into B cell clonal expansion and antigen-driven selection (34, 41). In this study, we applied a simulation-based approach to identify several shortcomings in the use of lineage tree shape measures to detect selection. Rather than depending on these shape measures alone, we propose integrating this clonal information into an R:S-based statistical framework to improve the ability to detect selection in Ig sequences.
Qualitative analyses of B cell lineage tree shape measures have been used by many studies to infer the dynamics of the underlying immune response. Within the past decade a plethora of graph-theoretical measures have been proposed and applied to quantify lineage tree shapes and elucidate differences in selection dynamics (e.g., between samples from healthy individuals and those with various disease conditions) (42–44, 49). Shahaf G et al. (2008) demonstrated that several of these shape measures are statistically correlated with selection using a mathematical model of germinal center population dynamics. However, this previous study did not account for experimental factors, such as differences in sequencing depth or the time of sampling, which could lead to clones with widely varying numbers of cell divisions. Furthermore, the lineage trees analyzed by Shahaf G et al. (2008) were generated using all of the B cells in the simulation, so that some of the efficient shape measures simply reflect differences in the overall population size. Experimentally-derived lineage trees are always a subsample of the full population. We hypothesized that differences in these experimental factors could confound the in vivo relationship between lineage tree shape measures and selection.
We developed a computer simulation of B cell clonal expansion and selection that included key experimental factors, such as the number of sequences sampled and the number of cell divisions per clone (associated with the time of sampling). Under conditions of strong positive selection, only two out of the eight shape measures previously associated with selection by Shahaf G et al. (2008) remained significantly correlated (OD_Avg and PL_Avg, P < 0.05). Three additional measures (DLFSN_Avg, DASN_Avg and OD-Ratio) were also found to be significantly associated with selection. While the absolute sensitivity estimated by our simulation approach can depend on parameters such as the number of sequences sampled (thus explaining some of the differences in efficiency between our study and that of Shahaf G et al. (2008)), we always found that all of these tree shape measures had sensitivities that were comparable to the performance of the Focused Z-score method on the same data. Thus, detecting positive selection using lineage tree shape measures does not offer an obvious advantage over R:S-based methods in terms of sensitivity. In fact, a significant disadvantage of lineage tree-based methods concerns their reliance on a control group to make inferences. For example, the distribution of B cell lineage tree shape measures from an autoimmune setting could be compared with healthy samples. In such cases, it is difficult (if not impossible) to control for the number of sequences in each tree and the number of cell divisions per clone. This is a significant issue since we have shown that differences in these experimental factors can falsely give the appearance of selection, and standard normalization approaches do not eliminate this effect. Thus, in practice, the performance of tree-based methods is likely to be significantly worse compared with R:S-based methods.
Despite these issues, the information contained in B cell lineage trees can provide important information about the underlying biological process. We propose to leverage this information through a hybrid method that detects selection using an R:S-based test focused on the set of non-terminal branch mutations from a lineage tree. When tested on simulated data, this method exhibited increased sensitivity and the expected specificity. However, the actual performance of the method will depend on the affinity landscape of the response being analyzed. In the model, the landscape can be altered through the selection factor parameter (s). The strongest average selection occurs for s∼7, in which case the first advantageous mutation provides most of the selective advantage. To see that this is the case, consider that cells in the simulation start out with a 40% probability of dying at each generation and, when s=7, this decreases to 6% after the first advantageous mutation (a decrease of 34%). The second advantageous mutation decreases the probability of death to 1% per generation (a decrease of only 5%), and further decreases provide little benefit given the relatively short time-scale of B cell clonal expansion. Under these conditions, it is easy to see why there is little selective pressure on mutations near the leaves of a lineage tree. To assume a limit on affinity maturation and a scheme of diminishing returns seems reasonable, though whether real immune responses operate in a similar fashion is unclear, as the shape of actual affinity landscapes has not been determined. For these reasons it was critical to demonstrate the benefits of the hybrid method on experimental data. Indeed, using mutations from non-terminal branches in isotype switched IgG sequences from a healthy individual led to a significant increase in the estimated positive and negative selection strength in the CDR and FWR respectively. An additional benefit of the hybrid method is that many PCR errors, which are likely to appear on terminal branches, will be filtered.
With greater prevalence and affordability of next-generation sequencing technologies, larger and deeper sequencing of Ig repertoires is becoming more common. The hybrid approach developed here can take advantage of the clonal information inherent in these data, and provide analyses that will lead to more powerful and accurate insights into the evolution of B cell immune responses and malignant clones.
Supplementary Material
Footnotes
This work was supported in part by NIH grant R03AI092379. M.U. was supported in part by NIH grant T15 LM07056. Computational resources were provided by the Yale University Biomedical High Performance Computing Center (NIH grant RR19895).
References
- 1.Weigert M, Gatmaitan L, Loh E, Schilling J, Hood L. Rearrangement of genetic information may produce immunoglobulin diversity. Nature. 1978;276:785–790. doi: 10.1038/276785a0. [DOI] [PubMed] [Google Scholar]
- 2.Weigert M, Perry R, Kelley D, Hunkapiller T, Schilling J, Hood L. The joining of V and J gene segments creates antibody diversity. Nature. 1980;283:497–499. doi: 10.1038/283497a0. [DOI] [PubMed] [Google Scholar]
- 3.Tonegawa S. Somatic generation of antibody diversity. Nature. 1983;302:575–581. doi: 10.1038/302575a0. [DOI] [PubMed] [Google Scholar]
- 4.Longo NS, Lipsky PE. Why do B cells mutate their immunoglobulin receptors? Trends in immunology. 2006;27:374–380. doi: 10.1016/j.it.2006.06.007. [DOI] [PubMed] [Google Scholar]
- 5.McKean D, Huppi K, Bell M, Staudt L, Gerhard W, Weigert M. Generation of antibody diversity in the immune response of BALB/c mice to influenza virus hemagglutinin. Proceedings of the National Academy of Sciences of the United States of America. 1984;81:3180–3184. doi: 10.1073/pnas.81.10.3180. [DOI] [PMC free article] [PubMed] [Google Scholar]
- 6.Kleinstein SH, Louzoun Y, Shlomchik MJ. Journal of immunology. Vol. 171. Baltimore, Md.: 2003. 1950. Estimating hypermutation rates from clonal tree data; pp. 4639–49. [DOI] [PubMed] [Google Scholar]
- 7.Anderson SM, Khalil A, Uduman M, Hershberg U, Louzoun Y, Haberman AM, Kleinstein SH, Shlomchik MJ. Taking advantage: high-affinity B cells in the germinal center have lower death rates, but similar rates of division, compared to low-affinity cells. Journal of immunology. 2009;183:7314–7325. doi: 10.4049/jimmunol.0902452. [DOI] [PMC free article] [PubMed] [Google Scholar]
- 8.Shlomchik MJ, Marshak-Rothstein A, Wolfowicz CB, Rothstein TL, Weigert MG. The role of clonal selection and somatic mutation in autoimmunity. Nature. 1987;328:805–811. doi: 10.1038/328805a0. [DOI] [PubMed] [Google Scholar]
- 9.Shlomchik MJ, Watts P, Weigert MG, Litwin S. Clone: a Monte-Carlo computer simulation of B cell clonal expansion, somatic mutation, and antigen-driven selection. Current topics in microbiology and immunology. 1998;229:173–197. doi: 10.1007/978-3-642-71984-4_13. [DOI] [PubMed] [Google Scholar]
- 10.MacLennan IC. Germinal centers. Annual review of immunology. 1994;12:117–139. doi: 10.1146/annurev.iy.12.040194.001001. [DOI] [PubMed] [Google Scholar]
- 11.Rajewsky K. Clonal selection and learning in the antibody system. Nature. 1996;381:751–758. doi: 10.1038/381751a0. [DOI] [PubMed] [Google Scholar]
- 12.Takahashi Y, Dutta PR, Cerasoli DM, Kelsoe G. In situ studies of the primary immune response to (4-hydroxy-3-nitrophenyl)acetyl. V. Affinity maturation develops in two stages of clonal selection. The Journal of experimental medicine. 1998;187:885–895. doi: 10.1084/jem.187.6.885. [DOI] [PMC free article] [PubMed] [Google Scholar]
- 13.Shlomchik MJ, Aucoin AH, Pisetsky DS, Weigert MG. Structure and function of anti-DNA autoantibodies derived from a single autoimmune mouse. Proceedings of the National Academy of Sciences of the United States of America. 1987;84:9150–9154. doi: 10.1073/pnas.84.24.9150. [DOI] [PMC free article] [PubMed] [Google Scholar]
- 14.Kim HJ, Berek C. B cells in rheumatoid arthritis. Arthritis research. 2000;2:126–131. doi: 10.1186/ar77. [DOI] [PMC free article] [PubMed] [Google Scholar]
- 15.Silverman GJ, Carson DA. Roles of B cells in rheumatoid arthritis. Arthritis research & therapy 5. 2003;(Suppl 4):S1–S6. doi: 10.1186/ar1010. [DOI] [PMC free article] [PubMed] [Google Scholar]
- 16.Qin Y, Duquette P, Zhang Y, Talbot P, Poole R, Antel J. Clonal expansion and somatic hypermutation of V(H) genes of B cells from cerebrospinal fluid in multiple sclerosis. The Journal of clinical investigation. 1998;102:1045–1050. doi: 10.1172/JCI3568. [DOI] [PMC free article] [PubMed] [Google Scholar]
- 17.Zuckerman NS, Hazanov H, Barak M, Edelman H, Hess S, Shcolnik H, Dunn-Walters D, Mehr R. Somatic hypermutation and antigen-driven selection of B cells are altered in autoimmune diseases. Journal of autoimmunity. 2010;35:325–335. doi: 10.1016/j.jaut.2010.07.004. [DOI] [PubMed] [Google Scholar]
- 18.Von Büdingen HC, Kuo TC, Sirota M, van Belle CJ, Apeltsin L, Glanville J, Cree BA, Gourraud PA, Schwartzburg A, Huerta G, Telman D, Sundar PD, Casey T, Cox DR, Hauser SL. B cell exchange across the blood-brain barrier in multiple sclerosis. The Journal of clinical investigation. 2012;122:4533–4543. doi: 10.1172/JCI63842. [DOI] [PMC free article] [PubMed] [Google Scholar]
- 19.Lossos IS, Okada CY, Tibshirani R, Warnke R, Vose JM, Greiner TC, Levy R. Molecular analysis of immunoglobulin genes in diffuse large B-cell lymphomas. Blood. 2000;95:1797–1803. [PubMed] [Google Scholar]
- 20.Degan M, Bomben R, Bo MD, Zucchetto A, Nanni P, Rupolo M, Steffan A, Attadia V, Ballerini PF, Damiani D, Pucillo C, Del Poeta G, Colombatti A, Gattei V. Analysis of IgV gene mutations in B cell chronic lymphocytic leukaemia according to antigen-driven selection identifies subgroups with different prognosis and usage of the canonical somatic hypermutation machinery. British journal of haematology. 2004;126:29–42. doi: 10.1111/j.1365-2141.2004.04985.x. [DOI] [PubMed] [Google Scholar]
- 21.Bomben R, Dal Bo M, Zucchetto A, Zaina E, Nanni P, Sonego P, Del Poeta G, Degan M, Gattei V. Mutational status of IgV(H) genes in B-cell chronic lymphocytic leukemia and prognosis: percent mutations or antigen-driven selection? Leukemia: official journal of the Leukemia Society of America, Leukemia Research Fund, U.K. 2005;19:1490–1492. doi: 10.1038/sj.leu.2403830. [DOI] [PubMed] [Google Scholar]
- 22.Smith DS, Creadon G, Jena PK, Portanova JP, Kotzin BL, Wysocki LJ. Journal of immunology. Vol. 156. Baltimore, Md.: 1996. 1950. Di- and trinucleotide target preferences of somatic mutagenesis in normal and autoreactive B cells; pp. 2642–2652. [PubMed] [Google Scholar]
- 23.Shapiro GS, Aviszus K, Ikle D, Wysocki LJ. Journal of immunology. Vol. 163. Baltimore, Md.: 1999. 1950. Predicting regional mutability in antibody V genes based solely on di- and trinucleotide sequence composition; pp. 259–268. [PubMed] [Google Scholar]
- 24.Cowell LG, Kepler TB. Journal of immunology. Vol. 164. Baltimore, Md.: 2000. 1950. The nucleotide-replacement spectrum under somatic hypermutation exhibits microsequence dependence that is strand-symmetric and distinct from that under germline mutation; pp. 1971–1976. [DOI] [PubMed] [Google Scholar]
- 25.Hershberg U, Uduman M, Shlomchik MJ, Kleinstein SH. Improved methods for detecting selection by mutation analysis of Ig V region sequences. International immunology. 2008;20:683–694. doi: 10.1093/intimm/dxn026. [DOI] [PubMed] [Google Scholar]
- 26.Chang B, Casali P. The CDR1 sequences of a major proportion of human germline Ig VH genes are inherently susceptible to amino acid replacement. Immunology today. 1994;15:367–373. doi: 10.1016/0167-5699(94)90175-9. [DOI] [PMC free article] [PubMed] [Google Scholar]
- 27.Lossos IS, Tibshirani R, Narasimhan B, Levy R. The Inference of Antigen Selection on Ig Genes. J Immunol. 2000;165:5122–5126. doi: 10.4049/jimmunol.165.9.5122. [DOI] [PubMed] [Google Scholar]
- 28.Dunn-Walters DK, Spencer J. Strong intrinsic biases towards mutation and conservation of bases in human IgVH genes during somatic hypermutation prevent statistical analysis of antigen selection. Immunology. 1998;95:339–345. doi: 10.1046/j.1365-2567.1998.00607.x. [DOI] [PMC free article] [PubMed] [Google Scholar]
- 29.Bose B, Sinha S. Problems in using statistical analysis of replacement and silent mutations in antibody genes for determining antigen-driven affinity selection. Immunology. 2005;116:172–183. doi: 10.1111/j.1365-2567.2005.02208.x. [DOI] [PMC free article] [PubMed] [Google Scholar]
- 30.Uduman M, Yaari G, Hershberg U, Stern JA, Shlomchik MJ, Kleinstein SH. Detecting selection in immunoglobulin sequences. Nucleic acids research. 2011;39:W499–504. doi: 10.1093/nar/gkr413. [DOI] [PMC free article] [PubMed] [Google Scholar]
- 31.Yaari G, Uduman M, Kleinstein SH. Quantifying selection in high-throughput Immunoglobulin sequencing data sets. Nucleic acids research. 2012;40(17):e134. doi: 10.1093/nar/gks457. [DOI] [PMC free article] [PubMed] [Google Scholar]
- 32.MacDonald CM, Boursier L, D'Cruz DP, Dunn-Walters DK, Spencer J. Mathematical analysis of antigen selection in somatically mutated immunoglobulin genes associated with autoimmunity. Lupus. 2010;19:1161–1170. doi: 10.1177/0961203310367657. [DOI] [PubMed] [Google Scholar]
- 33.Clement M, Posada D, Crandall KA. TCS: a computer program to estimate gene genealogies. Molecular ecology. 2000;9:1657–1659. doi: 10.1046/j.1365-294x.2000.01020.x. [DOI] [PubMed] [Google Scholar]
- 34.Dunn-Walters DK, Belelovsky A, Edelman H, Banerjee M, Mehr R. The dynamics of germinal centre selection as measured by graph-theoretical analysis of mutational lineage trees. Developmental immunology. 2002;9:233–243. doi: 10.1080/10446670310001593541. [DOI] [PMC free article] [PubMed] [Google Scholar]
- 35.Barak M, Zuckerman NS, Edelman H, Unger R, Mehr R. IgTree: creating Immunoglobulin variable region gene lineage trees. Journal of immunological methods. 2008;338:67–74. doi: 10.1016/j.jim.2008.06.006. [DOI] [PubMed] [Google Scholar]
- 36.Sablitzky F, Wildner G, Rajewsky K. Somatic mutation and clonal expansion of B cells in an antigen-driven immune response. The EMBO journal. 1985;4:345–350. doi: 10.1002/j.1460-2075.1985.tb03635.x. [DOI] [PMC free article] [PubMed] [Google Scholar]
- 37.Jacob J, Kelsoe G. In situ studies of the primary immune response to (4-hydroxy-3-nitrophenyl)acetyl. II. A common clonal origin for periarteriolar lymphoid sheath-associated foci and germinal centers. The Journal of experimental medicine. 1992;176:679–687. doi: 10.1084/jem.176.3.679. [DOI] [PMC free article] [PubMed] [Google Scholar]
- 38.Kocks C, Rajewsky K. Stepwise intraclonal maturation of antibody affinity through somatic hypermutation. Proceedings of the National Academy of Sciences of the United States of America. 1988;85:8206–8210. doi: 10.1073/pnas.85.21.8206. [DOI] [PMC free article] [PubMed] [Google Scholar]
- 39.Jacob J, Kassir R, Kelsoe G. In situ studies of the primary immune response to (4-hydroxy-3-nitrophenyl)acetyl. I. The architecture and dynamics of responding cell populations. The Journal of experimental medicine. 1991;173:1165–1175. doi: 10.1084/jem.173.5.1165. [DOI] [PMC free article] [PubMed] [Google Scholar]
- 40.Jacob J, Przylepa J, Miller C, Kelsoe G. In situ studies of the primary immune response to (4-hydroxy-3-nitrophenyl)acetyl. III. The kinetics of V region mutation and selection in germinal center B cells. The Journal of experimental medicine. 1993;178:1293–1307. doi: 10.1084/jem.178.4.1293. [DOI] [PMC free article] [PubMed] [Google Scholar]
- 41.Dunn-Walters DK, Edelman H, Mehr R. Immune system learning and memory quantified by graphical analysis of B-lymphocyte phylogenetic trees. Bio Systems. 2004;76:141–155. doi: 10.1016/j.biosystems.2004.05.011. [DOI] [PubMed] [Google Scholar]
- 42.Steiman-Shimony A, Edelman H, Barak M, Shahaf G, Dunn-Walters D, Stott DI, Abraham RS, Mehr R. Immunoglobulin variable-region gene mutational lineage tree analysis: application to autoimmune diseases. Autoimmunity reviews. 2006;5:242–251. doi: 10.1016/j.autrev.2005.07.008. [DOI] [PubMed] [Google Scholar]
- 43.Tabibian-Keissar H, Zuckerman NS, Barak M, Dunn-Walters DK, Steiman-Shimony A, Chowers Y, Ofek E, Rosenblatt K, Schiby G, Mehr R, Barshack I. B-cell clonal diversification and gut-lymph node trafficking in ulcerative colitis revealed using lineage tree analysis. European journal of immunology. 2008;38:2600–2609. doi: 10.1002/eji.200838333. [DOI] [PubMed] [Google Scholar]
- 44.Zuckerman NS, McCann KJ, Ottensmeier CH, Barak M, Shahaf G, Edelman H, Dunn-Walters D, Abraham RS, Stevenson FK, Mehr R. Ig gene diversification and selection in follicular lymphoma, diffuse large B cell lymphoma and primary central nervous system lymphoma revealed by lineage tree and mutation analyses. International immunology. 2010;22:875–887. doi: 10.1093/intimm/dxq441. [DOI] [PubMed] [Google Scholar]
- 45.Shahaf G, Barak M, Zuckerman NS, Swerdlin N, Gorfine M, Mehr R. Antigen-driven selection in germinal centers as reflected by the shape characteristics of immunoglobulin gene lineage trees: a large-scale simulation study. Journal of theoretical biology. 2008;255:210–222. doi: 10.1016/j.jtbi.2008.08.005. [DOI] [PubMed] [Google Scholar]
- 46.Church GM. The personal genome project. Molecular systems biology. 2005;1:2005.0030. doi: 10.1038/msb4100040. [DOI] [PMC free article] [PubMed] [Google Scholar]
- 47.Alamyar E, Giudicelli V, Li S, Duroux P, Lefranc MP. IMGT/HighV-QUEST: the IMGT® web portal for immunoglobulin (IG) or antibody and T cell receptor (TR) analysis from NGS high throughput and deep sequencing. Immunome research. 2012;8:26. [Google Scholar]
- 48.Lefranc MP, Pommié C, Ruiz M, Giudicelli V, Foulquier E, Truong L, Thouvenin-Contet V, Lefranc G. IMGT unique numbering for immunoglobulin and T cell receptor variable domains and Ig superfamily V-like domains. Developmental and comparative immunology. 2003;27:55–77. doi: 10.1016/s0145-305x(02)00039-3. [DOI] [PubMed] [Google Scholar]
- 49.Steiman-Shimony A, Edelman H, Hutzler A, Barak M, Zuckerman NS, Shahaf G, Dunn-Walters D, Stott DI, Abraham RS, Mehr R. Lineage tree analysis of immunoglobulin variable-region gene mutations in autoimmune diseases: chronic activation, normal selection. Cellular immunology. 2006;244:130–136. doi: 10.1016/j.cellimm.2007.01.009. [DOI] [PubMed] [Google Scholar]
Associated Data
This section collects any data citations, data availability statements, or supplementary materials included in this article.