

Abstract
Purpose
In humans, recent studies have correlated anogenital distance (AGD) in adult men to testicular function. While studies of a group of men suggest an association, the utility of AGD in an infertility evaluation remains uncertain. We sought to determine the utility of AGD to predict male fertility.
Methods
Between 2010 and 2011, men were recruited at a urology clinic to participate. AGD was measured using digital calipers in men being evaluated at a urology clinic. ANOVA and ROC analyses were used to determine correlations between AGD, fatherhood status, and semen parameters.
Results
In all, 473 men were included in the analysis with a mean age of 43 ± 13 years. Anogenital distance was significantly longer in men with higher sperm concentration, total sperm count, and total motile sperm count. In order to evaluate the discriminating ability of AGD, ROC curves were created comparing AGD and total testis volume. The area under the curve (AUC) was significantly larger for total testis volume compared to AGD when evaluating fertility (0.71 vs 0.63, p = 0.02). Similarly, there was a trend towards a higher AUC for testis volume compared to AGD for sperm concentration and total sperm count. Stratification of men with long/short AGD and large/small testes also did not improve the predictive value of AGD.
Conclusions
While AGD is associated with sperm production on a population level, at the individual level the distinction based AGD alone cannot accurately estimate the efficiency of spermatogenesis.
Keywords: Genitalia, Humans, Infertility, Perineum, Sperm
Introduction
A sexually dimorphic measure of genital development under hormonal influence, andogenital distance (AGD) was initially studied in animals.[1–3] More recently, human studies have also demonstrated that boys have longer perineal lengths (or AGD) than girls.[4–7] Human studies have also linked adult testicular function, as assessed by sperm and testosterone production, to AGD. [8–10] As AGD seems to be constant across a man’s adult life, the clinical utility of AGD has been suggested in studies of infertile men.[11] AGD is shorter in men with spermatogenic failure compared to genital duct obstruction in men presenting with azoospermia.[12] In addition, a retrospective examination of men undergoing varicocelectomy demonstrated that men with a longer AGD are more likely to benefit from varicocele repair implying possible clinical utility in patient counseling.[13]. Men with prostate cancer also demonstrated a shorter AGD compared to a control group also suggesting some clinical merit.[14]
However, the clinical utility of such measurements of fetal androgen exposure remains unclear to men presenting for an infertility evaluation.[15] While testis volume is routinely measured during a fertility evaluation, the added benefit to measure AGD is uncertain. We sought to investigate the predictive ability of AGD of infertile men in discriminating sperm production by comparing it to testis volume on an individual basis.
Methods
The methods of collection and cohort assembly have been previously reported.[8] Briefly, after obtaining Institutional Review Board approval from Baylor College of Medicine (IRB No. H-27133), patients were recruited from a urology clinic specializing in reproductive and sexual medicine from August 2010 through October 2011. Men were evaluated for general urology, fertility, sexual, and testosterone related concerns. Date of visit, reason for visit, observer, anthropomorphic measurements, and relevant laboratory data was recorded. All men provided written consent for participation.
Genital measurements
The methods of genital measurement have been previously described.[8] In the supine, frog-legged position with the legs abducted allowing the soles of the feet to meet, the distance from the posterior aspect of the scrotum to the anal verge was measured using a digital caliper (Neiko USA, Model No. 01407A). As has previously been reported, the correlation coefficient was 0.91 for AGD measurements suggesting good agreement between investigators.[8] In all, eight investigators collected data.
Testicular volume was estimated by palpation at the time of the physical examination by a single investigator (LIL) at approximately 25 to 27° Celsius. A Prader orchidometer was used to calibrate size estimates.[16]
Statistical analysis
Abnormal semen parameters were defined based on the WHO 5th edition of the manual on semen analyses.[17] For subgroup analyses, men were stratified into short/long AGD compared to the median for the group (37.6 mm). Men were also stratified into small/large total testis volume (<average of 16 cm3 per testis). ANOVA was used to compare continuous variables. Receiver Operating Characteristic (ROC) Curves were generated using maximum likelihood estimation to fit a binomial ROC curve to either continuously distributed data or ordinal category data. Comparisons were made using the technique of DeLong et al.[18] Multivariable logistic regression included age, race, body mass index, and date of collection. All p values were two sided. Analyses were performed using Stata 10 (StataCorp LP, College Station, Texas).
Results
In all, 473 men with fatherhood data were included in the analysis with a mean age of 43 ± 13.0. Individual characteristics are listed in Table 1. Mean AGD was 40.8 mm for general urology patients, 42.5 mm for erectile dysfunction patients, 40.1 mm for hypogonadism patients, 36.8 mm for infertility patients, and 42.3 mm for vasectomy patients. A total of 193 men had semen data available. Nine men not seen for infertility had semen data available. 86 % of men seen for infertility were childless. While comparisons between individuals diagnostic groups did not reach statistical significance due to limited patient numbers, childless men seemed to have shorter AGD (Table 2). The AUC of AGD for each urologic diagnosis is listed (Table 2).
Table 1.
Demographic, reproductive, and anthropomorphic characteristics of the cohort
| Characteristic | n | % or Mean (SD) | |
|---|---|---|---|
| Age category | <30 | 54 | 11.4 |
| 30–40 | 194 | 41.0 | |
| 40–50 | 97 | 20.5 | |
| 50+ | 128 | 27.1 | |
| Race | White | 398 | 84.1 |
| Other | 75 | 16.0 | |
| Father | No | 246 | 52.0 |
| Yes | 227 | 48.0 | |
| Office visit | General Urology | 38 | 8.1 |
| Erectile Dysfunction | 26 | 5.6 | |
| Hypogonadism | 101 | 21.6 | |
| Infertlity | 231 | 49.4 | |
| Vasectomy | 72 | 15.4 | |
| Height (cm) | 453 | 179.3 (7.4) | |
| Weight (kg) | 452 | 93.2 (18.1) | |
| Body Mass Index | Normal | 86 | 18.2 |
| Overweight | 219 | 46.3 | |
| Obese | 167 | 35.3 |
Table 2.
Comparison of AGD based on reason for office evaluation. P value represents ANOVA comparison
| Childless | Father | ||||
|---|---|---|---|---|---|
| Office Visit | n | mean AGD (cm) | n | mean AGD (cm) | p |
| General Urology | 11 | 35.6 | 27 | 42.9 | 0.18 |
| Erectile Dysfunction | 3 | 32 | 23 | 43.8 | 0.25 |
| Hypogonadism | 29 | 38.8 | 72 | 40.6 | 0.56 |
| Infertility | 199 | 36.3 | 32 | 40.4 | 0.09 |
| Vasectomy | 3 | 30.1 | 69 | 42.8 | 0.08 |
| Total | 243 | 36.4 | 223 | 41.9 | <0.01 |
As most men with semen data were evaluated for infertility, a majority had abnormal semen parameters as assessed by low sperm concentration, sperm motility, total sperm count, and total motile sperm count. Compared to fathers, childless men had a significant shorter AGD. Moreover, men with low sperm concentration, total sperm count, and total motile sperm count had a shorter AGD compared to men with normal semen parameters (Table 3).
Table 3.
Distribution of AGD based on reproductive variables. Subfertile semen parameters defined by WHO 5th edition of the manual on semen analyses
| Characteristic | n (%) | AGD (mean, SD) | p | |
|---|---|---|---|---|
| Father | No | 246 (52) | 36.4 (12.9) | <0.01 |
| Yes | 227 (48) | 41.9 (13.5) | ||
| Semen Volume | <1.5 | 29 (15) | 35.8 (15.0) | 0.99 |
| ≥1.5 | 160 (85) | 35.8 (11.6) | ||
| Sperm Concentration | <15 M/mL | 127 (66) | 34.3 (11.5) | <0.01 |
| ≥15 M/mL | 66 (34) | 39.4 (12.9) | ||
| Sperm Motility | <40 % | 121 (63) | 35.3 (12.4) | 0.38 |
| ≥40 % | 70 (37) | 36.9 (11.8) | ||
| Total Sperm Count | <39 M | 121 (63) | 33.6 (12.0) | <0.01 |
| ≥39 M | 70 (37) | 39.7 (11.4) | ||
| Total Motile Sperm Count | <9 M | 109 (58) | 33.8 (12.4) | <0.01 |
| ≥9 M | 79 (42) | 38.4 (11.2) |
In order to evaluate the discriminating ability of AGD, ROC curves were created comparing AGD and total testis volume (Fig. 1). The area under the curve (AUC) was significantly larger for total testis volume compared to AGD when evaluating fertility (0.71 vs 0.63, p = 0.02). Similarly, there was a trend towards a higher AUC for testis volume compared to AGD for sperm concentration and total sperm count (Table 4).
Fig. 1.
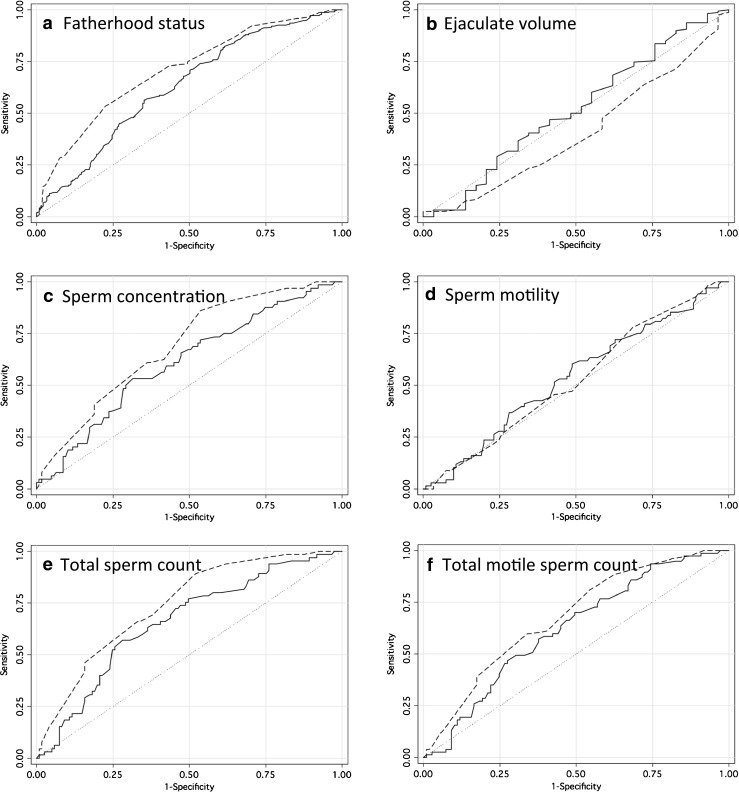
Receiver operating characteristic curves for AGD and total testis volume when examining measures of male fertility. Analysis examines the ability of genital measure to predict subfertility. Abnormal semen parameters defined by WHO 5th edition of the manual on semen analyses. Solid lines represent AGD. Dashed lines represent total testis volume. AUC given in Table 3. A. Fatherhood status (n = 454). B. Ejaculate volume (n = 187). C. Sperm concentration (n = 191). D. Sperm motility (n = 189). E. Total sperm count (n = 186). F. Total motile sperm count (n = 186)
Table 4.
Area of the curve (AUC) based on receiver operating characteristic analyses for AGD and total testis volume when examining measures of male fertility
| AUC | |||
|---|---|---|---|
| Characteristic | AGD | Total testis size | p |
| Fatherhood | 0.63 | 0.71 | 0.02 |
| Low Ejaculate Volume (<1.5 mL) | 0.52 | 0.41 | 0.05 |
| Oligospermia (<15 M/mL) | 0.61 | 0.69 | 0.1 |
| Asthenospermia (<40 %) | 0.54 | 0.53 | 0.81 |
| Low Total Sperm Count (<39 M) | 0.66 | 0.74 | 0.08 |
| Low Total Motile Sperm Count (<9 M) | 0.62 | 0.68 | 0.24 |
Next, we stratified men based on genital measurement to compare the implications of short/long AGD and small/large testes. While small testes were associated with lower sperm concentration, men with short AGD but large testes had relatively higher sperm counts. Sperm motility and volume did not vary based on genital measures. Fatherhood status was also best correlated with testis volume compared to AGD but a trend was detected so that two abnormal genital measures led to a higher rate of childlessness compared to only one (Table 5).
Table 5.
Men stratified into short (<median AGD, 37.6 mm) versus long (≥ median AGD) as well as small (<average testis size of 16 cm3) versus large testis (≥ average testis size of 16 cm3). Mean values of AGD, total testis volume, semen volume, sperm concentration, and sperm motility are listed. AUC (area under the curve) for each subgroup listed using AGD and testis volume as predictors and fatherhood the outcome.
| AUC | |||||||||||
|---|---|---|---|---|---|---|---|---|---|---|---|
| AGD | Testis | n | AGD (mm) | Total testis volume (mL) | Semen volume (mL) | Sperm concentration (M/mL) | Sperm motility (%) | Fathers n (%) | AGD | Testis | p |
| Short | Small | 71 | 26.8 | 26.5 | 2.6 | 7.1 | 24.7 | 16 (22.5) | 0.55 | 0.66 | 0.25 |
| Short | Large | 165 | 29.6 | 38.5 | 2.5 | 17.2 | 25.4 | 76 (46.1) | 0.59 | 0.68 | 0.11 |
| Long | Small | 39 | 51.1 | 25.8 | 3.5 | 2.3 | 14.4 | 12 (30.8) | 0.48 | 0.62 | 0.41 |
| Long | Large | 194 | 49.2 | 39.2 | 2.8 | 29.7 | 31.7 | 122 (62.9) | 0.57 | 0.64 | 0.20 |
P value represents comparison between AGD and testis volume to predict fatherhood
After adjusting for age, race, body mass index, and date of measurement, multivariable logistic regression models demonstrated that testis size and AGD were significantly associated with fertility and sperm concentration (p < 0.01). When both genital measures were incorporated into the model to examine the odds of oligospermia (concentration < 15 M/mL), testis size remained significant (p < 0.01) but AGD did not (p = 0.09).
Discussion
AGD is associated with infertility, low sperm concentrations, and low total sperm counts. However, there was a trend suggesting testis volume was more reliable for an individual man. While AGD is associated with sperm production on a population level, at the individual level the distinction based AGD alone cannot accurately distinguish between fertile and subfertile men enough for clinical use. Indeed, the AUC is below the level of 0.75 which is generally considered a fair discriminator of a given outcome.[19] Moreover, on subanalyses, testis volume appeared to be a better discriminator of male fertility compared to AGD.
During sexual development the immature genital precursors migrate ventrally via an androgen mediated pathway.[20] The anogenital distance has been used to sex animals, since males have longer lengths than females.[1–3] Moreover, human studies in infants have also established that boys have longer perineal lengths than girls.[4–7] Investigators have used the anogenital distance as a marker for normal genital development. In humans, girls with CAH have been shown to have longer perineal lengths than their normal counterparts.[21] Normal androgen exposure during defined gestational time periods, have been correlated with normal genital lengths and reproductive function in rodents.[22, 23] Thus a more masculinized phenotype would display longer genital lengths and higher sperm counts.
The goal of the study was to assess the relationship between AGD and fertility on an individual basis in order to determine clinical utility. To accomplish this, fertility was defined in several ways. Fatherhood status (which does have limitations) as well as fertility cutoffs from the WHO 5th edition were utilized. Using different measures of male fertility, AGD failed to perform adequately to routinely guide clinical care.
Prior literature has demonstrated that AGD is associated with sperm production. Mendiola et al. found a positive linear relationship between sperm concentration and AGD in college aged men.[9] A similar association among an older cohort presenting to a urology clinic was also demonstrated.[8] Examining infertile men, it was shown that a longer AGD suggests improved varicocelectomy outcomes and a lower likelihood of spermatogenic failure in azoospermic men.[12, 13] However, all prior studies examined large cohorts of men to determine the association between testicular function and AGD. In the current report, we examined the predictive value of AGD for an individual.
While the commonly measured and validated measure of testicular size remains more useful for counseling an individual man presenting for an infertility evaluation, AGD does provide some discrimination. Indeed, the current report and prior studies have demonstrated a relationship between AGD and sperm production. As AGD can be measured earlier in life than sperm production, AGD may provide an early window into a man’s reproductive potential. While testis volume may also be measured, cryptorchism may complicate estimation early in life, especially among premature infants. Moreover, when comparing populations, AGD may provide a useful, more reliable, and less variable metric than testis volume or sperm production as the latter two may be influenced by trauma, age, or medical treatment (i.e. testosterone therapy).[11, 24] However, newer reports does suggest some plasticity to AGD in adult life thus questioning this theoretical benefit.[25]
It is uncertain why AGD is correlated with certain semen parameters (e.g. sperm concentration) but not others (e.g. motility or volume). While concentration may reflect germ cell number, motility may reflect germ cell number, and volume may reflect seminal vesicle and prostate function; rodent studies imply that all may be impacted.[22, 23] However, in human, only changes in sperm numbers were identified.
Certain limitations warrant mention. Working in a referral center for male infertility, it was not always possible to blind observers to the men's diagnoses, which theoretically can have led to observer bias. However, the semen analysis was rarely known at the time of AGD measurement. In addition, only men referred to and evaluated in our clinic were eligible for enrollment; therefore, it is possible that our patient population does not represent all men. Indeed, a majority of men with semen data were evaluated for infertility which may impact the generalizability. However, as half of the men were fathers both fertile and infertile men were included. While psychological and physical discomfort may be a concern regarding AGD measurement, <0.5 % of men expressed any reservation regarding the measurement.
Nevertheless, the current study is the first to examine the benefit of an AGD measurement in a male infertility evaluation. While providing some information about sperm production, other routinely collected parameters, such as testis size are more strongly correlated with fertility. However, AGD does correlate with sperm production on a population level and suggests AGD can provide some information about a man’s reproductive potential.
Acknowledgments
Conflicts of interest
The authors have no conflicts of interest to disclose.
Footnotes
Capsule
In humans, recent studies have correlated anogenital distance (AGD) in adult men to testicular function. While AGD is associated with sperm production on a population level, at the individual level the distinction based AGD alone cannot accurately estimate the efficiency of spermatogenesis.
References
- 1.Greenham LW, Greenham V. Sexing mouse pups. Lab Anim. 1977;11:181–184. doi: 10.1258/002367777780936620. [DOI] [PubMed] [Google Scholar]
- 2.Hsieh MH, Breyer BN, Eisenberg ML, Baskin LS. Associations among hypospadias, cryptorchidism, anogenital distance, and endocrine disruption. Curr Urol Rep. 2008;9:137–142. doi: 10.1007/s11934-008-0025-0. [DOI] [PubMed] [Google Scholar]
- 3.Marois G. [Action of progesterone, testosterone and estradiol on the anogenital distance and somatic sexual differentiation in rats]. Biol Med (Paris) 1968;57:44–90. [PubMed]
- 4.Thankamony A, Ong KK, Dunger DB, Acerini CL, Hughes IA. Anogenital distance from birth to 2 years: a population study. Environ Health Perspect. 2009;117:1786–1790. doi: 10.1289/ehp.0900881. [DOI] [PMC free article] [PubMed] [Google Scholar]
- 5.Torres-Sanchez L, Zepeda M, Cebrian ME, Belkind-Gerson J, Garcia-Hernandez RM, Belkind-Valdovinos U, et al. Dichlorodiphenyldichloroethylene exposure during the first trimester of pregnancy alters the anal position in male infants. Ann N Y Acad Sci. 2008;1140:155–162. doi: 10.1196/annals.1454.004. [DOI] [PMC free article] [PubMed] [Google Scholar]
- 6.Salazar-Martinez E, Romano-Riquer P, Yanez-Marquez E, Longnecker MP, Hernandez-Avila M. Anogenital distance in human male and female newborns: a descriptive, cross-sectional study. Environ Health. 2004;3:8. doi: 10.1186/1476-069X-3-8. [DOI] [PMC free article] [PubMed] [Google Scholar]
- 7.Sathyanarayana S, Beard L, Zhou C, Grady R. Measurement and correlates of ano-genital distance in healthy, newborn infants. Int J Androl. 2010;33:317–323. doi: 10.1111/j.1365-2605.2009.01044.x. [DOI] [PMC free article] [PubMed] [Google Scholar]
- 8.Eisenberg ML, Hsieh MH, Walters RC, Krasnow R, Lipshultz LI. The relationship between anogenital distance, fatherhood, and fertility in adult men. PLoS One. 2011;6:e18973. doi: 10.1371/journal.pone.0018973. [DOI] [PMC free article] [PubMed] [Google Scholar]
- 9.Mendiola J, Stahlhut RW, Jorgensen N, Liu F, Swan SH. Shorter anogenital distance predicts poorer semen quality in young Men in rochester, New york. Environ Health Perspect. 2011;119:958–963. doi: 10.1289/ehp.1103421. [DOI] [PMC free article] [PubMed] [Google Scholar]
- 10.Eisenberg ML, Jensen TK, Walters RC, Skakkebaek NE, Lipshultz LI. The relationship between anogenital distance and reproductive hormone levels in adult men. J Urol. 2012;187:594–598. doi: 10.1016/j.juro.2011.10.041. [DOI] [PubMed] [Google Scholar]
- 11.Eisenberg ML, Hsieh TC, Lipshultz LI. The relationship between anogenital distance and age. Andrology. 2013;1:90–93. doi: 10.1111/j.2047-2927.2012.00019.x. [DOI] [PubMed] [Google Scholar]
- 12.Eisenberg ML, Shy M, Chanc Walters R, Lipshultz LI. The relationship between anogenital distance and azoospermia in adult men. Int J Androl. 2012;35:726–730. doi: 10.1111/j.1365-2605.2012.01275.x. [DOI] [PubMed] [Google Scholar]
- 13.Eisenberg ML, Shy M, Herder D, Walters RC, Lipshultz LI. The relationship between anogenital distance and the efficacy of varicocele repair. BJU Int. 2012;110:E927–E930. doi: 10.1111/j.1464-410X.2012.11154.x. [DOI] [PubMed] [Google Scholar]
- 14.Castano-Vinyals G, Carrasco E, Lorente JA, Sabate Y, Cirac-Claveras J, Pollan M, et al. Anogenital distance and the risk of prostate cancer. BJU Int. 2012;110:E707–E710. doi: 10.1111/j.1464-410X.2012.11516.x. [DOI] [PubMed] [Google Scholar]
- 15.Dean A, Sharpe RM. Clinical review: Anogenital distance or digit length ratio as measures of fetal androgen exposure: relationship to male reproductive development and its disorders. The Journal of Clinical Endocrinology and Metabolism. 2013;98:2230–2238. doi: 10.1210/jc.2012-4057. [DOI] [PubMed] [Google Scholar]
- 16.Behre HM, Nashan D, Nieschlag E. Objective measurement of testicular volume by ultrasonography: evaluation of the technique and comparison with orchidometer estimates. Int J Androl. 1989;12:395–403. doi: 10.1111/j.1365-2605.1989.tb01328.x. [DOI] [PubMed] [Google Scholar]
- 17.Cooper TG, Noonan E, von Eckardstein S, Auger J, Baker HW, Behre HM, et al. World Health Organization reference values for human semen characteristics. Hum Reprod Update. 2010;16:231–245. doi: 10.1093/humupd/dmp048. [DOI] [PubMed] [Google Scholar]
- 18.DeLong ER, DeLong DM, Clarke-Pearson DL. Comparing the areas under two or more correlated receiver operating characteristic curves: a nonparametric approach. Biometrics. 1988;44:837–845. doi: 10.2307/2531595. [DOI] [PubMed] [Google Scholar]
- 19.Vittinghoff E, Glidden DV, Shiboski SC, McCulloch CE. Regression Methods in Biostatistics: Linear, Logistic, Survival, and Repeated Measures Models. New York: Springer; 2005. [Google Scholar]
- 20.Larson WJ. Human Embryology. 2. New York: Churchill Livingstone; 1997. [Google Scholar]
- 21.Callegari C, Everett S, Ross M, Brasel JA. Anogenital ratio: measure of fetal virilization in premature and full-term newborn infants. J Pediatr. 1987;111:240–243. doi: 10.1016/S0022-3476(87)80075-6. [DOI] [PubMed] [Google Scholar]
- 22.Macleod DJ, Sharpe RM, Welsh M, Fisken M, Scott HM, Hutchison GR, et al. Androgen action in the masculinization programming window and development of male reproductive organs. Int J Androl. 2010;33:279–287. doi: 10.1111/j.1365-2605.2009.01005.x. [DOI] [PubMed] [Google Scholar]
- 23.Welsh M, MacLeod DJ, Walker M, Smith LB, Sharpe RM. Critical androgen-sensitive periods of rat penis and clitoris development. Int J Androl. 2010;33:e144–e152. doi: 10.1111/j.1365-2605.2009.00978.x. [DOI] [PMC free article] [PubMed] [Google Scholar]
- 24.Moss JL, Crosnoe LE, Kim ED. Effect of rejuvenation hormones on spermatogenesis. Fertil Steril. 2013;99:1814–1820. doi: 10.1016/j.fertnstert.2013.04.003. [DOI] [PubMed] [Google Scholar]
- 25.Mitchell RT, Mungall W, McKinnell C, Sharpe RM, Cruickshanks L, Milne L et al. Anogenital distance (AGD) plasticity in adulthood: Implications for its use as a biomarker of fetal androgen action. Endocrinology 2014:en20141534. [DOI] [PMC free article] [PubMed]