Abstract
Very few studies have been reported the function of wild type IDH1 in tumor progress. Previously, we reported that IDH1 correlated with pathological grade and metastatic potential inversely in human osteosarcoma. Here, IDH1 was found lower expressed in osteosarcoma tissues than that of adjacent normal bone tissues. In addition, we observed in vitro anti-proliferation and pro-apoptosis effects of up-regulated IDH1 on osteosarcoma cell lines. The migration and invasion activity was also markedly reduced by IDH1 up-regulation. Unexpectedly, IDH1 up-regulation also suppressed tumor growth and metastasis in vivo. Therefore, IDH1 may represent a potential novel treatment and preventive strategy for osteosarcoma.
Keywords: Isocitrate dehydrogenase 1, Proliferation, Migration, Invasion, Osteosarcoma
1. Introduction
Osteosarcoma is currently the most common primary malignant bone tumor with high recurrence and metastatic characteristics for children and adolescents [1]. Aberrant regulation of cell growth and invasion occurs commonly in osteosarcoma and may play an essential role in its progression and metastasis. During the last decade, chemotherapy for osteosarcoma by inhibiting cell growth or invasion has been investigated. In addition, surgery combined with chemotherapy for osteosarcoma treatment has also been studied. However, the survival rate of osteosarcoma patients is still low for those with relapse and metastasis [2,3].
Understanding the molecular mechanisms that drive the osteosarcoma progression and metastatic process would facilitate the development of better treatment strategies to improve the patient prognosis and management, and it could also help to identify novel molecular prognostic factors and therapeutic targets [2,4]. One candidate molecule which has such a potential is isocitrate dehydrogenase 1 (IDH1). IDH1 is a cytosolic Nicotinamide Adenine Dinucleotide Phosphate (NADP)-dependent enzyme that catalyzes decarboxylation of isocitrate into α-ketoglutarate [5]. Shechter et al. reported that IDH1 activity was coordinately regulated with the cholesterol and fatty acid biosynthetic pathways, suggesting that IDH1 provides the cytosolic NADPH required by these pathways [6].
Recently, although there are extensive researches on complex roles of IDH1 mutations in tumor biology, so far very few studies have been performed to investigate the function of wild type IDH1 in tumor cell development. Memon et al. found that expression of IDH1 was down-regulated during human urinary bladder cancer progression [7]. In our previous study, IDH1-positive expression was found frequently in clinical osteosarcoma biopsies, and interestingly the level of IDH1 expression tended to inversely correlate with the pathological grade and metastatic potential of osteosarcoma [8]. Meanwhile, Amary et al. further reported that, No mutated IDH1 was found in 222 osteosarcomas [9]. Therefore, it came with the question what role wild type IDH1 plays in osteosarcoma progress.
In present study, the expression of IDH1 in human osteosarcoma tissues vs. adjacent normal bone tissues was measured. Then, we further investigated whether and how IDH1 play a role in the regulation of proliferation, migration and invasion in two human osteosarcoma cell lines MG63 and 143B in vitro. In addition, the role of IDH1 on tumor growth and metastasis was further studied in 143B cell line implanted nude mice in vivo. Our results indicated that IDH1 up-regulation showed the tumor suppressor effects, including the anti-proliferation, anti-migration and anti-invasion in osteosarcoma. This study is the first to describe the anti-osteosarcoma effect of IDH1, both in vitro and in vivo, and may implicate the novel treatment and preventive strategy in IDH1 down-regulated osteosarcoma.
2. Materials and methods
2.1. Ethics
All animal experiments were carried out according to relevant national and international guidelines and approved by the Stanford Institutional Animal Care and Use Committee (IACUC). All experiments strictly followed the panel’s specific guidelines regarding the care, treatment and euthanasia of animals used in the study.
2.2. Clinical samples
Slices of formalin-fixed and paraffin-embedded primary osteosarcoma tissues were obtained from biopsies in 44 patients before administration of neo-adjuvant chemotherapy according to the Chinese national ethical guidelines (‘Code for Proper Secondary Use of Human Tissue’, Chinese Federation of Medical Scientific Societies). Clinical information of these 44 patients was described in our previous report [8]. Adjacent normal bone tissue samples were randomized obtained from 16 of these 44 osteosarcoma patients after surgical resection (data shown in Supplement Table 1). Both osteosarcoma and normal bone tissue biopsies were histologically characterized by pathologists according to the criteria defined by the World Health Organization. Written informed consent was obtained from each patient before entering this study, and all study protocols were approved by the Ethics Committee for Clinical Research of Wuhan University, China.
2.3. Immunohistochemistry and its evaluation for biopsies
The methods for immunohistochemistry and its evaluation for biopsies were described in our previous study [8]. Staining patterns were classified from 0 to 5, combining percentage and staining intensity of positive cells in osteosarcoma and normal bones [10,11]. The staining intensity was scored as 0 (no staining), 1 (very weak), 2 (weak), 3 (moderate), 4 (intense) and 5 (very intense). Positive rate score of osteosarcoma cells was: 0, absence of cytoplasmic stained cell; 1, <10% positive cells; 2, 10–25% positive cells; 3, 26–50% positive cells; 4, 51–75% positive cells; 5, >75% positive cells. The expression of IDH1 in each slide was scored as the average of intensity and positive rate scores. For statistical analysis, osteosarcoma patients were also grouped as either low-staining group (scale 0–3) or high-staining group (scale 4–5). Biopsied samples stained less than score 1 was considered as a negative result. Anti-IDH1 rabbit monoclonal antibody (mAb) (Proteintech Group, Chicago, IL, USA) was used as the primary antibody. Negative control was obtained by omitting the primary antibody. Assessment of immunostaining intensity was completed by three independent observers. At least 5 separated foci of neoplastic infiltration in each biopsied tissue sample were analyzed.
2.4. Osteosarcoma and osteoblastic cells
The human osteosarcoma cell lines MG63 and 143B were obtained from ATCC through LGC Promochem (Wesel, Germany). Primary cultures of osteoblasts isolated from non-pathological human bone were served as normal controls. All cells were cultured in RPMI 1640 medium (Sigma, MO, USA) with 10% fetal bovine serum (FBS) (Amresco, Cleveland, OH, USA) and antibiotics (100 IU/mL penicillin and 100 μg/mL streptomycin). Cells were cultured according to standard techniques in a humidified incubator in 5% (v/v) CO2 atmosphere.
2.5. Establishment of stable osteosarcoma cell lines
The IDH1 gene was amplified by PCR with forward primer 5′-CGGGATCCGCCAC CATGTCCAAAAAAATCAGTGGC-3′ and the reverse primer 5′-CGGAATTCTTAAAGTTT GGCCTGAGCTAG-3′ from epitheliod carcinoma Hela cells. The PCR product was cloned into the lentivirus mediated pLL3.7 up-regulation vector (Genesil, Wuhan, China) named as OE-LV to up-regulate IDH1 expression, and it was also confirmed by sequence analysis (GeneBank sequence accession number BC012846.1). Small interfering RNA sequence inserted into pLL3.7 shRNA lentivector (Genesil, Wuhan, China) for IDH1 down-regulation to reduce IDH1 expression, named as KD-LV, was 5′-GAAAGGACATGTGAACTTATT-3′. The empty lentivector (Genesil, Wuhan, China), named as EV-LV, was used as a control. Nonlentivector infection, named as NT, was used as another control. The pLL3.7 lentivector contains a sequence to drive the expression of the green fluorescent protein (GFP). The lentivector stocks were added to osteosarcoma cell lines MG63 and 143B. Cells were infected with lentivector and were then directly counted GFP-positive cells before G418 selection, 800 μg/mL for MG63 and 500 μg/mL for 143B. The efficiency of the highest infection, as determined by directly counting GFP-positive cells and G418 selection, was obtained at a multiplicity of infection (MOI) of 50 for MG63 and 80 for 143B. The frequency of infection rose to 95% and 99% for MG63 and 143B, respectively. Cells infected with over-expression (OE) lentivector, knockdown lentivector (KD) or Empty lentivector (EV) were named as OE cells, KD cells or EV cells, respectively. Cells without lentivector infection were named as NT cells. After selection, the efficiency of infection was verified by Western blotting. Polyclonal populations and clones displaying high levels of IDH1 up-regulation or down-regulation were selected for further studies.
2.6. RNA extraction and Real-time PCR
Total RNA extraction and Real-time PCR were performed as previously described [8]. The relative expression of IDH1 was calculated in different cell lines by the comparative Ct method [12]. β-actin was used as a standard for normalization. All experiments were performed at least in triple.
2.7. Protein extraction and Western blotting
Western blotting was performed as previously described [8]. Briefly, IDH1, MMP9, ICAM-1, and VEGF proteins were detected by rabbit polyclonal primary antibody (Protein Technology Group, Chicago, IL, USA). β-actin protein was recognized by the β-actin-specific mouse IgG (Santa Cruz, CA, USA), and was used as the internal loading control.
2.8. MTT assay for cell growth
Cells were seeded in 96-well plates at the density of 3.5 × 10³ cells/well. After growing for 1 to 6 days, cells were washed with phosphate buffered saline (PBS, pH = 7.2, 10 mM). MTT (5 mg/mL) was then added to each well (including the control well) and the mixture was incubated at 37 °C for 2 h. Culture medium was then replaced with equal volume of dimethyl sulfoxide (DMSO). After shaking at room temperature for 10 min, absorbance of each well was determined at 570 nm using Versamax microplate reader (Molecular Devices, CA, USA).
2.9. Colony formation assay
Approximately 3 × 10² cells of respective MG63 KD, MG63 EV, MG63 OE, 143B KD, 143B EV and 143B OE were plated in 10 cm culture dishes. Cells were fixed with methanol and stained with 0.1% crystal violet after 14 days. Clones containing over 50 cells were counted manually. Colony formation rate was described as the percentages of the colony numbers to inoculated cells numbers. The experiments were repeated three times to obtain the average colony formation rate.
2.10. Cell cycle and apoptosis analysis with flow cytometry
Cells were harvested and treated with 0.1% Triton-X and DNase-free RNase (10 mg/mL) [13]. DNA of the cells was stained with propidium iodide (PI) (1 mg/mL) and analyzed using a flow cytomety (FACScan, Becton Dickinson, NY). The relative proportions of the cells in the G0-G1, S and G2-M phases of the cell cycle were determined. Apoptosis was analyzed by flow cytomety, using Annexin V – fluorescein isothiocyanate (FITC) apoptosis detection kit (Invitrogen, Carlsbad, CA, USA), according to the manufacturer’s protocol.
2.11. Caspase activity
Caspase activity assay was based on the ability of the active enzyme to cleave the chromophore from either caspase-9 substrate Ac-LEHD-pNA or caspase-3 substrate Ac-DEVD-pNA [14]. The cell lysates were incubated with anti-caspase-9 and anti-caspase-3 antibodies (Santa Cruze, CA, USA). The release of p-nitroaniline was measured at 405 nm. Results are represented as the relative change in activity compared to the untreated control.
2.12. Wounded healing assay
Cells were cultured and grown to 100% confluence. A clear area was then scraped in the monolayer with a 1 mL pipette tip. Cells migrated into wounded areas were evaluated at the 24 h with an inverted microscope (Olympas, Tokyo, Japan) and photographed. The healing rate was quantified by the degree of gap size lessen during the cell culture. Three different areas in each assay were measured.
2.13. Cell invasion assay
Invasion ability of the cells was measured using two-chamber-Transwell (Corning, NY, USA). The upper surface of a polycarbonate membrane with 8 μm pores was coated with 1 mg/mL Matrigel [15]. Untransfected or stably transfected osteosarcoma cells (1.0 × 10⁵) were suspended in upper chamber [RPMI 1640 medium with 0.05% fetal bovine serum (FBS)], whereas medium containing 10% FBS was placed in the lower chamber. After 24 h incubation at 37 °C with 5% CO2, the cells on the upper surface of the membrane were completely removed. Then, the membrane was fixed with methanol and stained with 0.1% crystal violet. Cells that invaded Matrigel and reached the lower surface of the membrane were counted (400×) and photographed (200×) under a microscope.
2.14. In vivo tumorigenesis
Male nu/nu nude mice (Charles River, MA), 6 week old on arrival, were housed in pathogen-free conditions. 143B cells with IDH1 KD, IDH1 EV and IDH1 OE were respectively grown to near confluence, resuspended in PBS (0.1 ml) and injected subcutaneously into the flank of nude mice at 1 × 10⁶ cells/0.1 ml. Tumor size was measured every 2 days using a caliper (Grainger, CA). The tumor volume was calculated by the formula 1/6 πab2 (π = 3.14, a: long axis and b: short axis of the tumor). Growth curves were plotted from the tumor volume (mean ± SE) in each group (5 animals per group). Twenty-one days after injection, the animals were sacrificed and tumors were harvested (measured and weighed then) and fixed in 4% paraformaldehyde. Wet tumor weight was calculated as mean weight ± SD in each group (n = 5).
2.15. Metastasis model
0.03 ml Of cell suspension (143B cells with IDH1 KD, IDH1 EV and IDH1 OE respectively, 1 × 10⁷ cells/ml PBS) was injected into the tibia percutaneously when nude mice were anesthetized. Each group contains 5 mice. Four weeks later, the animals were sacrificed. Lungs were harvested and fixed. The number of surface lung metastatic nodules was then counted. Mean number of lung nodules was compared among groups. Microscopic lung metastases were visualized on H & E stained sections (5 μm).
2.16. Statistic analysis
All statistical analysis was performed using the SPSS 17.0 software package for Windows (SPSS Inc., Chicago, IL). For tumor growth and metastasis experiments, ANOVA (Waller-Duncan K-ratio t-test) was used to examine the multiple group comparisons. All statistical tests were two sided. Statistical significance was calculated by Student’s t-tests. P < 0.05 was considered as statistically significant. ±: Standard deviation.
3. Results
3.1. IDH1 expressed lower in osteosarcoma patient tissues than in normal bone tissues
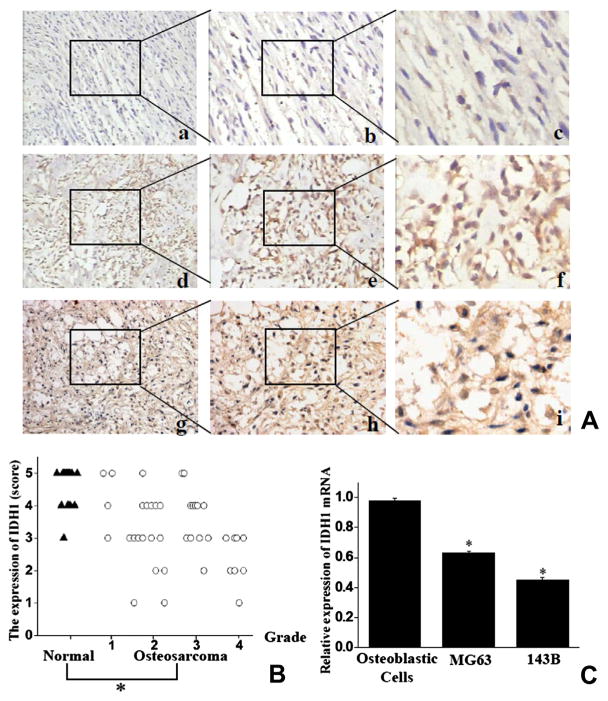
Expression of IDH1 was detected in the cytoplasm. In most high grade osteosarcoma patient tissues (65%, 13/20), only a low level of IDH1 or vacant labeling was present (Fig. 1A(a–c)). Less frequency (45.9%, 11/24) of low expressed IDH1 was present in low grade osteosarcoma tissues, and remains showed high expressed IDH1 (54.1%, 13/24; Fig. 1A(d–f)). In contrast, a strong staining for IDH1 was observed in most of adjacent normal bone tissue biopsies (93.75, 15/16; Fig. 1A(g–i)). IDH1 expression was significantly lower in osteosarcoma than in normal bone (2.93 ± 1.40 vs. 4.75 ± 0.46; P < 0.05, Fig. 1B). Consistent with observations form samples, osteosarcoma cells 143B and MG63 were found to express less relative IDH1 mRNA (56.8 ± 2.6% and 37.2 ± 2.3% less) than normal human osteoblastic cells did, as measured by Real-time PCR (Fig. 1C).
Fig. 1.
IDH1 expressed lower in human osteosarcoma tissues than in normal bone tissues (A) IDH1 staining in slides from osteosarcoma (a–f) and adjacent normal bone tissues (g–i). (a–c) Low positive staining in high grade osteosarcoma; (d–f) high positive staining in low grade osteosarcoma. (g–i) High positive staining in normal bone tissues. Magnifications: 100× (a, d, g), 200× (b, e, h), 400× (c, f, i). Representative results were shown. The areas that were magnified as panels b, c, e, f, h and i were marked in panels a, b, d, e, g and h. (B) Higher scores were showed on IDH1 expression in normal bone tissues (tagged as “▲”) than in osteosarcoma tissues (tagged as “○”). (C) IDH1 mRNA expression was determined to be higher in non-transformed human osteoblastic cells than human osteosarcoma cell lines. Columns: means; bars: SE (Std. Deviation) *P < 0.05.
3.2. Lentivector mediated IDH1 up-regulation suppressed cell proliferation
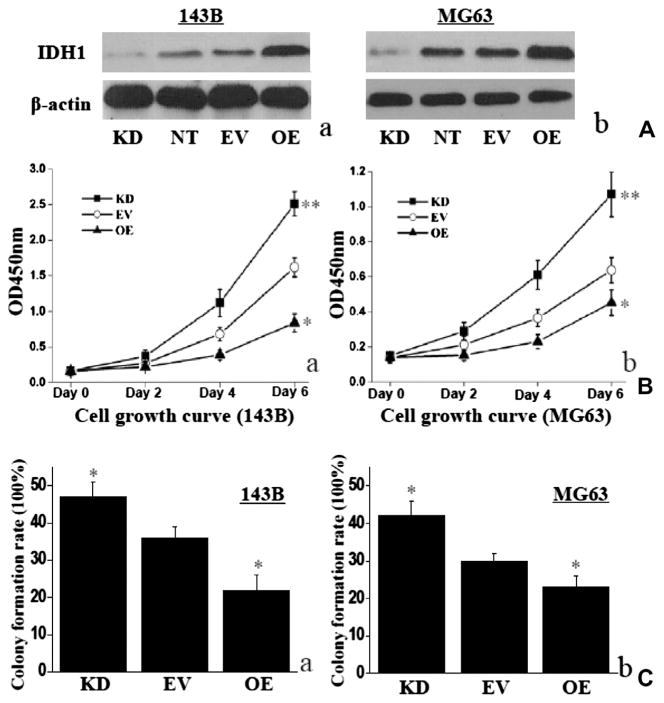
Lentivirus mediated vectors were used to up-regulate and down-regulate IDH1. Infection efficiency was confirmed by Western blotting, and it was found to be specific and effective (Fig. 2A). IDH1 increased significantly in 143B OE cells and decreased significantly in 143B KD cells, compared with EV cells (P < 0.01; Fig. 2A(a)). Similar results were found for MG63 (Fig. 2A(b)). There was no significant difference in IDH1 protein expression between NT cells and EV cells, in respective 143B and MG63 cell line (P > 0.05; Fig. 2A).
Fig. 2.
IDH1 up-regulation suppressed cell proliferation. (A) IDH1 protein increased significantly in 143B OE cells and decreased significantly in 143B KD cells, compared with EV cells. Same results were found in MG63 cells. No significant difference was found on IDH1 protein expression between NT cells and EV cells in 143B or MG63. β-actin was monitored as the control. Representative western blotting result was shown (a and b). OE: up-regulation of IDH1; KD: down-regulation of IDH1; EV: empty lentivector treated; NT: nonlentivector treated. (B) Up-regulated IDH1 inhibited cell proliferation in 143B OE cells or MG63 OE cells, compared with in control EV cells (a and b). Whereas down-regulated IDH1 showed opposite result in either 143B or MG63 (a and b). (C) IDH1 showed the same tendency in cell colony formation as in cell growth curve *P < 0.05; **P < 0.01.
IDH1 up-regulation suppressed the cell growth rate in 143B OE cells by 33.5 ± 2.5% and MG63 OE cells by 22.7 ± 1.8% on day 6, compared with those in 143B EV cells or MG63 EV cells (P < 0.01; Fig. 2B). In contrast, the cell growth rate was significantly promoted in 143B KD cells by 25.0 ± 2.9% and MG63 KD cells by 29.3 ± 2.4%, compared with those in EV cells on day 6 (P < 0.05; Fig. 2B). For the impact of IDH1 on colony formation, 143B OE cells showed significantly lower colony numbers than that of the control EV cells (P < 0.05), whereas 143B KD cells showed the reverse result (P < 0.05; Fig. 2C). The impact of IDH1 on MG63 cell colony formation has the same tendency as 143B (P < 0.05; Fig. 2C).
3.3. IDH1 up-regulation induced G2/M phase arrest and final apoptosis
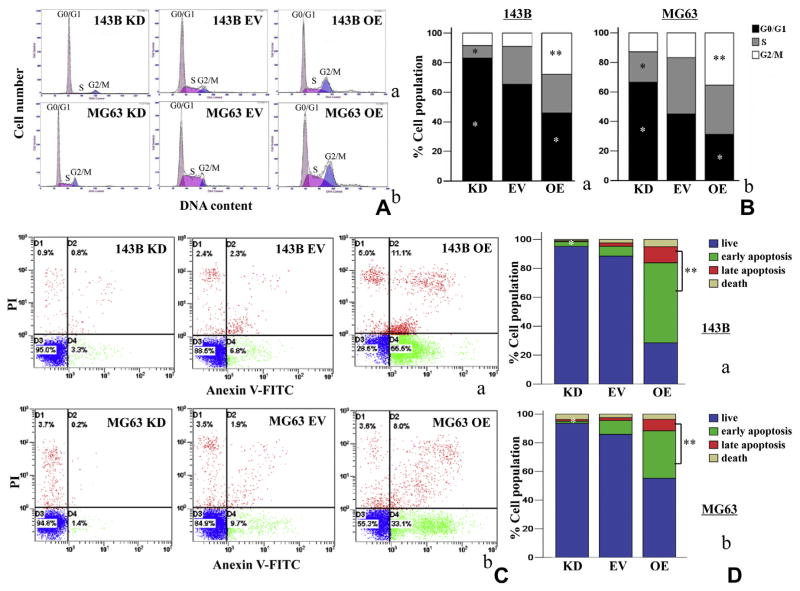
To reveal the mechanism underling IDH1 up-regulation induced anti-proliferation, flow cytometry was used to detect the changes of cell cycle and apoptotic rates in osteosarcoma cells. IDH1 up-regulation enhanced G2/M population in 143B and MG63 cell lines by 211.6 ± 7.2% and 110.4 ± 5.5% (P < 0.01), accompanied G0/G1 phase reduction by 29.7 ± 2.2% and 31.2 ± 1.8% after stable transfection (P < 0.05), compared to the empty vector control (Fig. 3A and B). In contrast, down-regulated IDH1 in 143B and MG63 reduced S phase population by 67.7 ± 2.5% and 48.3 ± 2.7% (P < 0.05), accompanied by G0/G1 phase increase by 27.5 ± 3.8% and 47.6 ± 3.5% (P < 0.05) (Fig. 3A and B). Apoptosis rate in 143B OE cells and MG63 OE cells increased by 55.0 ± 6.3% and 29.6 ± 2.1%, respectively, compared with EV cells (P < 0.01, Fig. 3C and D). In contrast, the apoptosis rate of 143B KD cells and MG63 KD cells decreased by 55.3 ± 6.5% and 9.9 ± 1.8%, respectively (P < 0.05, Fig. 3C and D).
Fig. 3.
IDH1 up-regulation increased G2/M population and induced pro-apoptosis in stable transfectants. (A and B) Up-regulated IDH1 (OE) induced an increase of G2/M population in 143B and MG63 cell lines. Representative results were shown. These experiments were performed in triplicate. (C and D) The apoptosis rate of 143B OE cells and MG63 OE cells increased significantly, compared with EV cells. In contrast, the apoptosis rate of 143B KD cells and MG63 KD cells decreased significantly *P < 0.05; **P < 0.01.
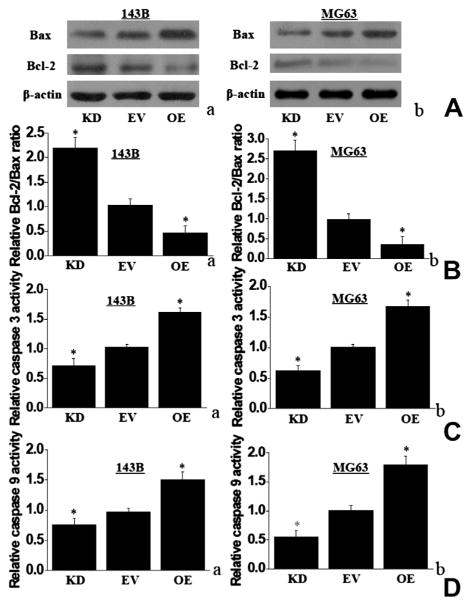
IDH1 up-regulation in 143B and MG63 cells also enhanced proapoptotic Bax protein level (Fig. 4A). In addition, IDH1 up-regulation decreased the expression of anti-apoptotic Bcl-2 protein level, which led to a decrease in the Bcl-2 to Bax protein ratio (Fig. 4A and B). Moreover, up-regulated IDH1 in 143B and MG63 OE cells increased caspase-3 activity by 1.55 and 1.72-fold when compared to EV cells, whereas down-regulated IDH1 in 143B and MG63 KD cells decreased caspase-3 activity by 0.75 and 0.61-fold (Fig. 4C). Caspase-9 activity demonstrated the same tendency as caspase-3 activity in either OE cells or KD cells, when compared with EV cells (Fig. 4D).
Fig. 4.
IDH1 up-regulation increased Bax protein expression and enhanced the activity of caspase 3 and caspase 9. (A) IDH1 up-regulation increased the Bax protein and decreased the Bcl-2 protein in 143B and MG63. IDH1 down-regulation showed the reverse tendency. Representative western blotting results were shown. (B) IDH1 up-regulation decreased the ratio of Bcl-2/Bax protein in 143B cells (a) and MG63 (b), compared with EV cells. (C) IDH1 up-regulation increased the activity of caspase-9. (D) IDH1 up-regulation increased the activity of caspase-3 (*P < 0.05).
3.4. IDH1 up-regulation decreased cell migration and invasion
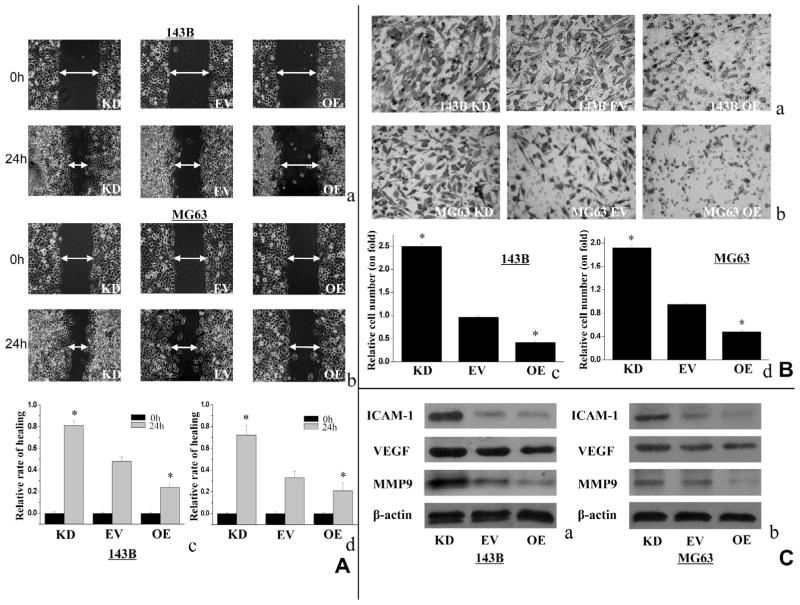
The effect of IDH1 on cell migration and invasion was further investigated. As shown in Fig. 5A, 143B OE cells and MG63 OE cells had a slower wound-healing rate compared with respective EV cells (0.48 ± 0.043 vs. 0.77 ± 0.052, and 0.46 ± 0.039 vs. 0.83 ± 0.047), while 143B KD cells and MG63 KD cells had a reverse tendency (0.24 ± 0.033 and 0.27 ± 0.062). In Fig. 5B, the invasive activity of 143B OE cells and MG63 OE cells was decreased by 48.3 ± 7.3% and 56.2 ± 5.5%, respectively, compared with EV cells. In contrast, 143B KD cells and MG63 KD cells showed increased invasion activities by 62.5 ± 4.7% and 50.4 ± 6.1% (P < 0.01) (Fig. 5B). In addition, the expression of some cell migration and invasion related proteins were examined. In both 143B and MG63 cells, IDH1 up-regulation inhibited the expression of MMP-9, ICAM-1 and VEGF to some extents, whereas the IDH1 down-regulation showed the opposite results (Fig. 5C).
Fig. 5.
Up-regulated IDH1 suppressed cell migration and invasion. (A) The cell migration activity showed in wound healing assay was decreased in 143B OE cells and MG63 OE cells, compared with EV cells. KD cells showed significantly higher migration activities. Double headed arrows indicate wound edges. Representative results were shown ((a and b) magnification, ×100). The scale bar represents relative healing rate at 24 h vs. 0 h (c and d). (B) The effect of IDH1 on cell invasion in 143B and MG63 has the same tendency as cell migration. (Magnification, ×200). (C) Up-regulated IDH1 reduced expression of MMP-9, ICAM-1 and VEGF expression in both 143B and MG63 cells, whereas down-regulated IDH1 showed reverse result. Representative western blotting result was shown (**P < 0.01, *P < 0.05).
3.5. IDH1 up-regulation inhibited in vivo tumor growth and the formation of lung metastasis
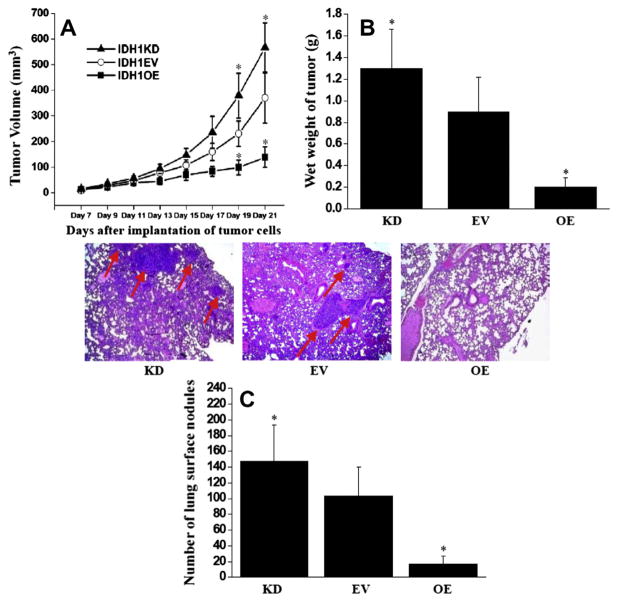
To examine the in vivo anti-tumor growth effects of IDH1 in osteosarcoma, 143B cell lines with IDH1 KD, IDH1 EV, and IDH1 OE were subcutaneously injected into nude mice and tumor growth was evaluated. Fig. 6A showed that 143B cells with IDH1 up-regulation (IDH1 OE) exhibited a significantly slower growth rate than that of empty vector control (IDH1 EV) cells (P < 0.05), whereas faster growth rate in IDH1 down-regulated (IDH1 KD) 143B cells. In addition, Fig. 6B showed that the average wet weight of IDH1 OE tumors was about 77.3% less than that of EV tumors (P < 0.05), whereas 44.4% increase in IDH1 KD cells (P < 0.05).
Fig. 6.
IDH1 up-regulation inhibited tumor growth and metastasis in nude mice. (A) Tumor growth curve. IDH1 up-regulation suppressed tumor growth on day 19 and day 21. Points, mean tumor volume (each group contains 5 mice); Bars, standard error (SE). (B) Tumor wet weight. Tumors were harvested at 21 days after implantation. Columns, mean wet tumor weight from 5 mice in each group; Bars, SE. (C) Surface lung nodules were counted under a dissecting microscope. Columns, mean number of lung surface nodules from 5 mice in each group; Bars, SE. representative photographs of lung sections from IDH1 OE, IDH1 EV and IDH1 KD by H&E staining (magnification, ×50). Lung metastatic nodules were pointed out by arrows (*P < 0.05).
To evaluate the in vivo anti-metastasis effect of IDH1, a clinically relevant intra-tibial injection model of osteosarcoma was established that can lead to lung metastasis formation in nude mice. Fig. 6C showed that the IDH1 OE cells formed 88.5% fewer lung nodules than IDH1 EV ones, whereas IDH1 KD cells grew 48.5% more (P < 0.05). In addition, the size of nodules formed from IDH1 OE cells was smaller than those from IDH1 EV cells, verified by histological examination (Fig. 6C). This result demonstrated the marked anti-metastasis effects of IDH1 up-regulation in a clinically relevant mouse model.
4. Discussion
In this study, higher expression of IDH1 was found in human normal bone tissues than that of the osteosarcoma biopsied samples. Anti-proliferation effect was determined by IDH1 up-regulation through pro-apoptosis in osteosarcoma cell lines 143B and MG63. We also observed anti-invasion and anti-migration effects of up-regulated IDH1 in these cells. Moreover, the suppressed role of IDH1 up-regulation on tumor growth and metastasis was validated in osteosarcoma cell line 143B bearing nude mice. Our results suggest that IDH1 up-regulation inhibits the tumor cell progress in osteosarcoma in vitro and in vivo.
Alteration of IDH1 expression was described in several tumor tissues and reported to be associated with tumor progression. For example, IDH1 was found to be down-regulated in tissue biopsies of late-stage bladder cancers vs. early-stage bladder cancers [7]. In our previous study, findings indicated that patients with less IDH1-expression tend to be high pathological grade and have high metastatic potential. A higher 5 year survival rate was also found in IDH1- high expression group vs. IDH1- low expression group, though there was no significant correlation between IDH1- expression and overall survival. Here, we further demonstrated that IDH1 was down-regulated in osteosarcoma tissues than adjacent normal bone tissues. Our data revealed that IDH1 might be involved in tumor progression in osteosarcoma.
IDH1 mutation has been reported as a reason for the alter IDH1 expression, and contributes to malignant progression in some kinds of gliomas and leukemias [16]. However, no any IDH1 mutations have been currently found in human osteosarcoma tissues [9]. Based on the context, we are curious about the role of wild type IDH1 in osteosarcoma development. Recently, Memon MBBS showed that protein expression of IDH1 was significantly decreased in high grade T24 cell line as compared to low grade RT4 in bladder cancer [7]. We previously found that IDH1 expressed higher in low grade osteosarcoma cell line U2OS than in high grade osteosarcoma cell line MG63 [8]. Interestingly, in present study, it was revealed that IDH1 up-regulation inhibited cell proliferation in osteosarcoma cell lines 143B and MG63, whereas IDH1 down-regulation exacerbated cell proliferation. The suppression of IDH1 up-regulation on tumor cell growth was further validated in high malignant 143B cell line bearing nude mice. All these results were in consisted with the demonstration from bladder cancer [7]. Besides, our work is the first, demonstrates that IDH1 up-regulation led to G2/M phase accumulation of osteosarcoma cells. Findings here also indicated that IDH1 up-regulation resulted in a markedly increase of Bax, and decrease of Bcl-2, suggesting that changes in the ratio of pro-apoptotic and anti-apoptotic Bcl-2 family proteins might contribute to the pro-apoptotic effect of IDH1. Advanced evidences were presented in this study on that IDH1 up-regulation markedly increased caspase 3 and caspase 9 activities, which were strongly correlated with cell apoptosis in osteosarcoma [14,17,18]. These findings highlight that IDH1 up-regulation triggered apoptosis, thereby contributing to the suppression of cell proliferation in osteosarocma.
Metastasis is a major problem in osteosarcoma treatment. Currently, there is no successful targeted therapy directing at the invasive nature of osteosarcoma [19,20]. In our previous study, IDH1 correlated with metastasis negatively in human osteosarcoma samples [8]. Here, the effects of IDH1 up-regulation on migration and invasion in osteosarcoma cells were further investigated. Findings showed that IDH1 up-regulation reduced cell migration of 143B and MG63 in would healing assay, and suppressed their invasion. These data strongly supported our previous observation from osteosarcoma patients. The suppression of IDH1 up-regulation on metastasis was further validated in 143B bearing nude mice in vivo. To our best knowledge, we are first to report that IDH1 up-regulation markedly inhibits tumor metastasis in an orthotopic animal model of osteosarcoma. This intra-tibial injected model leads to 100% lung metastasis and closely recapitulates the process of osteosarcoma metastasis in human [21,22]. Therefore, our results suggest the potential for developing IDH1 as a targeted anti-metastatic agent for clinical use in osteosarcoma cases.
MMP-9 is directly associated with metastatic processes in osteosarcoma [23–25]. Our study showed that IDH1 up-regulation reduced MMP-9 protein expression. The expression of ICAM-1 and VEGF were also decreased by IDH1 up-regulation. These results suggest that IDH1 might exhibit its markedly anti-proliferation and anti-metastasis effect in osteosarcoma through multiple mechanisms. Further studies are in progress to dissect how IDH1 regulates the expression of genes important for apoptosis and metastasis, such as Bax, Bcl-2, and MMP9. In cellular metabolism, IDH1 also plays an important role for α-KG production and the redox balance through NADP/NADPH [5]. Whether IDH1-catalyzed metabolism, including its important products α-KG and NADPH, is involved in the observed changes in cellular behaviors needs to be addressed in our future work.
In summary, our study highlights that up-regulated IDH1 suppresses cell proliferation, migration and invasion in osteosarcoma in vitro and in vivo. IDH1 represents a promising target for developing therapeutic and preventive strategies against malignant progress of osteosarcoma.
Supplementary Material
Acknowledgments
We thank G.R. Yu, K. Deng, S.X. Tao, H.G. Liu, B.W. Qi for their technical assistance.
Abbreviations
- IDH1
isocitrate dehydrogenase 1
- MOI
multiplicity of infection
- OE
over-expression
- KD
knockdown
- EV
empty lentivector
- PI
propidium iodide
- FITC
fluorescein isothiocyanate
- MMPs
matrix metalloproteinases
- ICAM-1
intercellular adhesion molecule 1
- VEGF
vascular endothelial growth factor
Appendix A. Supplementary material
Supplementary data associated with this article can be found, in the online version, at http://dx.doi.org/10.1016/j.canlet.2013.12.020.
Footnotes
Conflict of Interest
The authors have declared no conflicts of interest exist.
References
- 1.Ek ET, Choong PF. The role of high-dose therapy and autologous stem cell transplantation for pediatric bone and soft tissue sarcomas. Expert Rev Anticancer Ther. 2006;6:225–237. doi: 10.1586/14737140.6.2.225. [DOI] [PubMed] [Google Scholar]
- 2.Gorlick R, Anderson P, Andrulis I, Arndt C, Beardsley GP, Bernstein M, Bridge J, Cheung NK, Dome JS, Ebb D, Gardner T, Gebhardt M, Grier H, Hansen M, Healey J, Helman L, Hock J, Houghton J, Houghton P, Huvos A, Khanna C, Kieran M, Kleinerman E, Ladanyi M, Lau C, Malkin D, Marina N, Meltzer P, Meyers P, Schofield D, Schwartz C, Smith MA, Toretsky J, Tsokos M, Wexler L, Wigginton J, Withrow S, Schoenfeldt M, Anderson B. Biology of childhood osteogenic sarcoma and potential targets for therapeutic development: meeting summary. Clin Cancer Res. 2003;9:5442–5453. [PubMed] [Google Scholar]
- 3.Kager L, Zoubek A, Potschger U, Kastner U, Flege S, Kempf-Bielack B, Branscheid D, Kotz R, Salzer-Kuntschik M, Winkelmann W, Jundt G, Kabisch H, Reichardt P, Jurgens H, Gadner H, Bielack SS. Primary metastatic osteosarcoma: presentation and outcome of patients treated on neoadjuvant Cooperative Osteosarcoma Study Group protocols. J Clin Oncol. 2003;21:2011–2018. doi: 10.1200/JCO.2003.08.132. [DOI] [PubMed] [Google Scholar]
- 4.Lubin M, Lubin A. Selective killing of tumors deficient in methylthioadenosine phosphorylase: a novel strategy. PLoS ONE. 2009;4:e5735. doi: 10.1371/journal.pone.0005735. [DOI] [PMC free article] [PubMed] [Google Scholar]
- 5.Nekrutenko A, Hillis DM, Patton JC, Bradley RD, Baker RJ. Cytosolic isocitrate dehydrogenase in humans, mice, and voles and phylogenetic analysis of the enzyme family. Mol Biol Evol. 1998;15:1674–1684. doi: 10.1093/oxfordjournals.molbev.a025894. [DOI] [PubMed] [Google Scholar]
- 6.Shechter I, Dai P, Huo L, Guan G. IDH1 gene transcription is sterol regulated and activated by SREBP-1a and SREBP-2 in human hepatoma HepG2 cells: evidence that IDH1 may regulate lipogenesis in hepatic cells. J Lipid Res. 2003;44:2169–2180. doi: 10.1194/jlr.M300285-JLR200. [DOI] [PubMed] [Google Scholar]
- 7.Memon AA, Chang JW, Oh BR, Yoo YJ. Identification of differentially expressed proteins during human urinary bladder cancer progression. Cancer Detect Prev. 2005;29:249–255. doi: 10.1016/j.cdp.2005.01.002. [DOI] [PubMed] [Google Scholar]
- 8.Hu X, Yu AX, Qi BW, Fu T, Wu G, Zhou M, Luo J, Xu JH. The expression and significance of IDH1 and p53 in osteosarcoma. J Exp Clin Cancer Res. 2010;29:43. doi: 10.1186/1756-9966-29-43. [DOI] [PMC free article] [PubMed] [Google Scholar]
- 9.Amary MF, Bacsi K, Maggiani F, Damato S, Halai D, Berisha F, Pollock R, O’Donnell P, Grigoriadis A, Diss T, Eskandarpour M, Presneau N, Hogendoorn PC, Futreal A, Tirabosco R, Flanagan AM. IDH1 and IDH2 mutations are frequent events in central chondrosarcoma and central and periosteal chondromas but not in other mesenchymal tumours. J Pathol. 2011;224:334–343. doi: 10.1002/path.2913. [DOI] [PubMed] [Google Scholar]
- 10.Kurokouchi K, Kambe F, Yasukawa K, Izumi R, Ishiguro N, Iwata H, Seo H. TNF-alpha increases expression of IL-6 and ICAM-1 genes through activation of NF-kappaB in osteoblast-like ROS17/2.8 cells. J Bone Miner Res. 1998;13:1290–1299. doi: 10.1359/jbmr.1998.13.8.1290. [DOI] [PubMed] [Google Scholar]
- 11.Charity RM, Foukas AF, Deshmukh NS, Grimer RJ. Vascular endothelial growth factor expression in osteosarcoma. Clin Orthop Relat Res. 2006;448:193–198. doi: 10.1097/01.blo.0000205877.05093.c9. [DOI] [PubMed] [Google Scholar]
- 12.Kimura M. A simple method for estimating evolutionary rates of base substitutions through comparative studies of nucleotide sequences. J Mol Evol. 1980;16:111–120. doi: 10.1007/BF01731581. [DOI] [PubMed] [Google Scholar]
- 13.Boye K, Grotterod I, Aasheim HC, Hovig E, Maelandsmo GM. Activation of NF-kappaB by extracellular S100A4: analysis of signal transduction mechanisms and identification of target genes. Int J Cancer. 2008;123:1301–1310. doi: 10.1002/ijc.23617. [DOI] [PubMed] [Google Scholar]
- 14.Eliseev RA, Zuscik MJ, Schwarz EM, O’Keefe RJ, Drissi H, Rosier RN. Increased radiation-induced apoptosis of Saos2 cells via inhibition of NFkappaB: a role for c-Jun N-terminal kinase. J Cell Biochem. 2005;96:1262–1273. doi: 10.1002/jcb.20607. [DOI] [PubMed] [Google Scholar]
- 15.Wang R, Dong K, Lin F, Wang X, Gao P, Wei SH, Cheng SY, Zhang HZ. Inhibiting proliferation and enhancing chemosensitivity to taxanes in osteosarcoma cells by RNA interference-mediated downregulation of stathmin expression. Mol Med. 2007;13:567–575. doi: 10.2119/2007-00046.Wang. [DOI] [PMC free article] [PubMed] [Google Scholar]
- 16.Reitman ZJ, Parsons DW, Yan H. IDH1 and IDH2: not your typical oncogenes. Cancer Cell. 2010;17:215–216. doi: 10.1016/j.ccr.2010.02.024. [DOI] [PMC free article] [PubMed] [Google Scholar]
- 17.Wang ZX, Yang JS, Pan X, Wang JR, Li J, Yin YM, De W. Functional and biological analysis of Bcl-xL expression in human osteosarcoma. Bone. 2010;47:445–454. doi: 10.1016/j.bone.2010.05.027. [DOI] [PubMed] [Google Scholar]
- 18.Banerjee S, Thayanithy V, Sangwan V, Mackenzie TN, Saluja AK, Subramanian S. Minnelide reduces tumor burden in preclinical models of osteosarcoma. Cancer Lett. 2013;335:412–420. doi: 10.1016/j.canlet.2013.02.050. [DOI] [PMC free article] [PubMed] [Google Scholar]
- 19.Ma X, Yang Y, Wang Y, An G, Lv G. Small interfering RNA-directed knockdown of S100A4 decreases proliferation and invasiveness of osteosarcoma cells. Cancer Lett. 2010;299:171–181. doi: 10.1016/j.canlet.2010.08.016. [DOI] [PubMed] [Google Scholar]
- 20.Ishii A, Suzuki M, Satomi K, Kobayashi H, Sakashita S, Kano J, Pei Y, Minami Y, Ishikawa S, Noguchi M. Increased cytoplasmic S100A6 expression is associated with pulmonary adenocarcinoma progression. Pathol Int. 2009;59:623–630. doi: 10.1111/j.1440-1827.2009.02417.x. [DOI] [PubMed] [Google Scholar]
- 21.Luu HH, Kang Q, Park JK, Si W, Luo Q, Jiang W, Yin H, Montag AG, Simon MA, Peabody TD, Haydon RC, Rinker-Schaeffer CW, He TC. An orthotopic model of human osteosarcoma growth and spontaneous pulmonary metastasis. Clin Exp Metastasis. 2005;22:319–329. doi: 10.1007/s10585-005-0365-9. [DOI] [PubMed] [Google Scholar]
- 22.Su Y, Wagner ER, Luo Q, Huang J, Chen L, He BC, Zuo GW, Shi Q, Zhang BQ, Zhu G, Bi Y, Luo J, Luo X, Kim SH, Shen J, Rastegar F, Huang E, Gao Y, Gao JL, Yang K, Wietholt C, Li M, Qin J, Haydon RC, He TC, Luu HH. Insulin-like growth factor binding protein 5 suppresses tumor growth and metastasis of human osteosarcoma. Oncogene. 2011;30:3907–3917. doi: 10.1038/onc.2011.97. [DOI] [PubMed] [Google Scholar]
- 23.Han YP, Tuan TL, Wu H, Hughes M, Garner WL. TNF-alpha stimulates activation of pro-MMP2 in human skin through NF-(kappa)B mediated induction of MT1-MMP. J Cell Sci. 2001;114:131–139. doi: 10.1242/jcs.114.1.131. [DOI] [PMC free article] [PubMed] [Google Scholar]
- 24.Reuben PM, Cheung HS. Regulation of matrix metalloproteinase (MMP) gene expression by protein kinases. Front Biosci. 2006;11:1199–1215. doi: 10.2741/1873. [DOI] [PubMed] [Google Scholar]
- 25.Kido A, Tsutsumi M, Iki K, Takahama M, Tsujiuchi T, Morishita T, Tamai S, Konishi Y. Overexpression of matrix metalloproteinase (MMP)-9 correlates with metastatic potency of spontaneous and 4-hydroxyaminoquinoline 1-oxide (4-HAQO)-induced transplantable osteosarcomas in rats. Cancer Lett. 1999;137:209–216. doi: 10.1016/s0304-3835(98)00368-1. [DOI] [PubMed] [Google Scholar]
Associated Data
This section collects any data citations, data availability statements, or supplementary materials included in this article.


