

Abstract
Background
Most Americans consume more sodium than is recommended, the vast majority of which comes from commercially packaged and restaurant foods. In 2010 the Institute of Medicine recommended that manufacturers reduce the amount of sodium in their products.
Objective
The aim was to assess the sodium content in commercially packaged food products sold in U.S. grocery stores in 2009.
Design
With the use of sales and nutrition data from commercial sources, we created a database with nearly 8000 packaged food products sold in major U.S. grocery stores in 2009. We estimated the sales-weighted mean and distribution of sodium content (mg/serving, mg/100 g, and mg/kcal) of foods within food groups that contribute the most dietary sodium to the U.S. diet. We estimated the proportion of products within each category that exceed 1) the Food and Drug Administration’s (FDA’s) limits for sodium in foods that use a “healthy” label claim and 2) 1150 mg/serving or 50% of the maximum daily intake recommended in the 2010 Dietary Guidelines for Americans.
Results
Products in the meat mixed dishes category had the highest mean and median sodium contents per serving (966 and 970 mg, respectively). Products in the salad dressing and vegetable oils category had the highest mean and median concentrations per 100 g (1072 and 1067 mg, respectively). Sodium density was highest in the soup category (18.4 mg/kcal). More than half of the products sold in 11 of the 20 food categories analyzed exceeded the FDA limits for products with a “healthy” label claim. In 4 categories, >10% of the products sold exceeded 1150 mg/serving.
Conclusions
The sodium content in packaged foods sold in major U.S. grocery stores varied widely and a large proportion of top-selling products exceeded limits, indicating the potential for reduction. Ongoing monitoring is necessary to evaluate the progress in sodium reduction.
Keywords: nutrition, packaged foods, sodium, diet, food
INTRODUCTION
High sodium intake is directly related to hypertension, one of the leading causes of cardiovascular disease, which accounted for nearly 800,000 deaths in the United States in 2010 (1–3). Most Americans consume more sodium than is recommended, on average, ~3300 mg/d, the vast majority of which is estimated to come from packaged and restaurant foods (>75%) (4, 5). The 2010 Dietary Guidelines for Americans (DGA)5 recommends that all Americans should limit their sodium intake to <2300 mg/d, but those aged ≥51 y, African Americans, and those with hypertension, diabetes, or chronic kidney disease should further reduce their intake to 1500 mg/d (6). A recent report suggested that sodium density, expressed in milligrams per kilocalorie, is a practical approach for expressing and monitoring adherence to these recommendations (7). The DASH (Dietary Approaches to Stop Hypertension) study diets consisted of incremental amounts of sodium based on caloric requirements; the sodium targets for the “intermediate” sodium level DASH diet range from 1.02 mg sodium/kcal to 1.15 mg/kcal (8). The U.S. Food and Drug Administration (FDA) specifies general requirements for foods making health label claims, which restricts the amount of sodium in any foods that use a “healthy” label claim (9, 10). In 2010 the Institute of Medicine recommended that food manufacturers gradually reduce the amount of sodium in their products (2). Recent efforts by the New York City Department of Health and Mental Hygiene’s National Salt Reduction Initiative (NSRI) encourage food manufacturers to meet specific targets for sodium across different food categories (11). In addition, many food manufacturers in the United States have voluntarily pledged to lower sodium in their products, including those who have partnered with the NSRI, Walmart, Kraft, and General Mills (12–14). Monitoring sodium in packaged foods is necessary to evaluate the impact of these efforts.
The USDA’s National Nutrient Database for Standard Reference contains the nutritional composition of ~8000 foods and is the basis for the Food and Nutrient Database for Dietary Studies (FNDDS), which is used to assess dietary intakes of foods and nutrients for What We Eat in America, part of the NHANES (15–17). The USDA databases contain brand-level information for certain food categories, such as infant formula and ready-to-eat cereals. However, currently, no comprehensive databases that combine nutrition and sales or consumption information are publicly or commercially available in the United States to monitor the sodium content in packaged or restaurant foods at the brand or product level (18). Although one such database was developed for New York’s NSRI and others have been developed by independent researchers, understanding of the sodium content of packaged foods is limited. To address this gap, our objectives were as follows: to describe the baseline sodium content of top-selling branded packaged foods within food categories contributing the most to U.S. sodium intake, to compare the sodium content to the FDA criteria for healthy foods in milligrams per serving, and to evaluate sodium content in relation to current recommendations for sodium intake (19).
METHODS
We combined product-level, point-of-sales calendar-year 2009 data from Nielsen ScanTrack (20) with Nutrition Facts Panel (NFP) data from Gladson LLC (21) by Universal Product Code (UPC). The Nielsen ScanTrack database captures all products sold in the vast majority of U.S. grocery stores with annual sales ≥$2 million. On the basis of consultation between nutrition experts at the CDC and the USDA, we selected and purchased ~250 grocery modules that included packaged food products that 1) contained sodium added during processing and 2) were known to be commonly consumed in the U.S. population. UPC-level data were obtained from Gladson’s 2009 database, which includes all nutrition information as it appears on the NFP, as well as information such as package size, product description, brand, and parent company. Although both the Nielsen and Gladson databases contained information on private-label (generic) products, UPCs for these foods are unique to specific retailers. Because of the poor matching of UPCs for these private-label products between the 2 databases, they were deleted before merging. Once merged, the products were mapped to 63 of the 104 USDA’s 2007–2008 FNDDS food categories, and an additional category of “salt and other seasonings” was created for a total of 64 categories with 142,629 products (Figure 1). Mapping of products in the database to USDA food categories was conducted by 2 independent researchers, and a third researcher resolved any differences. All product descriptions within all Nielsen modules were reviewed; and in some cases, an entire Nielsen module was directly mapped to a USDA food category, although for other modules the products had to be mapped individually. The remaining 41 USDA food categories that did not match to the database consisted of mainly fresh or frozen fruit and vegetables, dairy products, and beverages that contain minimal amounts of added sodium. Products in these 41 categories are not included in the database or in this analysis. Because the USDA food categories were developed for assessing dietary intakes and are broad in nature when compared with the variety of packaged food products available, we retained the Nielsen grocery module information. For USDA categories that contained an adequate number of products (UPCs) in different grocery modules (>10), we created subcategories in an effort to better group more similar products together.
FIGURE 1.
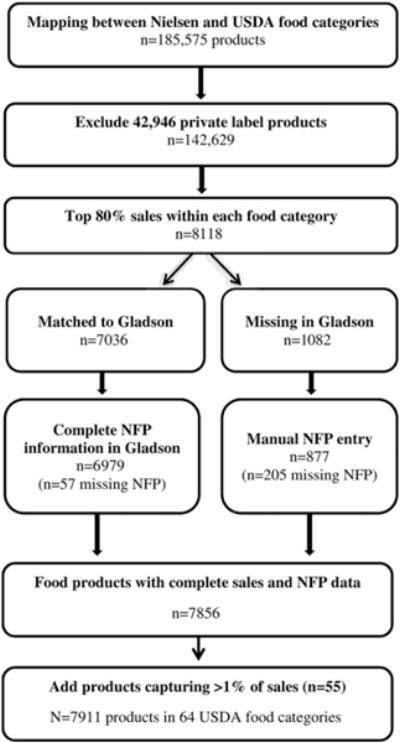
2009 Packaged foods database mapping flowchart. NFP, Nutrient Facts Panel.
In an initial merge of the 142,629 products in Nielsen, >135,000 products did not match or were missing nutrition information in the Gladson database. We limited our manual search for NFP data to those food products that comprised the top 80% of equivalized unit sales (in ounces or pieces sold) within each USDA food category (Figure 1). Because the top 80% of sales within each food category comprised a relatively small number of products, this limited the database to a total of 8118 food products (e.g., a food category may have a total of 300 products but only 60 of those products comprise 80% of total unit sales within that category). Of these 8118 products, 7036 matched with the Gladson database. The NFP information for 877 of the remaining 1082 products was identified on the basis of a standardized Internet search protocol using, in order, the following: 1) manufacturers’ websites, 2) retail websites (walmart.com, shopwell.com, shoprite.com, peapod.com, etc.), and 3) calorie/nutrition websites (livestrong.com, myfitnesspal.com, caloriecount.com, calorieking.com, foodfacts.com, fatsecret.com, coheso.com). For 205 products, NFP information was not found through the standardized Internet search, mainly because of product discontinuation or change. Fifty-seven of the products that matched with the Gladson database were missing serving size information or had serving sizes that were not conducive to analysis (e.g., 1 tablespoon) and were excluded, which left a total of 7856 products with complete sales and nutrient information. We further included any products from the Nielsen database that comprised >1% of equivalized unit sales within any category (n = 48). Finally, we excluded 5 unpopped popcorn products and 1 dry soup mix product because of their extremely high sodium concentrations and densities (accounting for, 0.5% of unit sales), yielding an analytic database with 7898 packaged food products (Figure 1).
In this analysis, we examined the sodium content of packaged foods within the USDA food categories shown to contribute the most sodium to the U.S. diet (19). We expanded the published list of 10 categories to include the top 20 food categories and included the Nielsen module subgroups, where applicable (19, 22). We examined the mean and distribution (SD, quartiles, range) of the sodium content in packaged foods in milligrams per serving and in milligrams per 100 g and the sodium density in milligrams per kilocalorie. Preliminary analyses yielded very few significant differences between weighted and unweighted estimates; therefore, we included results weighted by equivalized unit sales (in ounces or each sold). The serving size listed on the NFP was used to estimate the sodium content per serving. For the purpose of monitoring the sodium content of packaged foods as they are sold, we used the NFP label data for the food “as packaged” in this analysis, rather than incorporating the “as prepared” variations. We calculated the sales-weighted proportion of products within each food category for which a single serving exceeds the FDA sodium limits for foods, meals, or main dish products that use a “healthy” label claim. This limit is 600 mg/serving for main dishes and meals. For individual foods with a Reference Amount Customarily Consumed (RACC) of >30 g, the limit is 480 mg/serving. For individual foods with an RACC of ≤30 g, the limit is 480 mg sodium/50 g (10). To compare the sodium content of products to the U.S. DGA sodium recommendations, we also estimated the sales-weighted proportion of products for which a single serving exceeds 50% of the DGA-recommended daily sodium intake of <2300 mg (1150 mg/serving) (6). We used SAS version 9.3 for all analyses.
RESULTS
Table 1 shows the number of products (UPCs), the number of unique brands, the millions of equivalent units sold (in ounces or each), and the sales-weighted means and ranges of serving sizes (in grams) for packaged food products within the top 20 USDA food categories that contribute the most sodium to the average U.S. diet, in descending rank of sodium intake contribution. We also included the FDA’s RACC within each food category for reference purposes (23). The bread and rolls category had the largest number of unique brands represented in our database (n = 114). The frankfurters and sausages category contained 91 unique brands, followed by the savory snacks category, with 82 unique brands. The eggs and egg mixed dishes category had the smallest number of unique brands, with only 5 that comprised the top 80% of unit sales within that category. Products in the savory snacks category had the highest unit sales in our database, representing 2.5 billion ounces sold in 2009. Bread and rolls had the second highest unit sales, with just over 2 billion ounces sold. Serving sizes varied widely across categories, even for those with a specific RACC that applied to all products within a category. The sales-weighted mean serving size exceeded the RACC in the following several categories or subcategories: frozen bread; fresh buns, rolls, bagels, etc.; frozen pasta mixed dishes; meat mixed dishes; fried rice, lo mein, stir-fry mixtures; and frozen/refrigerated biscuits, muffins, and quick breads.
TABLE 1.
Number of products, unique brands, equivalent units sold, RACC, and label serving size in branded packaged foods by the top food categories contributing to sodium consumption1
| Rank2 | Food category | Products, n | Unique brands, n | Equivalent units sold,3 in millions | RACC4 | Label serving size,5 g
|
|
|---|---|---|---|---|---|---|---|
| Range | Mean | ||||||
| 1 | Breads and rolls | 705 | 114 | 2006 | 50 g | 18–104 | 45 |
| Frozen | 22 | 10 | 39 | 35–94 | 51 | ||
| Fresh bread | 490 | 94 | 1444 | 18–76 | 40 | ||
| Fresh buns/rolls/bagels/etc. | 193 | 48 | 523 | 26–104 | 63 | ||
| 2 | Cold cuts and cured meats | 294 | 46 | 840 | 55 g | 28–85 | 45 |
| Canned | 14 | 6 | 60 | 57–85 | 59 | ||
| Refrigerated | 280 | 42 | 780 | 28–85 | 44 | ||
| 3 | Pizza | 157 | 19 | 752 | 140 g | 68–284 | 138 |
| 4 | Poultry | 38 | 20 | 107 | 114 g | 57–227 | 112 |
| 5 | Soups | 199 | 9 | 1529 | 245 g | 64–305 | 201 |
| 6 | Sandwiches | 122 | 17 | 357 | 140 g | 32–201 | 113 |
| 7 | Cheese | 506 | 59 | 1240 | 5–55 g | 5–96 | 26 |
| Natural | 257 | 37 | 487 | 16–85 | 27 | ||
| Processed | 127 | 30 | 400 | 17–96 | 24 | ||
| Shredded/grated | 122 | 13 | 352 | 5–28 | 26 | ||
| 8 | Pasta mixed dishes | 181 | 21 | 980 | 140–195 g or 1 cup | 31–482 | 222 |
| Frozen | 110 | 12 | 400 | 132–482 | 265 | ||
| Other | 71 | 9 | 580 | 31–284 | 181 | ||
| 9 | Meat mixed dishes | 110 | 30 | 486 | 140–195 g or 1 cup | 82–454 | 246 |
| Frozen | 79 | 20 | 368 | 82–454 | 255 | ||
| Canned | 31 | 11 | 118 | 213–298 | 225 | ||
| 10 | Savory snacks | 463 | 82 | 2450 | 30 g | 18–71 | 29 |
| Potato chips | 114 | 21 | 868 | 21–42 | 28 | ||
| Tortilla chips | 118 | 26 | 758 | 27–44 | 28 | ||
| Other | 231 | 49 | 824 | 18–71 | 30 | ||
| 11 | Burritos, tacos, tamales | 95 | 23 | 247 | 140–195 g | 28–513 | 138 |
| 12 | Frankfurters and sausages | 417 | 91 | 1205 | 55–75 g | 28–170 | 62 |
| Sausages | 247 | 61 | 559 | 30–170 | 67 | ||
| Frankfurters/bratwursts | 170 | 45 | 646 | 28–113 | 58 | ||
| 13 | Salad dressings and vegetable oils | 229 | 24 | 376 | 30 g | 8–32 | 28 |
| 14 | Ready-to-eat cereal | 148 | 44 | 1,341 | 15–55 g | 26–64 | 37 |
| 15 | Tomato-based condiments | 167 | 36 | 538 | 15–125 g | 14–67 | 26 |
| 16 | Eggs and egg mixed dishes | 20 | 5 | 76 | 50–110 g | 45–227 | 94 |
| 17 | Fried rice, lo mein, stir-fry mixtures | 72 | 19 | 150 | 140–195 g or 1 cup | 85–425 | 263 |
| 18 | Poultry mixed dishes | 155 | 25 | 558 | 140–195 g or 1 cup | 68–489 | 224 |
| 19 | Biscuits, muffins, quick breads | 97 | 18 | 562 | 55 g | 27–113 | 54 |
| Frozen/refrigerated | 46 | 4 | 197 | 28–113 | 60 | ||
| Fresh | 26 | 6 | 180 | 32–92 | 57 | ||
| Mixes | 25 | 9 | 185 | 27–47 | 38 | ||
| 20 | Macaroni and cheese | 22 | 7 | 318 | 1 cup | 58–365 | 135 |
RACC, Reference Amount Customarily Consumed (per eating occasion).
Ranks are based on descending order of food group’s contribution to total sodium consumption among all participants (aged ≥2 y) in NHANES 2007–2008 as published in reference 19 and expanded to include the top 20 food categories. Subgroups are based on Nielsen modules to group similar products.
Units sold in ounces or each (1 ounce = 28.35 grams).
RACC as defined by the Food and Drug Administration general provision (23). For mixed dish–type foods that can be measured in cups (e.g., fried rice), the RACC is 1 cup. For mixed dish–type foods that cannot be measured in cups (e.g., lasagna), the RACC is given in grams.
Ranges and mean serving sizes in grams from the products’ Nutrition Facts Panel. Mean serving size is based on equivalized sales-weighted estimates (weighted by the number of equivalent units sold in ounces or each).
Products in the meat mixed dishes category had the highest sales-weighted mean and median sodium contents in milligrams per serving at 966 and 970 mg, respectively; the IQR was 740–1100 mg/serving (Table 2). Among meat mixed dishes, the frozen products had a slightly lower sodium content in milligrams per serving than the canned products (mean = 935 mg/serving vs 1046 mg/serving). Products in the pasta mixed dishes category had the second highest mean sodium content in milligrams per serving, at 805 mg, with a median of 810 mg and an IQR of 660–940 mg/serving. The sodium content in milligrams per serving in frozen pasta mixed dishes was also slightly lower than in the other products in the category (mean = 792 and 817 mg/serving, respectively). Products in the poultry mixed dishes, which was composed primarily of frozen foods, had a mean sodium content of 830 mg/serving, a median of 790 mg/serving, with an IQR of 560–1040 mg/serving. In the bread and rolls category, which contributes the most sodium to the average U.S. diet, products had a mean and median of 216 and 200 mg sodium/serving, with an IQR of 150–250 mg/serving. Unlike products in the meat and pasta mixed dishes categories, in which the sodium content in the frozen products was slightly lower than others (canned, shelf-stable, etc.), in the bread and rolls category, frozen bread had a slightly higher mean and median sodium content per serving (245 and 240 mg/serving, respectively) compared with fresh bread (192 and 190 mg/serving, respectively). Compared with bread and rolls, only products in the savory snacks and ready-to-eat cereal categories had lower weighted-mean sodium contents in milligrams per serving at 202 and 172 mg, respectively (median: 180 mg/serving for both categories; IQR: 150–240 and 140–200 mg/serving, respectively). The highest variation in sodium in milligrams per serving within the 25th and 75th quartiles was observed in the poultry mixed dishes category, with an IQR of 480 mg/serving. The smallest IQR of 60 mg/serving was observed in the ready-to-eat cereal category.
TABLE 2.
Distribution of sodium content in milligrams per label serving in branded packaged foods by the top food categories contributing to sodium consumption1
| Rank2 | Food category | Range | Mean ± SD | Percentile
|
||||
|---|---|---|---|---|---|---|---|---|
| 10th | 25th | 50th | 75th | 90th | ||||
| 1 | Breads and rolls | 0–620 | 216 ± 88 | 120 | 150 | 200 | 250 | 330 |
| Frozen | 130–490 | 245 ± 81 | 130 | 210 | 240 | 280 | 350 | |
| Fresh bread | 0–480 | 192 ± 61 | 120 | 150 | 190 | 230 | 280 | |
| Fresh buns/rolls/bagels/etc. | 85–620 | 299 ± 116 | 190 | 210 | 250 | 400 | 470 | |
| 2 | Cold cuts and cured meats | 210–1050 | 497 ± 177 | 280 | 350 | 490 | 620 | 740 |
| Canned | 450–990 | 682 ± 137 | 490 | 580 | 790 | 790 | 790 | |
| Refrigerated | 210–1050 | 485 ± 173 | 280 | 320 | 470 | 620 | 720 | |
| 3 | Pizza | 270–1460 | 765 ± 202 | 480 | 630 | 770 | 890 | 1000 |
| 4 | Poultry | 65–1040 | 374 ± 199 | 85 | 190 | 380 | 490 | 580 |
| 5 | Soups | 150–1200 | 700 ± 195 | 450 | 480 | 690 | 870 | 890 |
| 6 | Sandwiches | 125–1260 | 615 ± 179 | 420 | 540 | 620 | 740 | 800 |
| 7 | Cheese | 16–520 | 237 ± 93 | 150 | 180 | 210 | 270 | 410 |
| Natural | 16–420 | 177 ± 57 | 125 | 170 | 180 | 200 | 220 | |
| Processed | 70–520 | 315 ± 75 | 250 | 270 | 270 | 410 | 420 | |
| Shredded/grated | 45–430 | 190 ± 64 | 85 | 170 | 190 | 200 | 230 | |
| 8 | Pasta mixed dishes | 300–1470 | 805 ± 177 | 600 | 660 | 810 | 940 | 990 |
| Frozen | 430–1470 | 792 ± 202 | 580 | 650 | 740 | 880 | 1040 | |
| Other | 300–1300 | 817 ± 148 | 600 | 700 | 880 | 950 | 980 | |
| 9 | Meat mixed dishes | 80–1960 | 966 ± 301 | 610 | 740 | 970 | 1100 | 1270 |
| Frozen | 80–1960 | 935 ± 339 | 590 | 710 | 890 | 1100 | 1390 | |
| Canned | 780–1270 | 1046 ± 135 | 870 | 970 | 1000 | 1200 | 1200 | |
| 10 | Savory snacks | 0–610 | 202 ± 89 | 110 | 150 | 180 | 240 | 310 |
| Potato chips | 5–380 | 186 ± 50 | 135 | 170 | 180 | 200 | 230 | |
| Tortilla chips | 0–290 | 149 ± 44 | 110 | 115 | 150 | 180 | 210 | |
| Other | 15–610 | 275 ± 105 | 160 | 200 | 260 | 320 | 410 | |
| 11 | Burritos, tacos, tamales | 240–1570 | 508 ± 236 | 270 | 300 | 480 | 630 | 760 |
| 12 | Frankfurters and sausages | 190–1330 | 557 ± 163 | 400 | 470 | 520 | 640 | 740 |
| Sausages | 190–1220 | 531 ± 178 | 350 | 440 | 490 | 600 | 710 | |
| Frankfurters/bratwursts | 230–1330 | 578 ± 147 | 450 | 480 | 550 | 680 | 760 | |
| 13 | Salad dressings and vegetable oils | 10–620 | 304 ± 85 | 210 | 260 | 310 | 350 | 410 |
| 14 | Ready-to-eat cereal | 0–350 | 172 ± 80 | 50 | 140 | 180 | 200 | 290 |
| 15 | Tomato-based condiments | 30–970 | 244 ± 102 | 190 | 190 | 200 | 260 | 430 |
| 16 | Eggs and egg mixed dishes | 75–1490 | 356 ± 425 | 95 | 115 | 115 | 390 | 1200 |
| 17 | Fried rice, lo mein, stir-fry mixtures | 135–1390 | 724 ± 268 | 490 | 570 | 650 | 850 | 1200 |
| 18 | Poultry mixed dishes | 85–1810 | 830 ± 350 | 460 | 560 | 790 | 1040 | 1340 |
| 19 | Biscuits, muffins, quick breads | 115–840 | 369 ± 166 | 180 | 200 | 340 | 540 | 580 |
| Frozen/refrigerated | 270–840 | 528 ± 97 | 360 | 510 | 550 | 580 | 580 | |
| Fresh | 130–540 | 210 ± 71 | 170 | 180 | 200 | 220 | 250 | |
| Mixes | 115–400 | 290 ± 74 | 160 | 220 | 340 | 340 | 340 | |
| 20 | Macaroni and cheese | 550–990 | 759 ± 153 | 580 | 580 | 820 | 920 | 940 |
Distribution is based on equivalized sales-weighted estimates [weighted by the number of equivalent units sold in ounces or each (1 ounce = 28.35 grams)].
Ranks are based on descending order of food group’s contribution to total sodium consumption among all participants (aged ≥2 y) in NHANES 2007–2008 as published in reference 19 and expanded to include the top 20 food categories. Subgroups are based on Nielsen modules to group similar products.
Products in the processed-cheese subcategory had the highest mean sodium concentration in milligrams per 100 g, with a mean of 1326 mg/100 g, which was higher than in natural cheese products, with a mean of 647 mg/100 g (Table 3). Although formal statistical testing was not performed, the 10th percentile of processed cheese (1223 mg/100 g) was higher than the 90th percentile of natural cheese (786 mg/100 g). Products in the cold cuts and cured meats category had the second highest sodium concentration in milligrams per 100 g, with a mean of 1117, a median of 1093, and an IQR of 988–1214 (226 mg/100 g). Products in the salad dressings and the tomato-based condiments categories had mean sodium concentrations of 1072 and 974 mg/100 g, respectively. Products in the fried rice, lo mein, and stir-fry mixtures and the eggs and egg mixed dishes categories had the lowest concentrations, with means of 289 and 293 mg/100 g, respectively. The IQR of sodium concentrations in milligrams per 100 g ranged from 101 mg in bread and rolls (435–536 mg/100 g) to 688 mg in the cheese category (635–1323 mg/100 g).
TABLE 3.
Distribution of sodium content in milligrams per 100 g in branded packaged foods by the top food categories contributing to sodium consumption1
| Rank2 | Food category | Range | Mean ± SD | Percentile
|
||||
|---|---|---|---|---|---|---|---|---|
| 10th | 25th | 50th | 75th | 90th | ||||
| 1 | Breads and rolls | 0–857 | 486 ± 90 | 370 | 435 | 494 | 536 | 577 |
| Frozen | 320–698 | 470 ± 88 | 344 | 368 | 474 | 541 | 561 | |
| Fresh bread | 0–857 | 489 ± 93 | 370 | 441 | 494 | 540 | 588 | |
| Fresh buns/rolls/bagels/etc. | 300–808 | 477 ± 76 | 376 | 423 | 494 | 519 | 549 | |
| 2 | Cold cuts and cured meats | 633–2257 | 1117 ± 234 | 864 | 988 | 1093 | 1214 | 1376 |
| Canned | 794–1393 | 1159 ± 227 | 864 | 988 | 1041 | 1393 | 1393 | |
| Refrigerated | 633–2257 | 1114 ± 234 | 864 | 988 | 1093 | 1204 | 1340 | |
| 3 | Pizza | 229–812 | 555 ± 94 | 439 | 494 | 548 | 630 | 688 |
| 4 | Poultry | 57–860 | 351 ± 191 | 76 | 179 | 339 | 515 | 631 |
| 5 | Soups | 66–1881 | 410 ± 262 | 182 | 255 | 338 | 457 | 714 |
| 6 | Sandwiches | 196–1025 | 554 ± 134 | 361 | 459 | 578 | 643 | 713 |
| 7 | Cheese | 56–1799 | 964 ± 390 | 600 | 635 | 776 | 1323 | 1481 |
| Natural | 56–1376 | 647 ± 179 | 459 | 600 | 635 | 705 | 786 | |
| Processed | 304–1799 | 1326 ± 214 | 1223 | 1270 | 1323 | 1467 | 1481 | |
| Shredded/grated | 159–1786 | 815 ± 339 | 600 | 635 | 670 | 776 | 1517 | |
| 8 | Pasta mixed dishes | 178–2463 | 460 ± 385 | 232 | 287 | 357 | 438 | 829 |
| Frozen | 178–590 | 306 ± 73 | 215 | 245 | 311 | 342 | 404 | |
| Other | 242–2463 | 605 ± 491 | 287 | 359 | 438 | 466 | 1146 | |
| 9 | Meat mixed dishes | 53–923 | 426 ± 135 | 275 | 335 | 408 | 536 | 564 |
| Frozen | 53–923 | 408 ± 146 | 259 | 306 | 379 | 509 | 578 | |
| Canned | 323–597 | 472 ± 84 | 356 | 383 | 470 | 560 | 564 | |
| 10 | Savory snacks | 0–2152 | 703 ± 307 | 397 | 516 | 635 | 847 | 1058 |
| Potato chips | 18–1404 | 667 ± 190 | 464 | 598 | 635 | 739 | 850 | |
| Tortilla chips | 0–995 | 531 ± 159 | 388 | 406 | 529 | 635 | 741 | |
| Other | 53–2152 | 926 ± 375 | 516 | 647 | 907 | 1083 | 1359 | |
| 11 | Burritos, tacos, tamales | 131–1368 | 420 ± 197 | 238 | 265 | 388 | 491 | 637 |
| 12 | Frankfurters and sausages | 310–1651 | 927 ± 216 | 634 | 811 | 926 | 1088 | 1199 |
| Sausages | 310–1651 | 805 ± 215 | 556 | 634 | 811 | 911 | 1076 | |
| Frankfurters/bratwursts | 406–1481 | 1023 ± 161 | 826 | 917 | 1036 | 1158 | 1214 | |
| 13 | Salad dressings and vegetable oils | 35–2187 | 1072 ± 298 | 741 | 917 | 1067 | 1199 | 1446 |
| 14 | Ready-to-eat cereal | 0–941 | 513 ± 219 | 136 | 448 | 559 | 670 | 705 |
| 15 | Tomato-based condiments | 106–1679 | 974 ± 274 | 661 | 772 | 1106 | 1117 | 1235 |
| 16 | Eggs and egg mixed dishes | 68–657 | 293 ± 158 | 168 | 168 | 203 | 379 | 534 |
| 17 | Fried rice, lo mein, stir-fry mixtures | 113–776 | 289 ± 122 | 156 | 208 | 267 | 323 | 469 |
| 18 | Poultry mixed dishes | 75–1235 | 426 ± 192 | 231 | 298 | 384 | 524 | 679 |
| 19 | Biscuits, muffins, quick breads | 250–1689 | 710 ± 295 | 344 | 383 | 847 | 952 | 1004 |
| Frozen/refrigerated | 344–1689 | 928 ± 183 | 612 | 935 | 952 | 1004 | 1058 | |
| Fresh | 250–952 | 369 ± 121 | 289 | 317 | 353 | 383 | 423 | |
| Mixes | 364–1429 | 756 ± 201 | 458 | 613 | 847 | 847 | 847 | |
| 20 | Macaroni and cheese | 201–1204 | 685 ± 241 | 353 | 427 | 829 | 847 | 902 |
Distribution is based on equivalized sales-weighted estimates [weighted by the number of equivalent units sold in ounces or each (1 ounce = 28.35 grams)].
Ranks are based on descending order of food group’s contribution to total sodium consumption among all participants (aged ≥2 y) in NHANES 2007–2008 as published in reference 19 and expanded to include the top 20 food categories. Subgroups are based on Nielsen modules to group similar products.
Table 4 shows the sales-weighted sodium density in milligrams per kilocalorie. Products in the soup and tomato-based condiments categories had the highest density, with means of 18.4 and 13.0 mg/kcal respectively, and medians of 7.3 and 12.7 mg/kcal, respectively. These categories were followed by cold cuts and cured meats, which had a mean density of 7.3 mg/kcal, a median of 6.8 mg/kcal, and an IQR of 3.7–10.2 mg/kcal. Ready-to-eat cereals and savory snacks had the lowest sodium density, with a mean of 1.4 mg/kcal in both categories (median: 1.5 and 1.2 mg/kcal, respectively). The IQR of sodium density varied the least (0.4 mg/kcal) in the macaroni and cheese and bread and rolls categories, with 25th–75th percentiles of 2.2–2.6 and 1.7–2.1 mg/kcal, respectively. The variation was greatest in the soup category, as indicated by the SD of 25.2 mg/kcal and the IQR of 9.5 mg/kcal (5.3–14.8 mg/kcal). The variation was second highest in the cold cuts and cured meats category, with an IQR that spanned 6.5 mg/kcal.
TABLE 4.
Distribution of sodium density in milligrams per kilocalorie in branded packaged foods by the top food categories contributing to sodium consumption1
| Rank2 | Food category | Range | Mean ± SD | Percentile
|
||||
|---|---|---|---|---|---|---|---|---|
| 10th | 25th | 50th | 75th | 90th | ||||
| 1 | Breads and rolls | 0–6 | 1.9 ± 0.4 | 1.4 | 1.7 | 1.9 | 2.1 | 2.4 |
| Frozen | 1–2 | 1.7 ± 0.3 | 1.3 | 1.4 | 1.7 | 1.8 | 2.1 | |
| Fresh bread | 0–6 | 1.9 ± 0.4 | 1.4 | 1.7 | 1.9 | 2.2 | 2.4 | |
| Fresh buns/rolls/bagels/etc. | 1–3 | 1.8 ± 0.3 | 1.4 | 1.6 | 1.8 | 1.9 | 2.2 | |
| 2 | Cold cuts and cured meats | 1–15 | 7.2 ± 3.5 | 3.3 | 3.7 | 6.8 | 10.2 | 12.0 |
| Canned | 3–5 | 4.3 ± 0.7 | 3.2 | 4.1 | 4.4 | 4.4 | 5.3 | |
| Refrigerated | 1–15 | 7.3 ± 3.5 | 3.3 | 3.7 | 7.3 | 10.2 | 12.4 | |
| 3 | Pizza | 1–3 | 2.2 ± 0.4 | 1.8 | 2.0 | 2.2 | 2.6 | 2.8 |
| 4 | Poultry | 0–9 | 2.2 ± 1.5 | 0.3 | 1.6 | 1.9 | 2.4 | 3.9 |
| 5 | Soups | 3–194 | 18.4 ± 25.2 | 4.2 | 5.3 | 7.3 | 14.8 | 62.0 |
| 6 | Sandwiches | 1–3 | 2.2 ± 0.5 | 1.6 | 1.9 | 2.2 | 2.5 | 3.0 |
| 7 | Cheese | 0–10 | 3.2 ± 1.6 | 1.5 | 1.7 | 2.8 | 4.2 | 5.3 |
| Natural | 0–7 | 2.0 ± 0.8 | 1.5 | 1.5 | 1.7 | 2.5 | 3.0 | |
| Processed | 1–10 | 4.6 ± 1.2 | 3.9 | 3.9 | 4.3 | 5.3 | 6.2 | |
| Shredded/grated | 0–6 | 2.4 ± 1.0 | 1.6 | 1.6 | 2.1 | 2.5 | 4.3 | |
| 8 | Pasta mixed dishes | 1–7 | 3.0 ± 1.0 | 1.9 | 2.4 | 3.0 | 3.6 | 3.8 |
| Frozen | 1–4 | 2.5 ± 0.5 | 1.8 | 2.0 | 2.4 | 2.8 | 3.1 | |
| Other | 2–7 | 3.6 ± 1.0 | 2.5 | 3.1 | 3.5 | 3.8 | 4.1 | |
| 9 | Meat mixed dishes | 0–6 | 3.3 ± 1.1 | 2.2 | 2.6 | 3.1 | 4.2 | 4.6 |
| Frozen | 0–6 | 3.1 ± 1.1 | 2.1 | 2.3 | 2.8 | 3.8 | 4.4 | |
| Canned | 2–5 | 3.8 ± 0.8 | 2.6 | 2.9 | 4.4 | 4.6 | 4.6 | |
| 10 | Savory snacks | 0–13 | 1.4 ± 0.8 | 0.8 | 1.0 | 1.2 | 1.6 | 2.3 |
| Potato chips | 0–3 | 1.3 ± 0.4 | 0.9 | 1.1 | 1.2 | 1.3 | 1.5 | |
| Tortilla chips | 0–2 | 1.0 ± 0.3 | 0.7 | 0.8 | 1.0 | 1.2 | 1.5 | |
| Other | 0–13 | 2.0 ± 1.1 | 1.1 | 1.4 | 1.8 | 2.3 | 3.2 | |
| 11 | Burritos, tacos, tamales | 1–7 | 1.9 ± 0.8 | 1.0 | 1.2 | 1.9 | 2.2 | 2.6 |
| 12 | Frankfurters and sausages | 1–13 | 3.4 ± 1.3 | 2.3 | 2.7 | 3.1 | 4.0 | 4.7 |
| Sausages | 1–10 | 3.0 ± 1.2 | 1.9 | 2.4 | 2.7 | 3.2 | 4.5 | |
| Frankfurters/bratwursts | 2–13 | 3.8 ± 1.3 | 2.7 | 3.0 | 3.8 | 4.0 | 4.8 | |
| 13 | Salad dressings and vegetable oils | 0–32 | 4.0 ± 4.1 | 1.6 | 1.9 | 2.5 | 4.5 | 7.0 |
| 14 | Ready-to-eat cereal | 0–3 | 1.4 ± 0.6 | 0.4 | 1.2 | 1.5 | 1.8 | 1.9 |
| 15 | Tomato-based condiments | 3–40 | 13.0 ± 6.5 | 4.7 | 9.5 | 12.7 | 15.0 | 25.0 |
| 16 | Eggs and egg mixed dishes | 2–6 | 3.6 ± 0.9 | 2.6 | 3.0 | 3.2 | 3.8 | 3.8 |
| 17 | Fried rice, lo mein, stir-fry mixtures | 1–43 | 4.1 ± 6.0 | 1.3 | 1.9 | 2.5 | 3.7 | 10.0 |
| 18 | Poultry mixed dishes | 1–11 | 2.7 ± 1.5 | 1.5 | 1.7 | 2.5 | 3.0 | 4.3 |
| 19 | Biscuits, muffins, quick breads | 1–4 | 2.4 ± 0.8 | 1.3 | 1.7 | 2.3 | 3.1 | 3.5 |
| Frozen/refrigerated | 2–4 | 3.2 ± 0.3 | 2.8 | 3.0 | 3.2 | 3.4 | 3.6 | |
| Fresh | 1–4 | 1.6 ± 0.6 | 0.9 | 1.7 | 1.7 | 1.8 | 1.8 | |
| Mixes | 1–4 | 2.0 ± 0.5 | 1.2 | 1.8 | 2.3 | 2.3 | 2.3 | |
| 20 | Macaroni and cheese | 1–4 | 2.5 ± 0.4 | 2.2 | 2.2 | 2.4 | 2.6 | 2.8 |
Distribution is based on equivalized sales-weighted estimates [weighted by the number of equivalent units sold in ounces or each (1 ounce = 28.35 grams)].
Ranks are based on descending order of food group’s contribution to total sodium consumption among all participants (aged ≥2 y) in NHANES 2007–2008 as published in reference 19 and expanded to include the top 20 food categories. Subgroups are based on Nielsen modules to group similar products.
Table 5 shows the sales-weighted proportion of products sold within each food category for which a single serving is greater than the following: 1) the FDA sodium limits for products using a “healthy” label claim and 2) 1150 mg/serving (one-half the DGA recommendation of <2300 mg/d). More than half of products sold in 11 out of the 20 food categories contain more sodium per serving (or per 50 g) than the applicable FDA limits for “healthy” foods, including the following: meat mixed dishes (90.4%), particularly among canned products in this category (100%); pasta mixed dishes (83.2%); pizza (77%); cold cuts and cured meats (68%), particularly among canned products (92%); fried rice, lo mein, and stir-fry mixtures (68%); poultry mixed dishes (66.9%); soups (64.3%); macaroni and cheese (62.9%); frankfurters and sausages (62.6%); salad dressings and vegetable oils (60.8%); and sandwiches (53.2%). In addition, 91.3% of products in the processed-cheese subcategory exceeded the FDA limit, whereas only 1.4% of natural cheese products were above this cutoff. Among biscuits, muffins, and quick breads, 81.7% of frozen or refrigerated products exceeded the FDA limit for healthy label claims, whereas only 3.7% of fresh products in this category were above this level. In 3 categories (meat mixed dishes, pasta mixed dishes, and pizza) and in 3 subcategories (canned cold cuts and cured meats, processed cheese, and frozen or refrigerated biscuits, muffins, and quick breads) >75% of the products sold have more sodium per serving (or per 50 g) than the FDA limit for “healthy” foods. In 4 categories, >10% of the products exceeded 1150 mg sodium/serving: meat mixed dishes (22.7%); poultry mixed dishes (15.8%); fried rice, lo mein, and stir-fry mixtures (13.2%); and eggs and egg mixed dishes (11.2%).
TABLE 5.
Percentage of branded packaged food products that exceed specific levels of sodium by the top food categories contributing to sodium consumption1
| Rank2 | Food category | More than the FDA sodium limit for “healthy”,3 % (SE) | More than 1150 mg/serving,4 % (SE) |
|---|---|---|---|
| 1 | Breads and rolls5 | 1.8 (1.3) | — |
| Frozen | 3.2 (3.3) | — | |
| Fresh bread | |||
| Fresh buns/rolls/bagels/etc. | 8.3 (6.0) | — | |
| 2 | Cold cuts and cured meats5 | 68.0 (4.2) | — |
| Canned | 92.0 (6.2) | — | |
| Refrigerated | 66.5 (4.3) | — | |
| 3 | Pizza6 | 77.0 (4.0) | 2.8 (1.1) |
| 4 | Poultry6 | 6.8 (4.2) | — |
| 5 | Soups6 | 64.3 (5.2) | 1.3 (0.8) |
| 6 | Sandwiches6 | 53.2 (6.5) | 0.7 (0.5) |
| 7 | Cheese5 | 42.2 (5.5) | — |
| Natural | 1.4 (0.6) | — | |
| Processed | 91.3 (2.6) | — | |
| Shredded/grated | 18.4 (4.8) | — | |
| 8 | Pasta mixed dishes6 | 83.2 (3.5) | 3.2 (1.1) |
| Frozen | 81.8 (3.8) | 6.1 (2.1) | |
| Other | 84.6 (5.8) | 0.4 (0.4) | |
| 9 | Meat mixed dishes6 | 90.4 (2.8) | 22.7 (5.6) |
| Frozen | 86.7 (3.9) | 18.4 (4.7) | |
| Canned | 100.0 (0.0) | 33.8 (14.5) | |
| 10 | Savory snacks5 | 11.8 (2.2) | — |
| Potato chips | 4.8 (2.7) | — | |
| Tortilla chips | 1.1 (0.8) | — | |
| Other | 30.1 (4.9) | — | |
| 11 | Burritos, tacos, tamales6 | 29.3 (5.9) | 1.9 (1.6) |
| 12 | Frankfurters and sausages5 | 62.6 (4.5) | 1.2 (0.5) |
| Sausages | 58.9 (4.8) | 0.8 (0.5) | |
| Frankfurters/bratwursts | 65.5 (7.0) | 1.5 (0.9) | |
| 13 | Salad dressings and vegetable oils5 | 60.8 (5.4) | — |
| 14 | Ready-to-eat cereal5 | — | — |
| 15 | Tomato-based condiments5 | 47.5 (8.8) | — |
| 16 | Eggs and egg mixed dishes6 | 22.2 (9.8) | 11.2 (7.2) |
| 17 | Fried rice, lo mein, stir-fry mixtures6 | 68.0 (6.5) | 13.2 (6.2) |
| 18 | Poultry mixed dishes6 | 66.9 (4.7) | 15.8 (3.9) |
| 19 | Biscuits, muffins, quick breads5 | 38.0 (8.6) | — |
| Frozen/refrigerated | 81.7 (6.0) | — | |
| Fresh | 3.7 (3.9) | — | |
| Mixes | 4.7 (3.8) | — | |
| 20 | Macaroni and cheese6 | 62.9 (18.6) | — |
Distribution is based on equivalized sales-weighted estimates [weighted by the number of equivalent units sold in ounces or each (1 ounce = 28.35 grams)]. FDA, Food and Drug Administration; RACC, Reference Amount Customarily Consumed.
Ranks are based on descending order of food group’s contribution to total sodium consumption among all participants (aged ≥2 y) in NHANES 2007–2008 as published in reference 19 and expanded to include the top 20 food categories. Subgroups are based on Nielsen modules to group similar products.
FDA sodium limit for products using a “healthy” label claim: 480 mg/serving for individual foods with a RACC >30 g, 480 mg/50 g for individual foods with a RACC ≤30 g, 600 mg/serving for meals or main dishes (9).
More than 1150 mg/serving = 50% of the Dietary Guidelines for Americans recommendation (2300 mg/d) (6).
Defined as an individual food for FDA sodium limits (foods with an RACC >30 g = 480 mg/serving, foods with an RACC ≤30 g = 480 mg/50 g) (23).
Defined as a meal or main dish for FDA sodium limits (600 mg/serving) (23).
DISCUSSION
In 2009, the sodium content of commercially processed packaged foods in the 20 categories contributing the most to U.S. sodium intake was high and varied substantially within categories, as well as within subcategories. More than half of products sold in 11 of the 20 food categories examined exceeded the FDA’s limits for the “healthy” label claim per serving. Given the high average sodium per serving in these products, it does not require many servings to exceed the DGA recommendations for sodium intake. In 4 of these food categories, >10% of the products sold exceeded 1150 mg/serving, meaning it would require <2 servings of these foods to exceed the DGA recommendation of 2300 mg/d. Sodium serves several important purposes in food processing and manufacturing, and some of the food categories examined in this analysis are heterogeneous and capture a wide variety of products, particularly in the mixed dishes categories. However, we observed a wide variation in sodium content in milligrams per serving, milligrams per 100g, and milligrams per kilocalorie in these foods, indicating the potential for choosing products to attain a “healthy” diet within all of the categories examined here. Although a large proportion of the products we examined exceeded the sodium targets for the “intermediate” sodium level DASH diet in terms of milligrams per kilocalorie (range: 1.02–1.15 mg/kcal), it is important to note that this particular measure should be interpreted with care, because foods that are high in fat or sugar and hence relatively low in sodium per kilocalorie may be misinterpreted as being “healthy” (8). Given that 9 of 10 Americans exceed the daily recommended intake of sodium (4), our results emphasize the importance at the consumer level of reading product labels and selecting products that are lower in sodium. Although it is difficult to compare our findings with previous results because of differences in categorization of foods, databases and years examined, and definitions of “healthy” sodium content, our findings support those in the United States and in other developed countries that showed excess sodium content in commercially processed and packaged foods, as well as wide variation in the sodium content within food categories (24–28).
There are some acknowledged limitations to this database. First, because Gladson collects data from food manufacturers passively, the products in the 2009 database range from 2000 to 2010 in their dates of entry or update (with the exception of those products for which the NFP data had to be manually entered in 2012); 77% of products were entered or updated between 2008 and 2010; the remaining 23% were entered or updated before 2008. It is not known whether the older nutrition information for a particular product is valid because no changes were made to that product or whether the product indeed changed but the manufacturer did not send updated information to Gladson for entry into its database. Second, all of the nutritional information is extracted directly from the NFP rather than from laboratory analysis of the foods. According to FDA regulatory standards, the label value on the NFP can exceed the actual sodium content by as much as 20% before the food is considered misbranded (29). However, we compared the sales-weighted average sodium values from the NFP for sliced white bread and hamburger and hotdog buns with recent USDA laboratory results on these foods and found that the average NFP data closely aligned (64%) with the average values from the analysis for these foods (J Ahuja, unpublished results, 2013). The third limitation is that the 2009 Nielsen sales data did not capture warehouse-type retail sales (e.g., Costco, Sam’s Club), Walmart grocery sales, or sales from independent or smaller grocery chains that gross <$2 million/y in sales. Walmart has become the largest U.S. food retailer, and discount supercenters and warehouse club stores currently account for ~30% of U.S. grocery sales (30, 31). Although Walmart pledged in 2011 to reduce the sodium content in their private label products by 25% (32), no available evidence indicates that the sodium content of packaged foods available through this or other warehouse-type outlets differed substantially in 2009 from that of the major retailers included in the Nielsen data. Fourth, our database does not include private-label or generic food products, which were estimated to account for ~25% of calories sold in 2007 (33). However, we have no reason to believe that these products differ substantially in their nutritional composition from their branded counterparts. Also, our database is limited to those products that comprised the top 80% of sales or >1% of sales within each food category in the 2009 Nielsen ScanTrack database; and because identical products of a different size have a unique UPC, our database may contain some replicate products. Although several other sales and NFP databases exist and are publicly available for sale, we determined the Nielsen ScanTrack and Gladson databases to provide the most comprehensive information for the cost. Even taking into account these acknowledged limitations, we believe the database represents a valid cross-section of the nutritional composition of the most widely purchased packaged foods sold in U.S. grocery stores in 2009.
The DGA emphasizes the importance of reducing the sodium content of foods in the marketplace to allow consumers to reduce their sodium intake. Targets for sodium reduction in packaged and processed foods have already been established in Canada and the United Kingdom and by New York’s NSRI (11, 34, 35). Several food manufacturers have already committed to voluntarily reduce the sodium content of some of their products, some of which are listed as partners in the NSRI (11). Given the common consumption of packaged foods, a reduction in the sodium content of these products could greatly affect the overall sodium intake in the United States and thereby affect health outcomes.
With voluntary efforts already underway by some manufacturers to lower the sodium content in some of their products, it will be important to perform similar analyses in the future to examine progress over time in the U.S. market. Tracking the sodium content and sales of packaged and processed foods over time will complement trends in dietary intakes already assessed in national surveys. Such analyses can determine potential shifts in the U.S. market in response to voluntary efforts by manufacturers and consumer choice, as represented in the sales data.
Footnotes
The findings and conclusions in this report are those of the authors and do not necessarily represent the official position of the CDC or the USDA.
Supported by the CDC.
Abbreviations used: DASH, Dietary Approaches to Stop Hypertension; DGA, Dietary Guidelines for Americans; FDA, Food and Drug Administration; NFP, Nutrition Facts Panel; NSRI, National Salt Reduction Initiative; RACC, Reference Amount Customarily Consumed; UPC, Universal Product Code.
The authors’ responsibilities were as follows—CG: designed the research, wrote the manuscript, and had responsibility for the final content; JM: conducted the research and analyzed the data; KY: analyzed the data and performed statistical analyses; MEC, JPG, AM, JKCA, and RM: designed the research and had responsibility for the final content; and JL: conducted the research and had responsibility for the final content.
None of the authors had a conflict of interest.
References
- 1.Sacks FM, Svetkey LP, Vollmer WM, Appel LJ, Bray GA, Harsha D, Obarzanek E, Conlin PR, Miller ER, III, Simons-Morton DG, et al. Effects on blood pressure of reduced dietary sodium and the Dietary Approaches to Stop Hypertension (DASH) diet. N Engl J Med. 2001;344:3–10. doi: 10.1056/NEJM200101043440101. [DOI] [PubMed] [Google Scholar]
- 2.Institute of Medicine. Strategies to reduce sodium intake in the United States. Washington, DC: National Academies Press; 2010. [Google Scholar]
- 3.Go AS, Mozaffarian D, Roger VL, Benjamin EJ, Berry JD, Borden WB, Bravata DM, Dai S, Ford ES, Fox CS, et al. American Heart Association Statistics Committee and Stroke Statistics Subcommittee Heart disease and stroke statistics—2013 update: a report from the American Heart Association. Circulation. 2013;127:e6–e245. doi: 10.1161/CIR.0b013e31828124ad. [DOI] [PMC free article] [PubMed] [Google Scholar]
- 4.Cogswell ME, Zhang Z, Carriquiry AL, Gunn JP, Kuklina EV, Saydah SH, Yang Q, Moshfegh AJ. Sodium and potassium intakes among US adults: NHANES 2003–2008. Am J Clin Nutr. 2012;96:647–57. doi: 10.3945/ajcn.112.034413. [DOI] [PMC free article] [PubMed] [Google Scholar]
- 5.Mattes RD, Donnelly D. Relative contributions of dietary sodium sources. J Am Coll Nutr. 1991;10:383–93. doi: 10.1080/07315724.1991.10718167. [DOI] [PubMed] [Google Scholar]
- 6.USDA; U.S. Department of Health and Human Services. Dietary guidelines for Americans, 2010. 7. Washington, DC: U.S. Government Printing Office; 2011. [DOI] [PMC free article] [PubMed] [Google Scholar]
- 7.Guenther PM, Lyon J, Appel LJ. Modeling dietary patterns to assess sodium recommendations for nutrient adequacy. Am J Clin Nutr. 2013;97:842–7. doi: 10.3945/ajcn.112.047779. [DOI] [PubMed] [Google Scholar]
- 8.Svetkey LP, Sacks F, Obarzanek E, Vollmer WM, Appel LJ, Lin PH, Karanja NM, Harsha DW, Bray GA, Aickin M, et al. DASH-Sodium Collaborative Research Group The DASH Diet, Sodium Intake and Blood Pressure Trial (DASH-Sodium): rationale and design. J Am Diet Assoc. 1999;99(Suppl):S96–104. doi: 10.1016/s0002-8223(99)00423-x. [DOI] [PubMed] [Google Scholar]
- 9.U.S. Department of Health and Human Services; Food and Drug Administration. 21 CFR: Food and Drugs. Chapter I: Food and Drug Administration, Department of Health and Human Services. Subchapter B: Food for Human Consumption. Part 101: Food Labeling. Sect 101.14. [Google Scholar]
- 10.U.S. Department of Health and Human Services; Food and Drug Administration. 21 CFR: Food and Drugs. Chapter I: Food and Drug Administration, Department of Health and Human Services. Subchapter B: Food for Human Consumption. Part 101: Food Labeling. Sect 101.65. [Google Scholar]
- 11.New York City Department of Health and Mental Hygiene. National Salt Reduction Initiative. [cited 2013 May 30]. Available from: http://www.nyc.gov/html/doh/html/diseases/salt.shtml.
- 12.Walmart. Walmart launches major initiative to make food healthier and healthier food more affordable. 2011 [cited 2013 Jun 24]. Available from: http://news.walmart.com/news-archive/2011/01/20/walmart-launches-major-initiative-to-make-food-healthier-healthier-food-more-affordable.
- 13.Progressive Grocer. Kraft Sodium Reduction on Track. 2012 Sep 25; [cited 2013 March15]. Available from: http://www.progressivegrocer.com/industry-news-trends/national-supermarket-chains/kraft-sodium-reduction-track.
- 14.General Mills. Global responsibility 2012: summary [cited 2013 Jun 13] Available from: http://www.generalmills.com/~/media/Files/CSR/global_resp_summary_2012.ashx.
- 15.USDA. National Nutrient Database for Standard Reference: release 26 [Internet] 2014 [cited 2013 Jun 13]. Available from: http://www.ars.usda.gov/Services/docs.htm?docid=8964.
- 16.USDA. Food and Nutrient Database for Dietary Studies [Internet] 2013 [cited 2013 May 15] Available from: http://www.ars.usda.gov/services/docs.htm?docID=12089.
- 17.CDC; National Center for Health Statistics. National Health and Nutrition Examination Survey. 2014 [cited 2013 Jun 6]. Available from: http://www.cdc.gov/nchs/nhanes/nhanes_questionnaires.htm.
- 18.Ng SW, Popkin BM. Monitoring foods and nutrients sold and consumed in the United States: dynamics and challenges. J Acad Nutr Diet. 2012;112:41–5. doi: 10.1016/j.jada.2011.09.015. [DOI] [PMC free article] [PubMed] [Google Scholar]
- 19.CDC. Vital signs: food categories contributing the most to sodium consumption—United States, 2007–2008. MMWR Morb Mortal Wkly Rep. 2012;61:92–8. [PubMed] [Google Scholar]
- 20.The Nielsen Company [Internet] [cited 2013 Jan 29] Available from: http://www.nielsen.com/us/en.html.
- 21.Gladson LLC [Internet] [cited 2013 Jan 29] Available from: http://www.gladson.com/
- 22.Britten P, Cleveland LE, Koegel KL, Kuczynski KJ, Nickols-Richardson SM. Updated US Department of Agriculture food patterns meet goals of the 2010 Dietary Guidelines. J Acad Nutr Diet. 2012;112:1648–55. doi: 10.1016/j.jand.2012.05.021. [DOI] [PubMed] [Google Scholar]
- 23.U.S. Department of Health and Human Services; Food and Drug Administration. 21 CFR: Food and Drugs. Chapter I: Food and Drug Administration, Department of Health and Human Services. Subchapter B: Food for Human Consumption. Part 101: Food Labeling. Sect 101.12. [Google Scholar]
- 24.Havas S, Dickinson BD, Wilson M. The urgent need to reduce sodium consumption. JAMA. 2007;298:1439–41. doi: 10.1001/jama.298.12.1439. [DOI] [PubMed] [Google Scholar]
- 25.Dunford EK, Eyles H, Mhurchu CN, Webster JL, Neal BC. Changes in the sodium content of bread in Australia and New Zealand between 2007 and 2010: implications for policy. Med J Aust. 2011;195:346–9. doi: 10.5694/mja11.10673. [DOI] [PubMed] [Google Scholar]
- 26.Woodward E, Eyles H, Mhurchu CN. Key opportunities for sodium reduction in New Zealand processed foods. Aust N Z J Public Health. 2012;36:84–9. doi: 10.1111/j.1753-6405.2012.00829.x. [DOI] [PubMed] [Google Scholar]
- 27.Ni Mhurchu C, Capelin C, Dunford EK, Webster JL, Neal BC, Jebb SA. Sodium content of processed foods in the United Kingdom: analysis of 44,000 foods purchased by 21,000 households. Am J Clin Nutr. 2011;93:594–600. doi: 10.3945/ajcn.110.004481. [DOI] [PMC free article] [PubMed] [Google Scholar]
- 28.Webster JL, Dunford EK, Neal BC. A systematic survey of the sodium contents of processed foods. Am J Clin Nutr. 2010;91:413–20. doi: 10.3945/ajcn.2009.28688. [DOI] [PubMed] [Google Scholar]
- 29.U.S. Department of Health and Human Services; Food and Drug Administration. 21 CFR: Food and Drugs. Chapter I: Food and Drug Administration, Department of Health and Human Services. Subchapter B: Food for Human Consumption. Part 101: Food Labeling. Sect 101.9. [Google Scholar]
- 30.Beatty TKM, Senauer B. The new normal? US food expenditure patterns and the changing structure of food retailing. Am J Agric Econ. 2013;95:318–24. [Google Scholar]
- 31.Todd JE, Mancino L, Leibtag E, Tripido C. Methodology behind the quarterly food-at-home price database. Washington, DC: Economic Research Service; USDA; 2010. [Google Scholar]
- 32.Walmart. Making healthier food a reality for all 2011 [cited 2013 May 16] Available from: http://corporate.walmart.com/global-responsibility/hunger-nutrition/our-commitments.
- 33.Slining MM, Ng SW, Popkin BM. Food companies’ calorie-reduction pledges to improve U.S. diet. Am J Prev Med. 2013;44:174–84. doi: 10.1016/j.amepre.2012.09.064. [DOI] [PMC free article] [PubMed] [Google Scholar]
- 34.Health Canada, Bureau of Nutritional Sciences. Guidance for the food industry on reducing sodium in processed foods. 2012 [cited 2013 Jan 30]. Available from: http://www.hc-sc.gc.ca/fn-an/legislation/guide-ld/2012-sodium-reduction-indust-eng.php.
- 35.Wyness LA, Butriss JL, Stanner SA. Reducing the population’s sodium intake: the UK Food Standard Agency’s salt reduction program. Public Health Nutr. 2012;15:254–61. doi: 10.1017/S1368980011000966. [DOI] [PubMed] [Google Scholar]