

Abstract
The commitment of stem and progenitor cells toward specific hematopoietic lineages is tightly controlled by a number of transcription factors that regulate differentiation programs via the expression of lineage restricting genes. Nuclear factor one (NFI) transcription factors are important in regulating hematopoiesis and here we report an important physiological role of NFIX in B- and myeloid lineage commitment and differentiation. We demonstrate that NFIX acts as a regulator of lineage specification in the haematopoietic system and the expression of Nfix was transcriptionally downregulated as B cells commit and differentiate, whilst maintained in myeloid progenitor cells. Ectopic Nfix expression in vivo blocked early B cell development stage, coincident with the stage of its downregulation. Furthermore, loss of Nfix resulted in the perturbation of myeloid and lymphoid cell differentiation, and a skewing of gene expression involved in lineage fate determination. Nfix was able to promote myeloid differentiation of total bone marrow cells under B cell specific culture conditions but not when expressed in the hematopoietic stem cell (HSPC), consistent with its role in HSPC survival. The lineage choice determined by Nfix correlated with transcriptional changes in a number of genes, such as E2A, C/EBP, and Id genes. These data highlight a novel and critical role for NFIX transcription factor in hematopoiesis and in lineage specification.
Introduction
Hematopoietic stem cells (HSCs) give rise to lineage restricted progenitor cells of the myeloid, lymphoid, and erythroid lineages through a series of commitment steps orchestrated by the expression of lineage restricting genes [1]. The nuclear factor one (NFI) protein family, also known as NF-I and CTF (CAAT box transcription factor), act as transcriptional activators and/or repressors of cellular and viral genes. In vertebrates, there are four closely related genes named NFIA, NFIB, NFIC, and NFIX [2]. They encode for proteins with a conserved N-terminal DNA-binding and dimerization domain and a C-terminal transactivation/repression domain, which exhibit a high variability due to extensive alternative splicing. NFI protein family members act as homo- and heterodimers and bind with high affinity to the palindromic consensus sequence 5′-PyTGGCA-N3-TGCCAPu-3′. NFI binding motifs were detected in promoters of genes expressed in different organs, including brain, lung, liver, intestine, muscle, connective tissue, skeletal elements and hematopoiesis. Thus, NFI genes have distinct functions depending on the cell type and target promoter context [2].
Recently Nfia was shown to regulate fate choice between erythrocytes and granulocytes in CD34+ human hematopoietic cell specification [3]. Its expression was abrogated to allow terminal granulocytic or monocytic differentiation via microRNA-223 and microRNA-424 respectively and C/EBPalpha and PU.1 interactions [4,5] indicating that Nfia silencing is a prerequisite for myelopoiesis. Furthermore, a transcriptome-wide approach revealed that Nfia induces an eythroid transcriptional program in both CD34+ and leukaemic K562 cells [6]. Nfix knockout mice die postnatally around p21 and have brain, intestine, and skeleton malformations [7,8] and Nfix deficient HSPCs fail to persist in long-term bone marrow engraftment upon transplantation [9]. Recently Nfix was shown to be one of 36 regulatory factors with relatively restricted expression in HSCs, that contributed towards converting a committed B cell to a myeloid cell [10]. These data indicate that Nfi proteins may act as putative drivers of lineage specification and perturbation.
In haematopoeitic cell maturation there are a number of transcription factors whose coordinated action are responsible for lineage specification and differentiation. For example, Pax5 can transcriptionally activate a B cell program while directly suppressing alternate lineage specific genes (e.g. myeloid-erythroid and T) [11]. Pax5-/-, E2A-/-, EBF and FOXO1 mice have arrested B cell development at the pro-B cell stage [12–15]. Indeed E2A-/- mice have reduced HSCs with an increased proportion of cycling HSC and it was shown that E2A functions to promote the developmental progression of the entire spectrum of early hematopoietic progenitors [16,17]. Amongst other transcription factors known to play a role in myeloid and B lineage fate, PU.1 and C/EBPalpha are critical. High levels of PU.1 enforce myeloid development while low levels promote B cell differentiation [18]. In myeloid development, C/EBPalpha has a critical role in the commitment of mulitpotent progenitors into the myeloid lineage and knockout mice have a block in the transition from common myeloid progenitors (CMP) to granulocyte-macrophage progenitors (GMP) [19].
Here, we investigated the function of Nfix during hematopoietic differentiation and our data support the role of Nfix as a regulator of lineage fate in the hematopoietic system. Nfix modulated the differentiation of B cells and myeloid cells, effects that were seen in both overexpression and knockout systems. Nfix is transcriptionally downregulated as B cells differentiate whereas its expression is maintained in myeloid progenitor cells. Loss of Nfix expression perturbs myelopoiesis and enhances B lymphopoiesis. Nfix-mediated lineage determination was associated with transcriptional changes in a number of myeloid and lymphoid lineage specific genes. These data highlight a novel role for Nfix transcription factor in hematopoietic cell fate.
Methods
Animals
All experiments were approved and performed in accordance with local and home office regulations and the Experimental Animal Ethics Committees of University College Cork (B100/4097) and University of Glasgow (60/4512). Nfix -/- mice and litter matched WT controls were a gift from Richard Gronostajski.
Bioinformatic Analyses
Expression profiles of the B-cell progenitors (GSE11110) [20] and for the human hematopoietic stem and progenitor cells, terminally differentiated cells, and intermediate state cells (GSE24759)[21] were downloaded from the Gene Expression Omnibus (http://www.ncbi.nlm.nih.gov/geo/). Using GenePattern (Version3.3.3) the Affymetrix CEL files for the B-cell progenitors were converted into a. gct file for analyses using the RMA method with quantile normalisation and background correct. Analyses of these datasets were carried out using GenePattern (Version3.3.3) and GraphPad Prism 5. GSEA was carried out using the GSEA program suite (version 2.07) available from the Broad Institute (http://www.broadinstitute.org/gsea/index.jsp) with gene sets obtained from the Molecular Signatures Database (MSigDB) (version 3.0.).
Bone Marrow Transplant (BMT)
BMT experiments were performed as described previously. Briefly, 5FU (5mg) was administered intravenously to 6–8wk old C57Bl/6 wild type mice (WT). 4 days later whole BM was isolated, prestimulated overnight and retrovirally transduced ex vivo in the presence of IL-3 (10ng/ul), IL-6 (10ng/ul), and SCF (100ng/ul). Two 90 minute spinoculations were performed 24hours apart. 4 hours after the second spinoculation, 0.2–1x10⁶ unsorted cells were transplanted into lethally-irradiated C57Bl/6 recipients and maintained on antibiotics for 2 wks post-transplant. Engraftment was assessed by GFP expression in the peripheral blood 6 wks post-BMT.
Cell Lines
32Dcl3 myeloid precursor cells and BA/F3 pro B cell lines [22] are both murine IL3-dependent cell lines maintained in RPMI, 10% FBS, 1% Penicillin/Streptomycin and 1% L-Glutamine supplemented with 10% WEHI conditioned media. OP9 stromal cells were kindly provided by J.C. Zuniga-Pflucker [23] were maintained in αMEM, 20% FBS, 1% Penicillin/Streptomycin, 1% L-Glutamine, 0.1% β-mercaptoethanol, 1% 100 mM sodium pyruvate and 1% HEPES (OP9 media).
Constructs and retroviruses
A 1203 bp fragment encoding the entire murine Nfix cDNA was subcloned (+/- N or C terminus MYC tag) into pcDNA3.1/myc-HIS plasmid and MigR1 expressing GFP retrovirus.
Flow Cytometry and Cell Sorting
Cell suspensions were stained on ice after blocking with rat/mouse IgG in PBS/2% FBS. Cells were sorted using a FACSAria-I (BDBiosciences) cell sorter. Analytical flow cytometry was performed on a LSRII or BDFACs Canto II (BDBiosciences) and analyzed using FlowJo software (Treestar). Cells were live gated using FSC/SSC, and single cells were analysed via FSC-H/FSC-A gating. Stem and progenitor populations are described in S1 Table. All antibodies used were obtained from eBioscience and are listed in S2 Table.
Methylcellulose clonogenic assays
For total BM colony assays, BM cells were isolated from a C57Bl/6 mouse, and retrovirally-transduced with MigR1 and Nfix ex vivo in the presence of IL-3, IL-6, and SCF. Then, 20,000 GFP+ sorted cells were plated in triplicate in methylcellulose media (Methocult M3434; StemCell Technologies). For sorted populations total adult BM or FL cells from E14.5 mice were isolated and sorted for HSPCs, LMPPs, CMPs, GMPs and CLPs and transduced with MigR1 or Nfix then 24 hr later were plated at 5000 (HSPC), 25,000 (LMPP), 40,000 (CMP), 60,000 (GMP) or 12,000 (CLP) in methylcellulose media. Colonies with >50 cells were scored and assessed at 12–14 d.
OP9 cultures
FL was isolated from E14.5 C57Bl/6 embryos and a cell suspension was prepared. Cells were incubated overnight in OP9 media supplemented with 20 ng/ml mSCF, 10 ng/ml IL6 and 10 ng/ml IL3. Cells were then retrovirally-transduced with MigR1 or Nfix retrovirus. 24 hr post-transduction these cells were either sorted for HSPCs and pro-B cells or plated without sorting onto OP9 cells in complete MEM media supplemented with 5 ng/ml Flt3 and 1 ng/ml IL7. Media was refreshed every 2 d and cells were replated to fresh OP9 cells every 4 d for 12–16 d, at which point the cells were removed and stained in PBS with PerCPCy5.5-anti-B220, APC-anti-CD19, AlexaFluor700-anti-CD11b, eFluor450-anti-Gr-1, biotinylated anti-CD45 (to exclude OP9 cells) with streptavidin-PeCy7 secondary antibody. Cells were acquired on a LSRII or BDFACS CantoII and analysed using FlowJo V7.6.5.
Quantitative RT-PCR
RNA was isolated from 32D and BA/F3 cells (transduced with control MigR1 or Nfix retrovirus and sorted for GFP), and BM cells, using the RNEasy kit (Qiagen), then digested with DNaseI and used for reverse transcription according to the manufacturer’s instructions (Superscript II kit, Invitrogen). RT-PCR was performed on the ABI Prism 7900 sequence detection system (Applied Biosystems). The ∆∆CT method was used to calculate the relative level of gene expression in each sample. High-throughput qPCR was performed on the 48.48 Dynamic Array IFC system (Fluidigm). Primer sequences are listed in S3 Table. Specific target pre-amplification was carried out. All reactions were carried out in triplicate. Expression levels of the target genes were normalized relative to the mean of the reference genes ABL, GUSB, B2M and either TBP and HPRT1, or ENOX2 and RNF20. Relative mRNA levels were calculated using the 2 -∆∆CT method.
Results
Altered hematopoiesis in Nfix chimeric mice
To investigate a role for Nfix in haematopoietic cells, lethally-irradiated C57BL/6 mice were reconstituted with retroviral control (MigR1) or Nfix expressing (MigR1-Nfix) vector transduced hematopoietic progenitors. At 6–10 wk post bone marrow transplant (BMT), reconstitution within the myeloid, B and T cell compartments was assessed in peripheral blood (PB). The percentage of both B220+ and CD19+ B cells was significantly reduced in the GFP+ population of Nfix mice compared to MigR1 (Fig. 1A and B) whereas there was no change in the PB CD4+ and CD8+ T cell compartment (Fig. 1C). The reduction noted in the percentage of the B cell compartment was complemented by a significant increase in the percentage of GFP+Gr-1+CD11b+ myeloid cells in the periphery of Nfix chimeric mice (Fig. 1A and B). These data suggest that enforced expression of Nfix results in the perturbation of peripheral myeloid and B cell populations. A more pronounced effect was evident in the BM and spleen of Nfix chimeras (Fig. 2). The percentage of GFP+B220+CD19+ B cells was dramatically decreased in the BM and spleen, whereas the percentage of GFP+Gr-1+CD11b+ myeloid cells was significantly increased in the BM and spleen (Fig. 2A-C). Analysis of the GFP percentage in B cell and myeloid populations in the periphery, BM and spleen revealed that the block in B cell and increase in myeloid cells was likely due to the autonomous effect of Nfix expression in the cell and that the defective B lymphopoiesis was not due to the myeloid hyperplasia (data not shown).
Fig 1. Decreased B cells and increased myeloid cells in Nfix expressing cells in the periphery.

C57Bl/6 mice were reconstituted with BM cells transduced with control MigR1 or Nfix vectors. (A) Graph of percentage number of GFP+ B cells (B220+, CD19+), myeloid cells (Gr-1+CD11b+), and (C) T cells (CD4+, CD8+) in the PB of MigR1 and Nfix chimeric animals 6 weeks post-transplant. (B) Representative flow cytometric analysis of PB cells in MigR1 and Nfix chimeric animals, 10 wk post-transplant, showing engraftment of GFP (left panel), B220+CD19+ B cells in the GFP- and GFP+ fractions (middle panel, percentages given) and the Gr-1+CD11b+ myeloid cells in the GFP- and GFP+ fractions (right panels, percentages given). Results are representative of 2 independent BMT experiments.
Fig 2. Decreased B cells and increased myeloid cells in Nfix expressing cells in the bone marrow and spleen.

C57Bl/6 mice were reconstituted with BM cells transduced with control MigR1 or Nfix vectors. Graph of percentage of B cells (left, B220+CD19+) and myeloid cells (right, Gr-1+CD11b+) in the (A) BM and (B) Spleen of MigR1 and Nfix chimeric animals (GFP+) 10 wks post-transplant. Representative flow cytometric analysis in MigR1 and NFIX chimeric animals, 10 wk post transplant, showing GFP engraftment (left panel), B220+CD19+ B cells (middle panel, percentages given) and Gr-1+CD11b+ myeloid cells (right panel) in the GFP- and GFP+ fractions of the bone marrow (C) and spleen (D). Results are representative of 2 independent BMT experiments.
Nfix expression decreases during B cell development
As we saw a block in the development of B220+CD19+ B cells in the BM, spleen and PB, we sought to determine the endogenous expression of Nfix during B lymphopoiesis. We analysed the publically available microarray dataset of mouse B cell lineage populations accessed through the GEO database [20]. This dataset included hCD25- and hCD25+ CLP (Lin-B220-CD19-CD127+Flt3+Sca1lowKitlow)(hCD25 under the control of the B-lineage restricted Igll1 promoter), pro-B (CD19+AA4.1+CD43low), pre-B (CD19+B220+CD43-IgM-) and mature spleen (IgM+CD19+) B cells. Endogenous Nfix expression was dramatically reduced at the pro-B cell stage of B lymphopoiseis compared to the CLP populations, and further decreased as the B cells differentiate to pre-B and mature spleen B cells (Fig. 3A). We next performed qRT-PCR on B cell progenitor fractions sorted from WT C57Bl/6 mice. Nfix mRNA expression was assessed in pre-pro B (B220+CD43+CD19-), pro-B (B220+CD43+CD19+), pre-B (B220+CD43-CD19+IgM-), and immature B (B220+CD43-CD19+IgM+). Consistent with the microarray analysis, Nfix expression decreased after the pre-pro-B cell stage and continued to decrease to the immature B cell stage (Fig. 3B). As a control, gene expression analysis of lineage specific transcription factors in the microarray dataset and in mRNA from sorted murine populations revealed consistent results (S1 Fig.). We next assessed whether this pattern of NFIX expression was evident in human B cell subsets. Using the microarray dataset from human cell compartments accessed through the GEO database [21] we assessed NFIX expression in the HSC2 (Lin-CD38-CD34+), early B-cell (CD34+CD10+CD19+) and pro-B cell (CD34-CD10+CD19+) compartments. There was a decrease in NFIX expression from the HSC2 compartment of human cells to the pro-B cell compartment (Fig. 3C). Nfix mRNA expression was further assessed in HSPC through to myeloid progenitor populations (HSPC (Lin-cKit+Scat1+Flt3-), LMPP (Lin-cKit+Scat1+Flt3+), CMP (Lin-cKit-CD34intCD16/32int), GMP (Lin-cKit-CD34+CD16/32+) and MEP (Lin-cKit-CD34loCD16/32lo)). Nfix expression was not downregulated in myeloid restricted progenitor populations (Fig. 3D). We observed similarities in NFIX expression using HemaExplorer platform (data not shown) [24]. These data show that NFIX expression decreased during both murine and human B cell lineage differentiation. To further support this, a detailed B cell development flow cytometric analyses was performed in Nfix chimeras in vivo. Consistent with our bioinformatics analyses showing a decrease in Nfix expression at the early stages of B cell stage of development, we saw an accumulation of the early B cell marker CD43 (which is normally turned off at the pre-B cell stage) and B220loCD43+ cells, and a concomitant decrease in the percentage of B220hi and CD43- B cells in Nfix chimeric animals as compared to MigR1 controls (Fig. 3E and F). These data demonstrate that ectopic expression of Nfix resulted in a block in early B-cell development in vivo, consistent with the stage when endogenous Nfix is downregulated.
Fig 3. Nfix expression in stem and progenitor populations.

(A) Analysis of Nfix expression during murine B cell differentiation using the B-cell lineage microarray dataset (GSE11110)[41]. Error bars represent max and min Nfix expression values. (B) Quantitative RT-PCR analysis of Nfix expression in murine B cell populations fractionated by flow cytometry. Data are representative of three independent experiments, performed in duplicate. Error bars denote ±SD. (C) Analysis of NFIX expression in human B cell development from the human hematopoiesis microarray dataset (GSE24759) (21). Plots represent raw values, error bars represent max and min values. (D) Analysis of Nfix expression by qRT-PCR in murine stem and progenitor cells isolated from bone marrow. (E) Graph of percentage expression of CD43+, B220+, and B220loCD43+ populations in BM cells from chimeras established with MigR1 or Nfix progenitors 8–10 wks previously. Error bars denote +/- SD of 2 independent experiments (n = 3). (F) Representative flow cytometric analysis, with gates and percentages showing B220loCD43+ populations (early B cells) in GFP- and GFP+ populations.
Nfix expression favors myelopoiesis over B cell lymphopoiesis
To further investigate the block in B cell and increase in myeloid cell development we observed in vivo, we carried out in vitro differentiation assays using the BM stromal OP9 cell line that supports B and myeloid cell development depending on the cytokines used. Unsorted E14.5 fetal liver (FL) cells were retrovirally transduced with MigR1 or MigR1-Nfix and cultured on OP9 cells supplemented with 5 ng/ml FLT3 and 1 ng/ml IL7 to support B cell development. MigR1 expressing control FL cells robustly developed B cells after 16 days co-culture whereas in contrast, Nfix expressing FL cells were unable to develop B220+CD19+ B cells. Furthermore, Nfix expressing FL cells efficiently differentiated into CD11b+Gr-1+ myeloid cells in this system, despite being in the presence of B cell permissive cytokines (Fig. 4A and B). GFP percentages throughout the culture revealed that as B cells differentiate in this culture, the GFP percentage declines (S2A Fig.). To determine whether Nfix expression could drive myelopoiesis and block B lymphopoiesis from HSPCs (Lin-Sca1+cKit+Flt3-), we retrovirally transduced purified FL-HSPC with MigR1 and Nfix and cultured on OP9 cells supplemented with 5 ng/ml FLT3 and 1 ng/ml IL7. Nfix overexpression in purified HSPCs abrogates B cell development in this OP9 culture system (Fig. 4C and D, S2B Fig.). Nfix overexpression is however not toxic to committed pro B cells, as BA/F3 cells overexpressing Nfix do not have any evidence of altered cell growth, proliferation or apoptosis (S2C–G Fig.). To assess the molecular changes involved in the perturbation of lineage specificity in Nfix expressing cells, we carried out gene expression analysis on a number of lineage specific targets (Fig. 4E and S3 Table). It has been proposed that upregulation of ID genes and subsequent E-protein inhibition are involved in myeloid lineage commitment while shutting off the lymphoid fate as cells transit from the LMPP compartment [25]. Our analysis showed that ectopic Nfix expression in BM cells led to significant decrease in E2A, and concomitant increase in ID2 and ID3 (Fig. 4C). These gene expression changes correlate with the Nfix-mediated lineage perturbations in vitro and in vivo.
Fig 4. Nfix blocks B cell differentiation in vitro in favour of myelopoiesis.
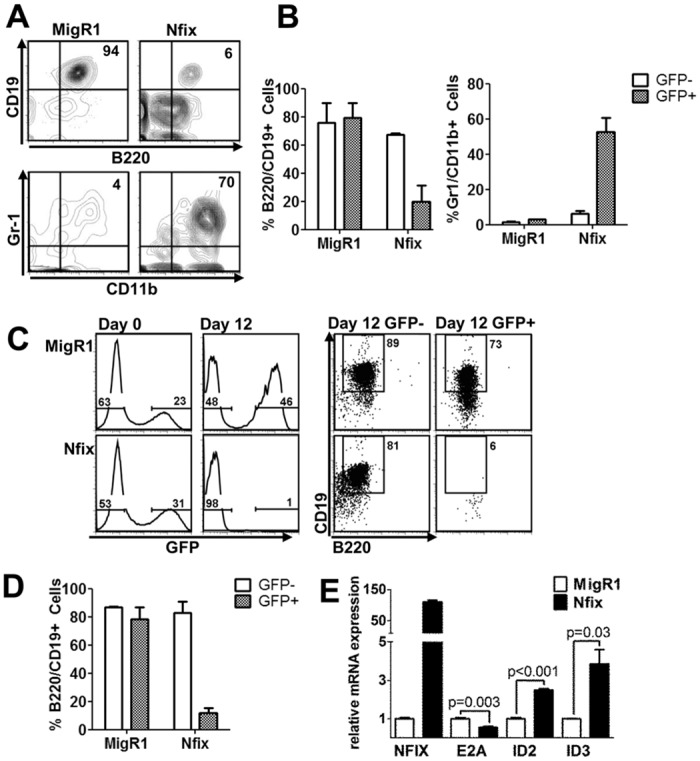
(A) Total FL was transduced with control MigR1 or Nfix, plated on OP9 cells and analyzed by flow cytometry on day 16. FACS plots of GFP+ B cells (B220+CD19+, top panels) and GFP+ myeloid cells (CD11b+Gr-1+, lower panels) representative of 3 replicates from 2 independent experiments. (B) Graph of average percentage of B220+CD19+ (left) and CD11b+Gr-1+ (right) from (A). Error bars denote +/- SD of 2 independent experiments (n = 3). Graph shows a statistically significant decrease in Nfix derived B220+CD19+ cells (p = 0.02) and a significant increase in Nfix derived CD11b+Gr-1+ cells (p = 0.01) when compared with MigR1 controls. (C) E14.5 FL HSPCs (Lin-Sca1+cKit+Flt3-) transduced with control MigR1 or Nfix retrovirus were plated on OP9 cells (Day 0) and analysed by flow cytometry on day 12 with FACs plots of GFP expression (left histograms) and GFP- and GFP+ B220+CD19+ cells (right dot plots) representative of 2 independent experiments. (D) Graph of average percentage of B220+CD19+ cells from (C), error bars denote +/- SD of 2 independent experiments. Experiment shows significant decrease in Nfix expressing B cells compared with control MigR1 (p = 0.01) (E) Total BM cells were sorted for MigR1 and Nfix expression 24 hr post transduction and qRT-PCR was performed. Graphical presentation of relative mRNA expression of Nfix, E2A, ID2 and ID3 genes and presented relative to control MigR1 cells. Error bars denote +/- SD of 3 technical replicates. Data representative of 2 biological replicates.
Myeloid differentiation was further investigated by plating MigR1 and Nfix expressing total BM cells, and purified HSPCs, CMP and GMP populations (immunophenotype markers in supplementary methods) in methylcellulose media that supports optimal growth of erythroid progenitors (BFU-E), granulocyte-macrophage progenitors (CFU-GM, CFU-M, CFU-G) and multi-potential granulocyte, erythroid, macrophage, megakaryocyte progenitors (CFU-GEMM) cells (M3434 methocult). Nfix overexpression in bulk BM cells did not change total colony number or the number of cells per colony type. However there is a clear trend towards lower numbers of immature NFIX derived colonies compared with MigR1 (CFU-E and CFU-GEMM) with a concomitant increase in more mature myeloid colonies (CFU-GM and CFU-G) (Fig. 5A). This was evident by an increase in CD11b and F4/80 marker expression detected by flow cytometry (Fig. 5B). In HSPCs, there was no significant difference in the number of colonies derived from Nfix expressing HSPCs when compared with control, however, there was a significant decrease in the number of colonies formed from CMP and GMP cells expressing Nfix (Fig. 5C). Flow cytometric analysis of the colonies following 12–14 days in culture revealed a pronounced increase in the number of CD11b+ and F4/80+ cells (markers of mature myeloid cells) in CMP and GMP colonies when compared with control (Fig. 5D). The decrease in colony number and in increase CD11b+ and F4/80+ indicate that Nfix drives mature myeloid differentiation and these effects are pronounced at the CMP stage of development. To further support the role of Nfix in myeloid lineage differentiation, we expressed Nfix in the IL-3 dependent 32D myeloid cell line and assessed the effect on myeloid cell surface differentiation markers. There was a statistically significant increase in myeloid differentiation as assessed by the expression of F4/80 in the presence of IL3 alone upon Nfix expression, which was further enhanced in the presence of the myeloid-permissive cytokine G-CSF (Fig. 5E and F). Gene expression analysis of 32D and BA/F3 sorted for Nfix expression revealed that Nfix significantly increased the expression of the myeloid specific genes C/EBPalpha and target gene GCSF-R and MMP9 (Fig. 5G and H). These data strongly suggest that ectopic expression of Nfix in vitro and in vivo biases hematopoietic progenitors to the myeloid lineage and suppresses lymphoid development.
Fig 5. Efficient differentiation of myeloid cells in Nfix expressing cells.
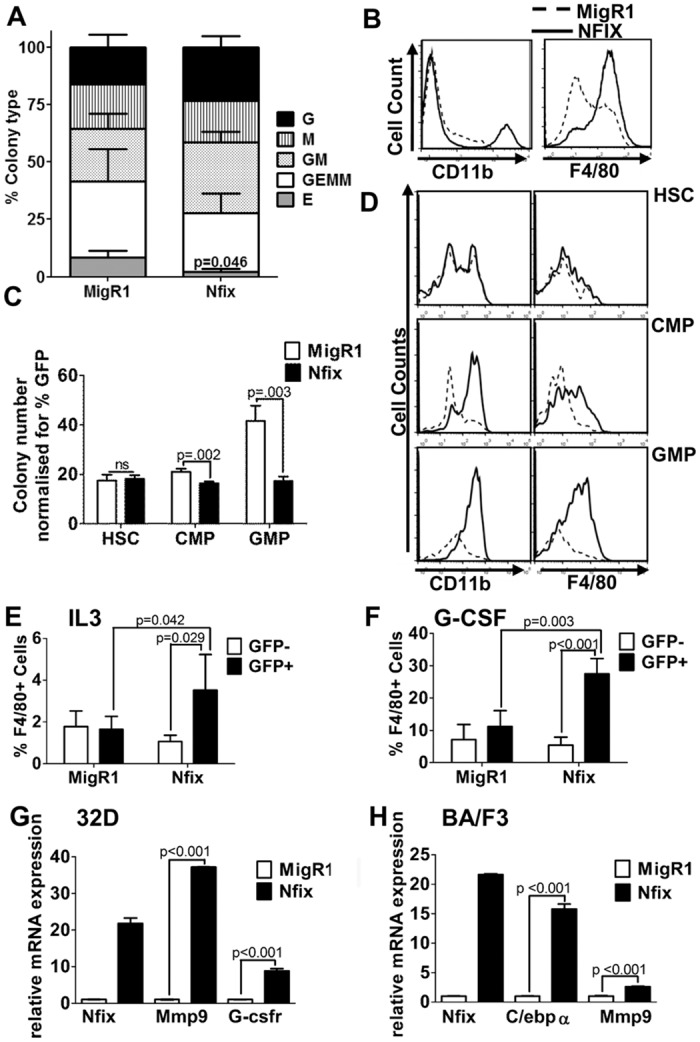
(A) MigR1 and Nfix transduced total BM cells were plated in methylcellulose media (M3434) and colonies scored after 9–11 days according to morphological criteria. The mean percentage of erythroid (E), granulocyte/erythrocyte/monocyte/megakaryocyte (GEMM), granulocyte/monocyte (GM) macrophage (M) and granulocyte (G) colonies are shown from 3 independent experiments +/- SEM. A statistically significant decrease in CFU-EE colonies indicated. (B) Representative flow cytometric analysis of total cells from colony assay in (A). (C) Graph of methylcellulose colony numbers from HSPCs, CMPs and GMPs sorted and transduced with control MigR1 or Nfix. Colonies were counted on day 12 and graph represents mean of triplicate plates normalized to GFP expression +/- SD. (D) Representative flow cytometric analysis of cells from colony assay in (C). 32D cells transduced with MigR1 or Nfix maintained in either IL3 (E) or G-CSF (F) for 5 days, and analyzed for F4/80 expression by flow cytometry. The mean percentages of 3 independent experiments are shown +/- SD. (G) 32D cells and (H) Ba/F3 cells transduced with MigR1 and Nfix and qRT-PCR performed. Graphical presentation of relative mRNA expression of Nfix, MMP9, G-CSFr and C/EBPalpha genes and presented relative to control MigR1 cells. Error bars denote +/- SD of 3 technical replicates. Data representative of 2 biological replicates.
Loss of Nfix expression promotes B lymphopoiesis while impairing myelopoiesis
To investigate the physiological relevance of Nfix in myeloid and lymphoid lineage specification, we isolated BM from Nfix -/- neonate mice and cultured it on OP9 cells. There was a marked increase in cells expressing B220 after 4 and 6 days in culture compared with WT littermate control cells (Fig. 6A-C). Myeloid differentiation of Nfix deficient cells was assessed in methylcellulose colony assays. Nfix deficient BM cells formed significantly fewer colonies than their WT counterparts (Fig. 6D), and expressed significantly lower percentages of mature myeloid markers CD11b, Gr1 and F4/80 (Fig. 6D-F). These data indicate that loss of Nfix perturbs normal myeloid differentiation. Gene expression analysis by qRT-PCR reveals that Nfix deficient BM cells have a marked disruption in the expression of key transcription factors involved in lineage fate determination (Fig. 6G). Of particular interest is the downregulation of Id genes and MMP9 (the inverse of our overexpression data), and an upregulation of CD19 and Pu.1 in Nfix deficient cells, supporting a role of Nfix in cell lineage fate. Taken together, these loss of function data show that loss of Nfix in the BM leads to altered hematopoiesis by enhancing B cell development while disrupting myelopoiesis, and that this effect is mediated by changes in key transcription factors associated with lineage fate determination.
Fig 6. Loss of Nfix perturbs myelopoiesis while driving B cell differentiation.

Total BM from WT or Nfix deficient mice was plated onto OP9 cells and analysed by flow cytometry on day 4 (A) and day 6 (B). Bar chart shows the mean percentages of B220+ cells from 3 independent experiments +/- SD. (C) Representative flow cytometric analysis of cells expressing B220 at day 6. (D) Total BM from WT or Nfix deficient mice was plated in methylcellulose (M3434). Colonies were counted after 11 days. Bar chart represents the mean number of colonies from 2 independent experiments +/- SD. (E) Bar chart shows the mean percentages of Gr1 + and F4/80+ cells from 2 independent experiments +/- SD. (F) Representative flow cytometric analysis of cells from colony assay which were stained with Gr-1 and F4/80. (G) Graphical presentation of relative mRNA expression of indicated genes assessed using high-throughput qPCR on the 48.48 Dynamic Array IFC system (Fluidigm). Bars represent the average of 3 biological Nfix-/- replicates normalized to WT control, and error bars denote +/- SD.
Discussion
We report an important role of the transcription factor Nfix in hematopoietic cell fate, specifically in B- and myeloid lineage differentiation. Our studies indicate that Nfix expression is downregulated as the cells become committed to the B cell lineage, and loss of Nfix expression enhances B cell lineage fate, concomitant with skewed myelopoiesis and altered expression of lineage fate genes. Enforced Nfix expression prevents early B cell development and favors myeloid differentiation in vitro and in vivo which correlates with an alteration in lineage-specific commitment genes of the B and myeloid lineages.
We noted higher Nfix mRNA expression in the early B cell progenitor populations in both mouse and human hematopoietic cells and downregulation of its expression as cells commit and mature to the B cell lineage. Our data shows that upon ectopic expression of Nfix in vivo, B cell development is severely impaired in the BM and spleen of chimeric animals. Although some CD19+B220+ B cells were still present in the spleen of Nfix chimeric animals, there was almost complete block in CD19+B220+ B cell production in the BM. These data suggest that upon continued expression of Nfix, B cell development in the BM is impaired. In accordance with the downregulation in Nfix mRNA expression to pro-B cell stage of differentiation, accumulation of B220loCD43+ early B cells in the BM of Nfix chimeric animals was observed. Additionally, using the in vitro OP9 co-culture system, enforced Nfix expression in the HSPC compartment led to an almost complete absence of Nfix expressing cells at the end of the culture period. The very small percentage of surviving Nfix expressing cells derived from HSPCs do not express CD19 yet do express B220lo consistent with the block at an early stage of development seen in vivo. Nfix surviving cells were observed when the transduced population included more myeloid committed progenitors even when cultured on OP9 cells in B cell cytokine conditions. In this case, Nfix expressing cells were of the myeloid lineage. The fact that this culture system contained no myeloid specific cytokines and generates an environment that efficiently produces B cells as seen by control cultures, provides strong evidence that Nfix has a functional role in lineage fate.
Transcriptional lineage priming of hematopoietic stem and progenitor cells has been shown to define their lineage potential [26]. The commitment of hematopoietic progenitors to the B cell lineage and their development to mature B cells depends on the combined activities of the transcription factors E2A, EBF, and Pax5 [27]. The earliest B cell progenitors express a lineage restricted marker B220, together with CD43 [28]. The progenitors are mostly B lineage committed, even in the absence of detectable CD19 surface expression (27) and PAX5 [29]. E proteins are well known to be crucial for lymphopoiesis [14] however recently it was shown that HSCs and LMPPs from E2A-/- mice show an increase in proliferation accompanied by efficient myeloid- but not lymphoid cell differentiation [16]. Indeed, E2A-deficient HSCs fail to maintain the HSC pool and the entire spectrum of early hematopoietic progenitors [17]. E-proteins are antagonized by the Id proteins, which contain an HLH motif but lack a DNA binding region [30]. Furthermore, it has been documented that the downregulation of both Id2 and Id3 is an essential event in B-lineage specification although the loss of either factor was not sufficient to promote B cell development [31]. We observed significant changes in E2A, Id2 and Id3 in Nfix-deficient cells and upon ectopic Nfix expression. This perturbation in the levels of E2A and Id gene expression are consistent with a block in B cell lineage commitment and differentiation and the efficient myeloid cell production observed. The modulation of Id expression can induce a reversal of B lineage commitment [32] and Id-mediated inhibition of E proteins was shown to be involved in myeloid lineage commitment [25] suggesting that the balance between Id and E proteins regulates myeloid-versus-lymphoid lineage decisions.
Cell fate decisions during hematopoiesis are governed by lineage-specific transcription factors e.g. PU.1 and C/EBP family members. PU.1 transcription factor has a well-documented central role controlling myeloid and early B and T-cell development and PU.1 expression levels are important in the determination of lineage fate [33,34]. Recently it was shown that PU.1 expression is regulated differentially in B cells and myeloid cells through differential association with cell-type specific transcription factors and a balance of sense and antisense RNAs at one of its upstream regulatory elements [35,36] and through cell cycle duration effects [37]. The modulation of PU.1 seen in Nfix-deficient cells is consistent with the role of PU.1 in myeloid versus B lineage cell fate. It has previously been shown that CEBPA loss-of-function mutations decrease myeloid priming of HSCs while simultaneously impairing myeloid-lineage commitment [38]. In addition, C/EBPs are known to be regulated by Runx1 [39] and to positively regulate PU.1 expression [40] in myeloid lineage fate choices. A recent study identified 36 factors that could reprogram a committed B cell into a myeloid cell and Nfix was one of these factors [10]. Our data show that alone, Nfix can modulate the fate of a stem and progenitor cell toward the B and myeloid lineage. Nfix can thus be hypothesized to act as a molecular switch involved in lineage instruction and commitment. Whether this occurs due to lineage priming in the stem cell compartment or due to antagonistic or synergistic activity in a committed progenitor cell is not yet known.
The data presented here indicate that the failure to downregulate Nfix would be detrimental to B cell production and favor myelopoiesis. Collectively, these data suggest that Nfix expression at early stages of development (HSPCs) can modulate the myeloid-versus-lymphoid divergent cell fate, potentially via the direct modulation of downstream transcriptional targets.
Supporting Information
(A) B-cell and myeloid cell gene expression in the B-cell progenitor microarray data. Max gene expression data was calculated for each B-cell progenitor population from the B-cell progenitor microarray dataset (GSE11110). Microarray data was collapsed to max probe expression for each gene using the Collapse Dataset suite in GenePattern. Values for each progenitor cell type were then plotted using GraphPad. Error bars represent max and min values for each cell type. (B) Quantitative RT-PCR analysis of B cell and myeloid cell specific gene expression in sorted murine B cell populations fractionated by flow cytometry. Relative levels of CEBPA, Il7R, NOTCH1, PAX5, SFPI1, EBF1, CD19 and BLNK expression in pre-pro, pro, pre and immature B cell populations. 18S was used as an endogenous control. Each gene/18s ratio in pre-pro B cell progenitors was normalized to 1.
(TIF)
(A) Tracking GFP expression in MigR1 and Nfix expressing total FLCs over 16 days in culture. Graph represents the average +/- SD of 2 independent experiments (3 technical replicates). (B) Graph of the average GFP expression in MigR1 and Nfix expressing FLC HSPCs after 0 and 12 days in OP9 co-culture. Error bars denote +/-SD of 2 biological replicates. (C) Tracking GFP expression in MigR1 and Nfix expressing BaF/3 cells over 5 days in culture, showing mean of 3 technical replicates +/- SD. Graph is representative of 2 independent experiments. (D) Graph of 5 days of cell growth of GFP sorted BaF/3 cells transduced with either MigR1 or Nfix. Each point represents the average number of cells from 2 independent experiments. Error bars denote +/- SD. (E) Tracking Baf/3 cell division after 5 days in culture as shown by dilution of Cell Trace Violet in GFP expressing cells. MigR1 and Nfix overexpressing cells are compared to unstained control and Day 0 cells as positive and negative controls respectively. Graph is representative of 2 independent experiments. (F) Representative FACs plot of the expression of apoptotic markers AnnexinV and DAPI in MigR1 or Nfix transduced, GFP sorted BaF/3 cells, 4 days after transduction. (G) Graph of the average percentage of GFP sorted BaF/3 cells expressing DAPI, AnnexinV and live cells (double negative for DAPI and AnnexinV), from 2 independent experiments. Error bars denote +/- SD.
(TIF)
(PDF)
(PDF)
(PDF)
Acknowledgments
We wish to thank technical staff at the Paul O’Gorman Leukaemia Research Centre and at the biological services at the University of Glasgow and University College Cork. We thank past members of the Keeshan lab for technical assistance. We thank Warren Pear (University of Pennsylvania) for technical assistance and critical reading of the manuscript.
Data Availability
All relevant data are within the paper and its Supporting Information files.
Funding Statement
The authors wish to thank the Kay Kendall foundation (KKL501), and the Howat foundation for Flow cytometry facility funding. KK was supported by funds from the Howat Foundation, Children with Cancer UK, Science Foundation Ireland PIYRA award and Marie Curie EU-FP7-PEOPLE-IRG. This work was also supported by Children's Leukaemia Research Project grant (CO) and an MRC project grant (MR/K014854/1; AMM). The funders had no role in study design, data collection and analysis, decision to publish, or preparation of the manuscript.
References
- 1. Busslinger M. Transcriptional Control of Early B Cell Development. Annu Rev Immunol. 2004; 22: 55–79. [DOI] [PubMed] [Google Scholar]
- 2. Gronostajski RM. Roles of the NFI/CTF gene family in transcription and development. Gene. 2000; 249; 31–45. [DOI] [PubMed] [Google Scholar]
- 3. Starnes LM, Sorrentino A, Pelosi E, Ballarino M, Morsilli O, Biffoni M, et al. NFI-A directs the fate of hematopoietic progenitors to the erythroid or granulocytic lineage and controls-globin and G-CSF receptor expression. Blood. 2009; 114: 1753–1763. 10.1182/blood-2008-12-196196 [DOI] [PubMed] [Google Scholar]
- 4. Fazi F, Rosa A, Fatica A, Gelmetti V, De Marchis ML, Nervi C, et al. A minicircuitry comprised of microRNA-223 and transcription factors NFI-A and C/EBPalpha regulates human granulopoiesis. Cell. 2005; 123: 819–831. [DOI] [PubMed] [Google Scholar]
- 5. Rosa A, Ballarino M, Sorrentino A, Sthandier O, De Angelis FG, Marchioni M, et al. The interplay between the master transcription factor PU.1 and miR-424 regulates human monocyte/macrophage differentiation. Proc Natl Acad Sci USA. 2007; 104: 19849–19854. [DOI] [PMC free article] [PubMed] [Google Scholar]
- 6. Starnes LM, Sorrentino A, Ferracin M, Negrini M, Pelosi E, Nervi C, et al. A transcriptome-wide approach reveals the key contribution of NFI-A in promoting erythroid differentiation of human CD34+ progenitors and CML cells. Leukemia. 2010; 24: 1220–1223. 10.1038/leu.2010.78 [DOI] [PubMed] [Google Scholar]
- 7. Driller K, Pagenstecher A, Uhl M, Omran H, Berlis A, Grunder A, et al. Nuclear factor I X deficiency causes brain malformation and severe skeletal defects. Molecular and Cellular Biology. 2007; 27: 3855–3867. [DOI] [PMC free article] [PubMed] [Google Scholar]
- 8. Campbell CE, Piper M, Plachez C, Yeh Y-T, Baizer JS, Osinski JM, et al. The transcription factor Nfix is essential for normal brain development. BMC Dev Biol. 2008; 8: 52 10.1186/1471-213X-8-52 [DOI] [PMC free article] [PubMed] [Google Scholar]
- 9. Holmfeldt P, Pardieck J, Saulsberry AC, Nandakumar SK, Finkelstein D, Gray JT, et al. Nfix is a novel regulator of murine hematopoietic stem and progenitor cell survival. Blood. 2013; [DOI] [PMC free article] [PubMed] [Google Scholar]
- 10. Riddell J, Gazit R, Garrison BS, Guo G, Saadatpour A, Mandal PK, et al. Reprogramming Committed Murine Blood Cells to Induced Hematopoietic Stem Cells with Defined Factors. Cell. 2014; 157: 549–564. 10.1016/j.cell.2014.04.006 [DOI] [PMC free article] [PubMed] [Google Scholar]
- 11. Cobaleda C, Schebesta A, Delogu A, Busslinger M. Pax5: the guardian of B cell identity and function. Nat Immunol. 2007; 8: 463–470. [DOI] [PubMed] [Google Scholar]
- 12. Dengler HS, Baracho GV, Omori SA, Bruckner S, Arden KC, Castrillion DH, et al. Distinct functions for the transcription factor Foxo1 at various stages of B cell differentiation. Nature Publishing Group. 2008; 9: 1388–1398. [DOI] [PMC free article] [PubMed] [Google Scholar]
- 13. Nutt SL, Heavey B, Rolink AG, Busslinger M. Commitment to the B-lymphoid lineage depends on the transcription factor Pax5. Nature. 1999; 401: 556–562. [DOI] [PubMed] [Google Scholar]
- 14. Bain G, Robanus Maandag EC, Riele te HP, Feeney AJ, Sheehy A, Schlissel M, et al. Both E12 and E47 allow commitment to the B cell lineage. Immunity. 1997; 6: 145–154. [DOI] [PubMed] [Google Scholar]
- 15. Lin H, Grosschedl R. Failure of B-cell differentiation in mice lacking the transcription factor EBF. Nature. 1995; 376: 263–267. [DOI] [PubMed] [Google Scholar]
- 16. Dias SS, Månsson RR, Gurbuxani SS, Sigvardsson MM, Kee BLB. E2A proteins promote development of lymphoid-primed multipotent progenitors. Immunity. 2008; 29: 217–227. 10.1016/j.immuni.2008.05.015 [DOI] [PMC free article] [PubMed] [Google Scholar]
- 17. Semerad CL, Mercer EM, Inlay MA, Weissman IL, Murre C. E2A proteins maintain the hematopoietic stem cell pool and promote the maturation of myelolymphoid and myeloerythroid progenitors. Proceedings of the National Academy of Sciences. 2009; 106: 1930–1935. [DOI] [PMC free article] [PubMed] [Google Scholar]
- 18. DeKoter RP, Singh H. Regulation of B lymphocyte and macrophage development by graded expression of PU.1. Science. 2000; 288: 1439–1441. [DOI] [PubMed] [Google Scholar]
- 19. Zhang P, Iwasaki-Arai J, Iwasaki H, Fenyus ML, Dayaram T, Owens BM, et al. Enhancement of hematopoietic stem cell repopulating capacity and self-renewal in the absence of the transcription factor C/EBP alpha. Immunity. 2004; 21: 853–863. [DOI] [PubMed] [Google Scholar]
- 20. Mansson R, Zandi S, Anderson K, Martensson IL, Jacobsen SEW, Bryder D, et al. B-lineage commitment prior to surface expression of B220 and CD19 on hematopoietic progenitor cells. Blood. 2008; 112: 1048–1055. 10.1182/blood-2007-11-125385 [DOI] [PubMed] [Google Scholar]
- 21. Novershtern N, Subramanian A, Lawton LN, Mak RH, Haining WN, McConkey ME, et al. Densely Interconnected Transcriptional Circuits Control Cell States in Human Hematopoiesis. Cell. 2011; 144: 296–309. 10.1016/j.cell.2011.01.004 [DOI] [PMC free article] [PubMed] [Google Scholar]
- 22. Keeshan K, Bailis W, Dedhia PH, Vega ME, Shestova O, Xu L, et al. Transformation by Tribbles homolog 2 (Trib2) requires both the Trib2 kinase domain and COP1 binding. Blood. 2010; 116: 4948–4957. 10.1182/blood-2009-10-247361 [DOI] [PMC free article] [PubMed] [Google Scholar]
- 23. Holmes R, Zuniga-Pflucker JC. The OP9-DL1 system: generation of T-lymphocytes from embryonic or hematopoietic stem cells in vitro. Cold Spring Harb Protoc. 2009: pdb.prot5156. [DOI] [PubMed] [Google Scholar]
- 24. Bagger FO, Rapin N, Theilgaard-Mönch K, Kaczkowski B, Jendholm J, Winther O, et al. HemaExplorer: a Web server for easy and fast visualization of gene expression in normal and malignant hematopoiesis. Blood. 2012; 119: 6394–6395. 10.1182/blood-2012-05-427310 [DOI] [PubMed] [Google Scholar]
- 25. Cochrane SW, Zhao Y, Welner RS, Sun X-H. Balance between Id and E proteins regulates myeloid-versus-lymphoid lineage decisions. Blood. 2009; 113: 1016–1026. 10.1182/blood-2008-06-164996 [DOI] [PMC free article] [PubMed] [Google Scholar]
- 26. Månsson R, Hultquist A, Luc S, Yang L, Anderson K, Kharazi S, et al. Molecular evidence for hierarchical transcriptional lineage priming in fetal and adult stem cells and multipotent progenitors. Immunity.2007; 26: 407–419. [DOI] [PubMed] [Google Scholar]
- 27. Singh H, Medina KL, Pongubala JMR. Contingent gene regulatory networks and B cell fate specification. Proc Natl Acad Sci USA. 2005; 102: 4949–4953. [DOI] [PMC free article] [PubMed] [Google Scholar]
- 28. Hardy RR, Carmack CE, Shinton SA, Kemp JD, Hayakawa K. Resolution and characterization of pro-B and pre-pro-B cell stages in normal mouse bone marrow. J Exp Med. 1991; 173: 1213–1225. [DOI] [PMC free article] [PubMed] [Google Scholar]
- 29. Pongubala JMR, Northrup DL, Lancki DW, Medina KL, Treiber T, Bertolino E, et al. Transcription factor EBF restricts alternative lineage options and promotes B cell fate commitment independently of Pax5. Nat Immunol. 2008; 9: 203–215. 10.1038/ni1555 [DOI] [PubMed] [Google Scholar]
- 30. Benezra R, Davis RL, Lockshon D, Turner DL, Weintraub H. The protein Id: a negative regulator of helix-loop-helix DNA binding proteins. Cell. 1990; 61: 49–59. [DOI] [PubMed] [Google Scholar]
- 31. Thal MA, Carvalho TL, He T, Kim H-G, Gao H, Hagman J, et al. Ebf1-mediated down-regulation of Id2 and Id3 is essential for specification of the B cell lineage. Proc Natl Acad Sci USA. 2009; 106: 552–557. 10.1073/pnas.0802550106 [DOI] [PMC free article] [PubMed] [Google Scholar]
- 32. Nakagawa R, Vukovic M, Cosimo E, Michie AM. Modulation of PKC-α promotes lineage reprogramming of committed B lymphocytes. Eur J Immunol. 2012; 42: 1005–1015. 10.1002/eji.201141442 [DOI] [PubMed] [Google Scholar]
- 33. Dahl R, Walsh JC, Lancki D, Laslo P, Iyer SR, Singh H, et al. Regulation of macrophage and neutrophil cell fates by the PU.1:C/EBPalpha ratio and granulocyte colony-stimulating factor. Nat Immunol. 2003; 4: 1029–1036. [DOI] [PubMed] [Google Scholar]
- 34. Rosenbauer F, Owens BM, Yu L, Tumang JR, Steidl U, Kutok JL, et al. Lymphoid cell growth and transformation are suppressed by a key regulatory element of the gene encoding PU.1. Nat Genet. 2006; 38: 27–37. [DOI] [PubMed] [Google Scholar]
- 35. Leddin MM, Perrod CC, Hoogenkamp MM, Ghani SS, Assi SS, Heinz SS, et al. Two distinct auto-regulatory loops operate at the PU.1 locus in B cells and myeloid cells. Blood. 2011; 117: 2827–2838. 10.1182/blood-2010-08-302976 [DOI] [PMC free article] [PubMed] [Google Scholar]
- 36. Ebralidze AK, Guibal FC, Steidl U, Zhang P, Lee S, Bartholdy B, et al. PU.1 expression is modulated by the balance of functional sense and antisense RNAs regulated by a shared cis-regulatory element. Genes & Development. 2008; 22: 2085–2092. [DOI] [PMC free article] [PubMed] [Google Scholar]
- 37. Kueh HY, Champhekar A, Nutt SL, Elowitz MB, Rothenberg EV. Positive feedback between PU.1 and the cell cycle controls myeloid differentiation. Science. 2013; 341: 670–673. 10.1126/science.1240831 [DOI] [PMC free article] [PubMed] [Google Scholar]
- 38. Bereshchenko O, Mancini E, Moore S, Bilbao D, Månsson R, Luc S, et al. Hematopoietic Stem Cell Expansion Precedes the Generation of Committed Myeloid Leukemia-Initiating Cells in C/EBPα Mutant AML. Cancer Cell. 2009; 16: 390–400. 10.1016/j.ccr.2009.09.036 [DOI] [PubMed] [Google Scholar]
- 39. Guo H, Ma O, Speck NA, Friedman AD. Runx1 deletion or dominant inhibition reduces Cebpa transcription via conserved promoter and distal enhancer sites to favor monopoiesis over granulopoiesis. Blood. 2012; 119: 4408–4418. 10.1182/blood-2011-12-397091 [DOI] [PMC free article] [PubMed] [Google Scholar]
- 40. Yeamans C, Wang D, Paz-Priel I, Torbett BE, Tenen DG, Friedman AD. C/EBPalpha binds and activates the PU.1 distal enhancer to induce monocyte lineage commitment. Blood. 2007; 110: 3136–3142. [DOI] [PMC free article] [PubMed] [Google Scholar]
- 41. Mansson R, Zandi S, Anderson K, Martensson IL, Jacobsen SEW, Bryder D et al. B-lineage commitment prior to surface expression of B220 and CD19 on hematopoietic progenitor cells. Blood. 2008; 112: 1048–1055. 10.1182/blood-2007-11-125385 [DOI] [PubMed] [Google Scholar]
Associated Data
This section collects any data citations, data availability statements, or supplementary materials included in this article.
Supplementary Materials
(A) B-cell and myeloid cell gene expression in the B-cell progenitor microarray data. Max gene expression data was calculated for each B-cell progenitor population from the B-cell progenitor microarray dataset (GSE11110). Microarray data was collapsed to max probe expression for each gene using the Collapse Dataset suite in GenePattern. Values for each progenitor cell type were then plotted using GraphPad. Error bars represent max and min values for each cell type. (B) Quantitative RT-PCR analysis of B cell and myeloid cell specific gene expression in sorted murine B cell populations fractionated by flow cytometry. Relative levels of CEBPA, Il7R, NOTCH1, PAX5, SFPI1, EBF1, CD19 and BLNK expression in pre-pro, pro, pre and immature B cell populations. 18S was used as an endogenous control. Each gene/18s ratio in pre-pro B cell progenitors was normalized to 1.
(TIF)
(A) Tracking GFP expression in MigR1 and Nfix expressing total FLCs over 16 days in culture. Graph represents the average +/- SD of 2 independent experiments (3 technical replicates). (B) Graph of the average GFP expression in MigR1 and Nfix expressing FLC HSPCs after 0 and 12 days in OP9 co-culture. Error bars denote +/-SD of 2 biological replicates. (C) Tracking GFP expression in MigR1 and Nfix expressing BaF/3 cells over 5 days in culture, showing mean of 3 technical replicates +/- SD. Graph is representative of 2 independent experiments. (D) Graph of 5 days of cell growth of GFP sorted BaF/3 cells transduced with either MigR1 or Nfix. Each point represents the average number of cells from 2 independent experiments. Error bars denote +/- SD. (E) Tracking Baf/3 cell division after 5 days in culture as shown by dilution of Cell Trace Violet in GFP expressing cells. MigR1 and Nfix overexpressing cells are compared to unstained control and Day 0 cells as positive and negative controls respectively. Graph is representative of 2 independent experiments. (F) Representative FACs plot of the expression of apoptotic markers AnnexinV and DAPI in MigR1 or Nfix transduced, GFP sorted BaF/3 cells, 4 days after transduction. (G) Graph of the average percentage of GFP sorted BaF/3 cells expressing DAPI, AnnexinV and live cells (double negative for DAPI and AnnexinV), from 2 independent experiments. Error bars denote +/- SD.
(TIF)
(PDF)
(PDF)
(PDF)
Data Availability Statement
All relevant data are within the paper and its Supporting Information files.