Abstract
Chemosensory proteins (CSPs) have been predicted to be involved in development; however, direct evidence for their involvement is lacking, and genetic basis is largely unknown. To determine the function of the chemosensory protein 9 (Si-CSP9) gene in Solenopsis invicta, we used RNA interference to silence Si-CSP9 in 3rd-instar larvae. The 3rd-instar larvae failed to shed their cuticle after being fed Si-CSP9-directed siRNA, and expression profiling of RNAi-treated and untreated control larvae showed that 375 genes were differentially expressed. Pathway enrichment analysis revealed that 4 pathways associated with larval development were significantly enriched. Blast analysis revealed that one fatty acid amide hydrolase (FAAH) gene was up-regulated and 4 fatty acid synthase (FAT) genes and one protein kinase DC2 gene (PKA) were down-regulated in the enriched pathways. Significantly higher expression of these genes was found in 4th-instar larvae, and Pearson correlation analysis of the expression patterns revealed significant relationships among Si-CSP9, PKA, FAAH, and FAT1-4. Moreover, we confirmed that expression levels of Si-CSP9, FAAH, and FAT1-4 were significantly reduced and that the development of 3rd-instar larvae was halted with PKA silencing. These results suggest that Si-CSP9 and PKA may be involved in the network that contributes to development of 3rd-instar larvae.
Chemosensory proteins (CSPs) are a family of small, soluble proteins that are also referred to as OS-D-like1 or sensory appendage proteins2. Similarly to odorant-binding proteins (OBPs), CSPs are involved in solubilising and transporting pheromones through the aqueous haemolymph in insects. However, CSPs have an earlier origin than OBPs, as aqueous Arthropoda utilised a generic gene family of binding proteins (proto-CSPs) with diverse physiological roles prior to the colonisation of hostile terrestrial environments using OBPs3.
Research suggests that, similar to OBPs4, CSPs mainly function in olfaction and gustation by transporting hydrophobic ligands in the sensillum lymph in insects5,6. The CSP gene family exhibited lineage-specific expansions, with a large number of orthologous groups, over a short evolutionary time; however, these gradually disappeared with increasing divergence7. In addition, a higher copy number of CSPs is found in ants and other social insects than in non-social insects7. In recent years, however, many CSPs have been isolated from non-chemosensory organs, which indicates that CSPs have varied functions2,8,9,10,11.
As an invasive social insect12, the red imported fire ant (Solenopsis invicta) has been found to have a highly sophisticated chemosensory system13. A large number of genes and their biological functions have been determined following the sequencing of the genome of this species14, and thus far, a large number of CSPs, with 23 Si-CSP genes including 2 pseudogenes, have been found7. Although many studies have been performed on the chemosensory system of ants9,15,16,17,18,19, there are also a great number of genes for which the functions cannot be inferred from sequence alone20. Copy number variation has been suggested to have a significant role in adaptation and could be a starting point for the generation of genes with new functions21,22. It is surprising that, of the CSP genes, only Si-CSP9 (accession number: EE129471) in S. invicta belongs to a distinct clade9, namely, that of Am-CSP5, which plays a role in the development of the embryonic integument in the honeybee23. Therefore, our hypothesis is that Si-CSP9 functions during the integument and moulting process in S. invicta larvae.
In this study, we cloned the full-length Si-CSP9 gene and identified its spatio-temporal expression patterns. To develop RNA interference (RNAi) for the 3rd-instar larvae of this ant, we used reverse genetics to validate directly whether a gene is essential during moulting. By comparing the larval structure and expression in the unsilenced and Si-CSP9-silenced samples, we illustrate the function of Si-CSP9 and validate its relationship with the process of larval development.
Results
The structure of Si-CSP9
The 1,045 bp full-length Si-CSP9 mRNA was obtained by RACE. The gene encoding Si-CSP9 is relatively small, consisting of two exons, and most of the sequence from ATG to the STOP codon is occupied by one 784 bp intron.
Expression patterns of Si-CSP9 in developmental stages, castes and tissues
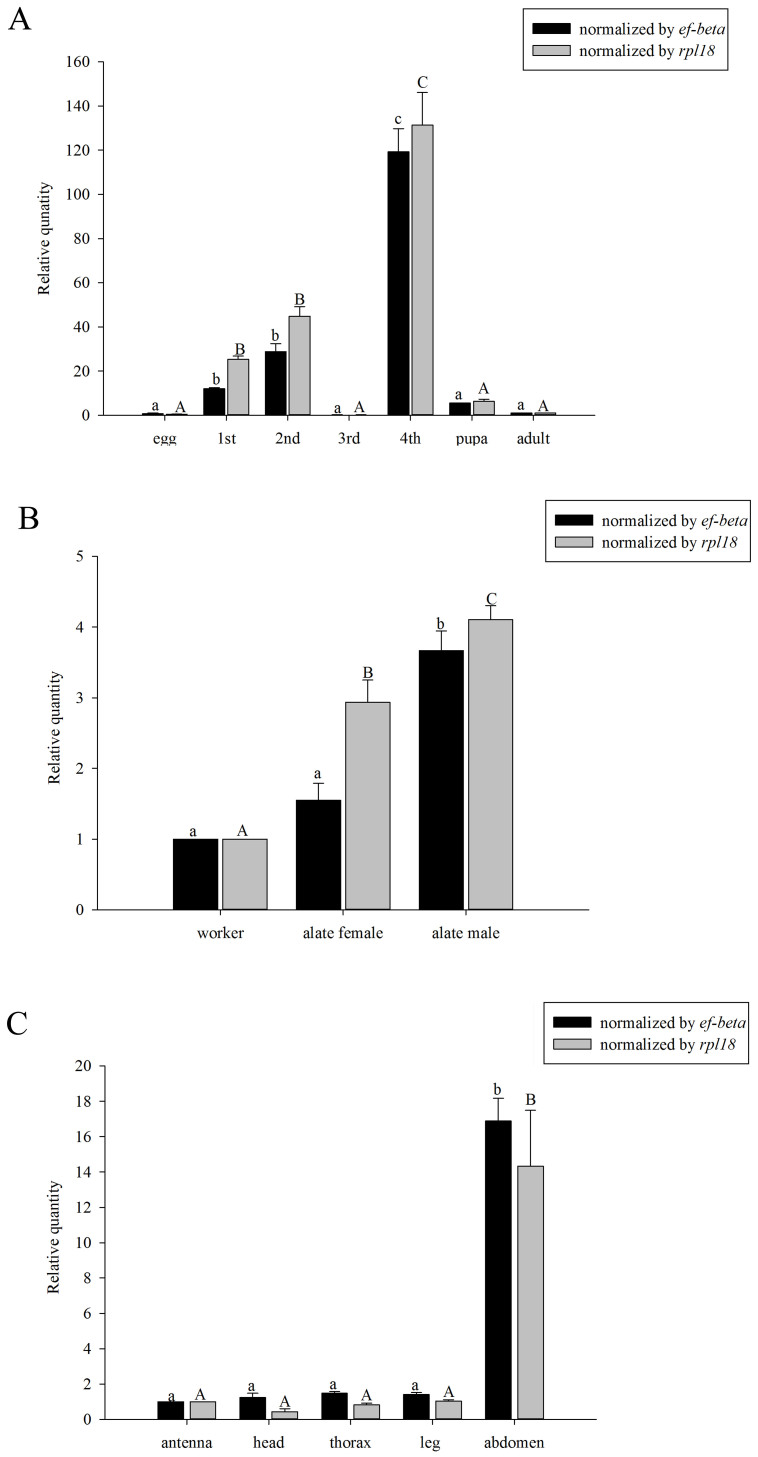
The expression level of Si-CSP9 was significantly higher in 4th-instar larvae (L4) than at other stages (ef-beta: ANOVA, F = 144.686, P < 0.001; rpl18: F = 66.529, P < 0.001 Figure 1A). When investigated in different castes, significantly higher expression was observed in the alate females than in the other castes (ef-beta: ANOVA, F = 43.714, P < 0.001; rpl18: F = 53.505, P < 0.001, Figure 1B). Furthermore, the expression of Si-CSP9 in the tissues of workers was investigated. Surprisingly, Si-CSP9 exhibited significantly higher expression in the abdomen than in the olfactory tissues (antennae) (ef-beta: ANOVA, F = 14.478, P < 0.001; rpl18: F = 18.192, P < 0.001, Figure 1C), whereas other Si-CSP genes are specifically expressed in the olfactory organs9.
Figure 1. Expression of Si-CSP9 in developmental stages, castes and tissues.
(A): expression of Si-CSP9 in eggs, 1st-instar larvae, 2nd-instar larvae, 3rd-instar larvae, 4th-instar larvae, pupae and adults; (B): expression of Si-CSP9 in worker, alate females and alate males; (C): expression of Si-CSP9 in the antenna, head, thorax, leg and abdomen of workers. Means ± SE that are labelled with the same letter within each treatment are not significantly different.
Expression profiles of Si-CSP9 during developmental process between L3 and L4
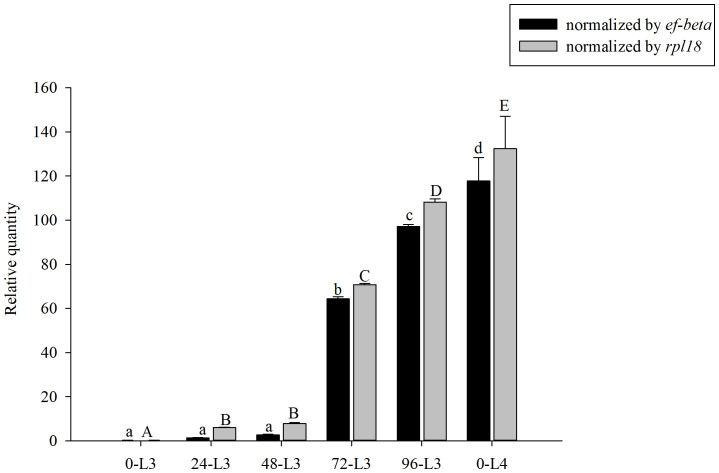
By investigating the expression profiles of Si-CSP9 during the developmental process between 3rd-instar larvae (L3) and 4th-instar larvae (L4), Si-CSP9 was found to be significantly more highly expressed in 72-h and 96-h L3 (when L3 begin to moult) (ef-beta: ANOVA, F = 5521.30, P < 0.001; rpl18: F = 3991.028, P < 0.001, Figure 2).
Figure 2. Expression of Si-CSP9 during developmental process between L3 and L4.
0-L3: newly emerged 3rd-instar larvae; 24-L3: 24-h-old 3rd-instar larvae; 48-L3: 48-h-old 3rd-instar larvae; 72-L3: 72-h-old 3rd-instar larvae; 96-L3: 96-h-old 3rd-instar larvae; 0-L4: 4th-instar larvae. Means ± SE that are labelled with the same letter within each treatment are not significantly different.
Functional investigation of Si-CSP9 by RNAi
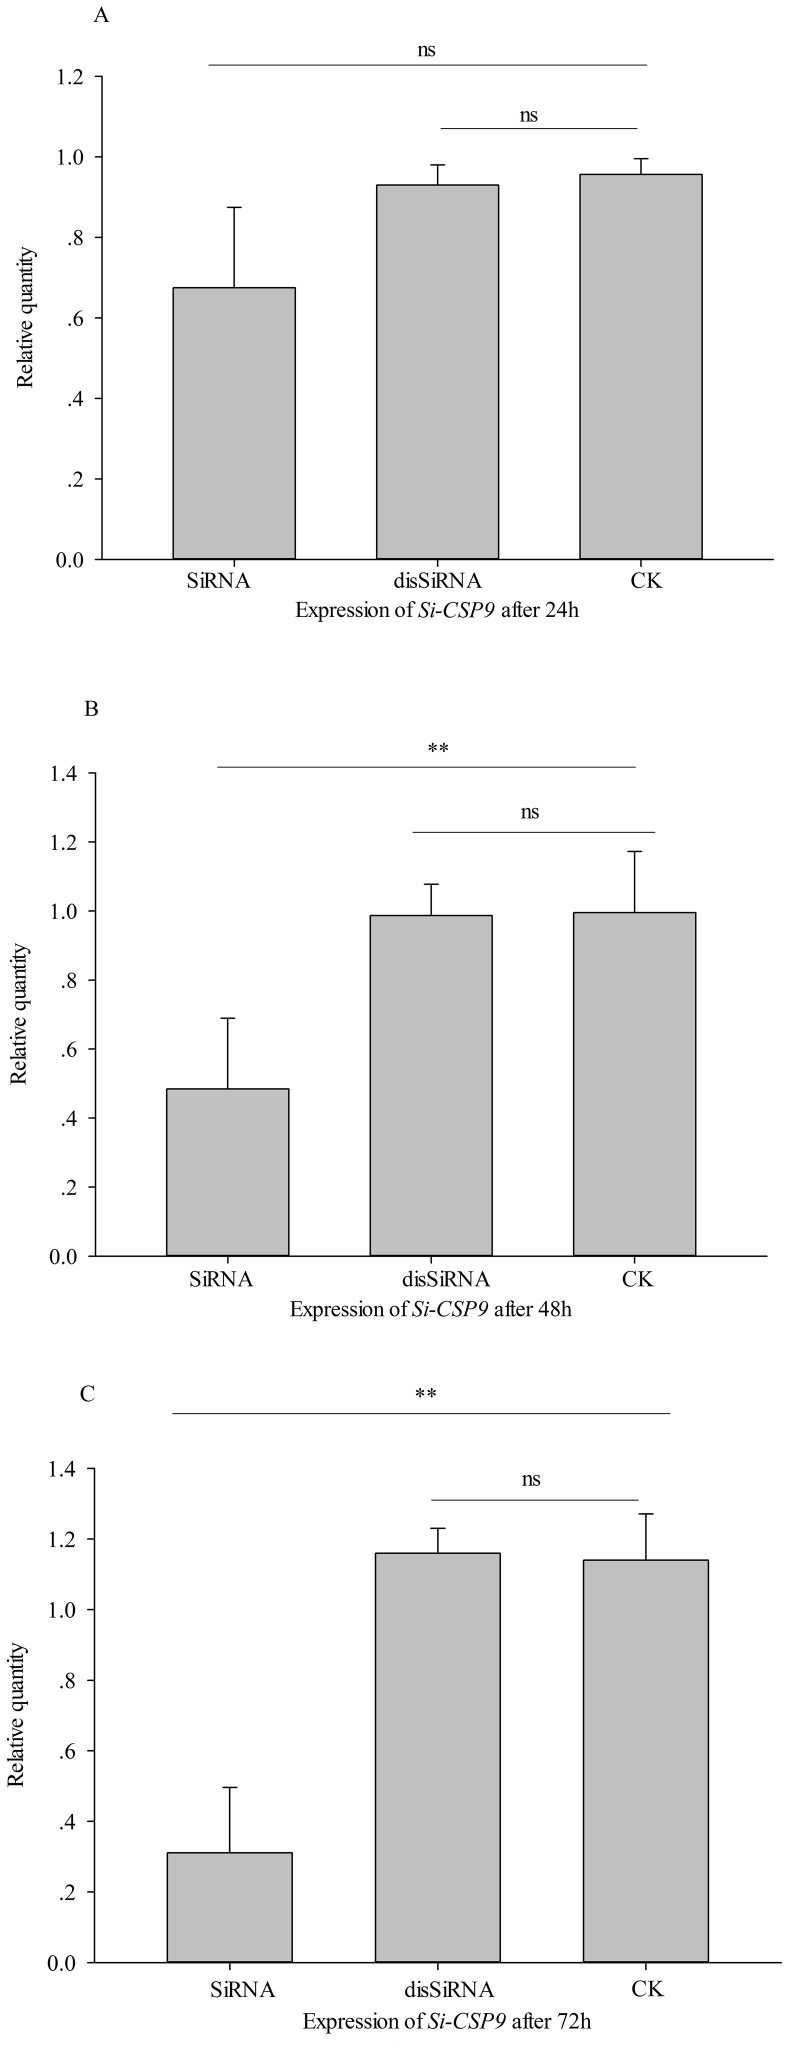
We designed an RNAi assay targeting the Si-CSP9 gene in L3 and investigated the temporal dynamic gene expression of Si-CSP9 and phenotype changes after RNAi treatment. Twenty-four hours after RNAi treatment, the expression of Si-CSP9 exhibited no significant difference in the SiRNA and disSiRNA samples and in a 10% sugar-water feeding treatment (normal control treatment, CK) (independent samples t-test, t = 2.392, 0.738, P = 0.075, 0.502, respectively, Figure 3A). After 48 h, the expression of Si-CSP9 exhibited a significantly lower level in SiRNA than in CK (independent samples t test, t = 3.263, P = 0.031, Figure 3B), whereas no significant difference was found between disSiRNA and CK (independent samples t test, t = 0.075, P = 0.943, Figure 3B). At 72 h, the expression of Si-CSP9 had decreased significantly to approximately 23.7% of CK (independent samples t test: t = 6.325, P = 0.003, Figure 3C), although no significant difference was observed between disSiRNA samples and CK samples (independent samples t test t = −0.272, P = 0.799, Figure 3C). Moreover, no differences were found for Si-CSP2 and Si-CSP3 expression among the SiRNA, disSiRNA and CK samples (Si-CSP2: independent samples t test, SiRNA vs. CK, 24 h, t = 0.372, P = 0.728; 48 h, t = 0.742, P = 0.499; 72 h, t = 0.612, P = 0.574. disSiRNA vs. CK, 24 h, t = 0.414, P = 0.7; 48 h, t = 0.477, P = 0.658; 72 h, t = 1.018, P = 0.366) (Si-CSP3: independent samples t test, SiRNA vs. CK, 24 h, t = 0.74, P = 0.499; 48 h, t = 0.742, P = 0.499; 72 h, t = −0.372, P = 0.728. disSiRNA vs. CK, 24 h, t = 0.477, P = 0.658; 48 h, t = 1.21, P = 0.29; 72 h, t = 0.414, P = 0.7) (Supplementary Figure 1).
Figure 3. Expression of Si-CSP9 after silencing.
(A): Expression of Si-CSP9 after being silenced for 24 h. (B): Expression of Si-CSP9 after being silenced for 48 h. (C): Expression of Si-CSP9 after being silenced for 72 h. SiRNA: small interference RNA; disSiRNA: small interference RNA with a disordered sequence; CK: sugar-water. In all groups, for treatment compared with CK, “**” denotes P < 0.01; “ns” denotes not significant.
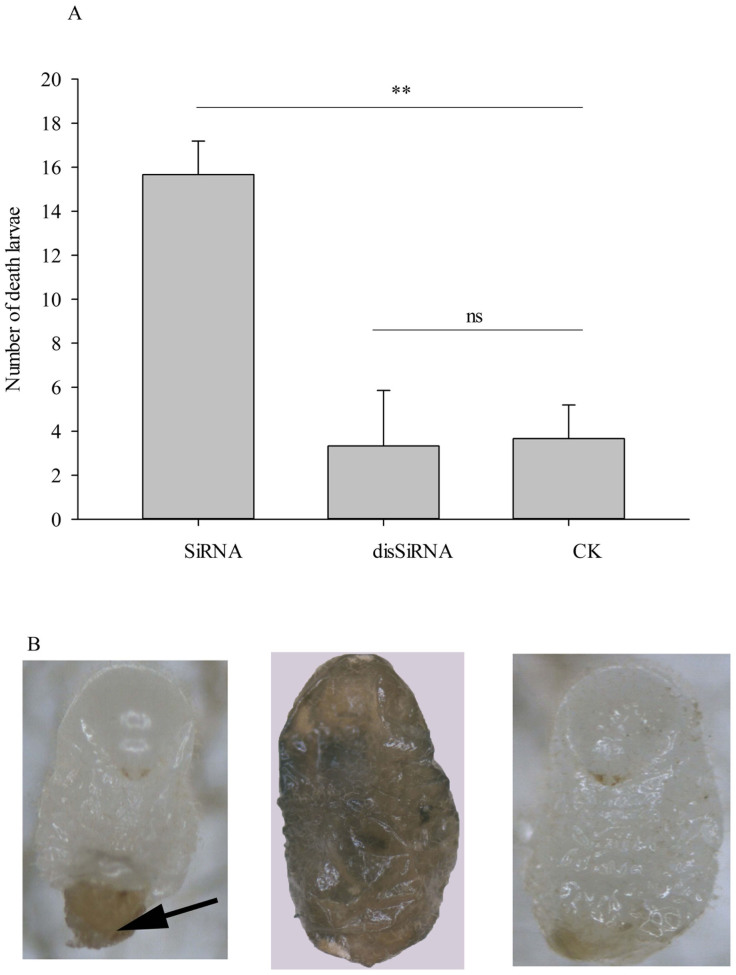
An investigation of larval mortality showed that L3 fed the Si-CSP9 SiRNA had a significantly higher mortality than CK (independent samples t = 9.62, P = 0.001, Figure 4A); no significant difference between the disSiRNA feeding treatment and CK was found (independent samples t = 0.2, P = 0.85, Figure 4A). Moreover, it appeared that although the 3rd-instar larvae were viable and began their development towards L4, they failed to shed the 3rd-instar larval cuticle in the last phase of the moulting process, ecdysis, which resulted in the old cuticle remaining attached to the partially moulted body (as shown in Figure 4B). Most of the dead larvae were found to exhibit a brown nodule (as shown by the black arrow in Figure 4B, left) on the abdomen. Body shrinking and melanism were also found for the dead larvae (Figure 4B middle) in the SiRNA feeding treatment, whereas the larvae developed normally into L4 in CK (Figure 4B right).
Figure 4. Mortality and phenotype of larvae after silencing of Si-CSP9.
(A): Number of dead larvae after silencing of Si-CSP9. (B): Phenotype of larvae after silencing of Si-CSP9. In all groups, for treatment compared with CK, “**”denotes P < 0.01; “ns” denotes not significant.
Transcription expression profile after Si-CSP9 down-regulation
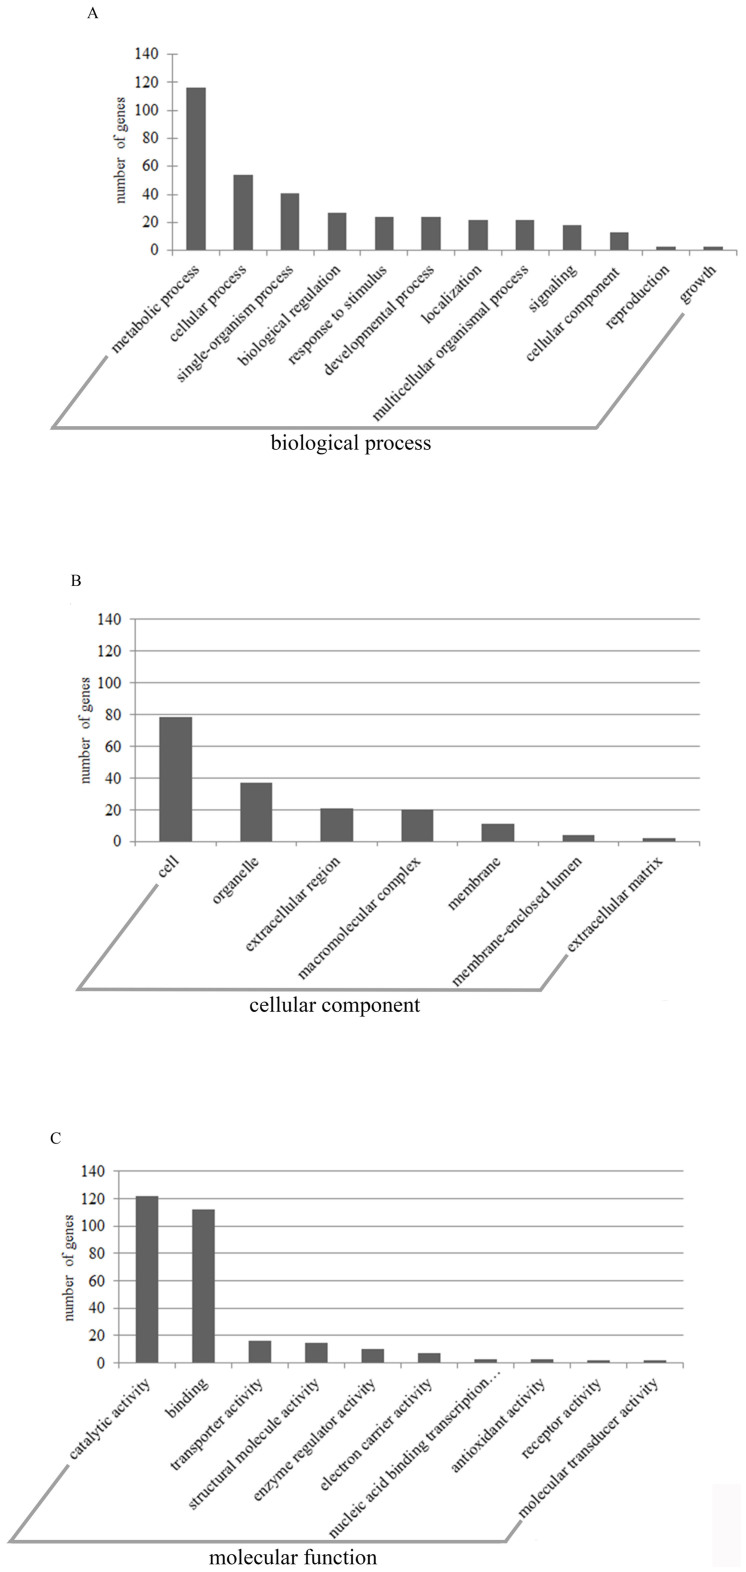
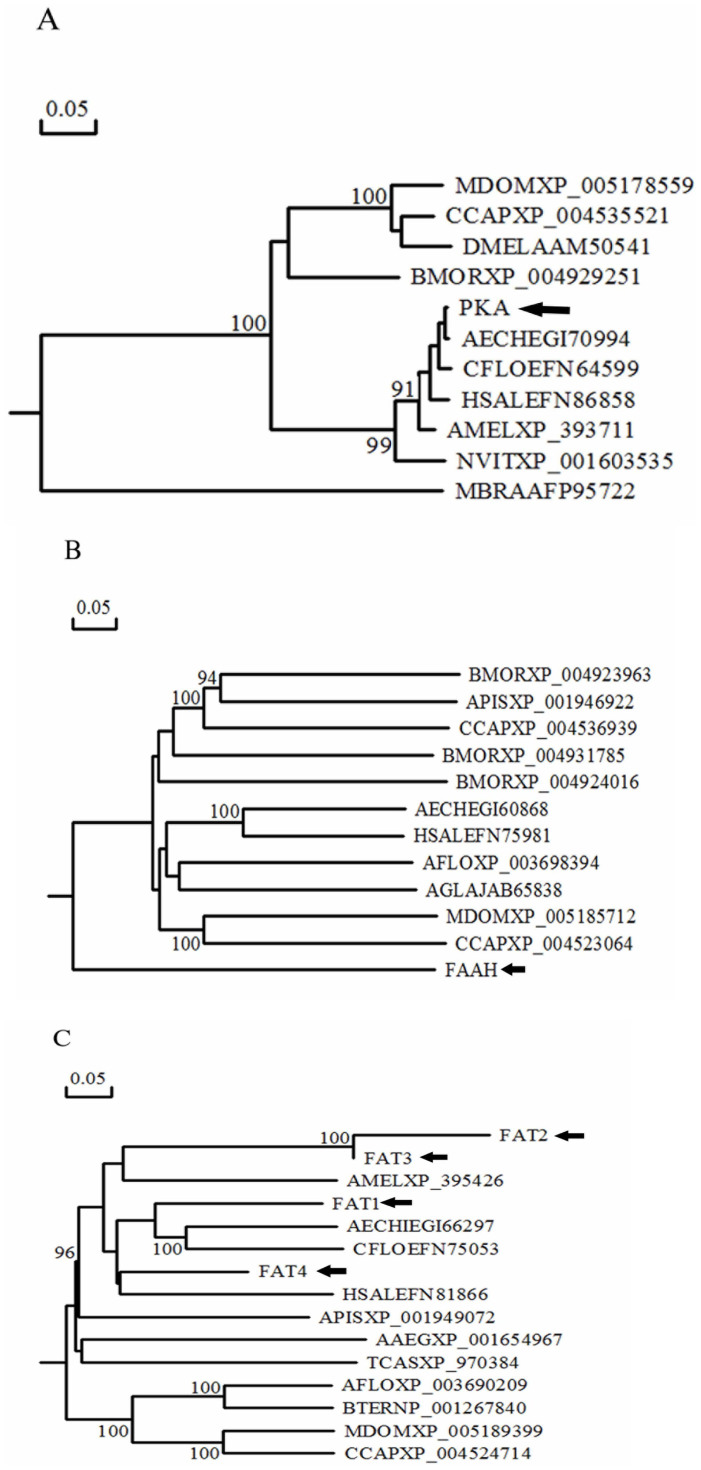
There were 375 differentially expressed genes (67 up-regulated genes and 308 down-regulated genes) when Si-CSP9 was silenced in the SiRNA feeding treatment. These genes fell into various ontological categories (Figure 5) and pathways (Table 1). With regard to biological processes for the differentially expressed genes, the metabolic process exhibited the highest number of differentially expressed genes, at 116 (Figure 5A, Supplementary Dataset S1). The genes in the metabolic process were significantly enriched in the following: fatty acid biosynthesis; glycine, serine and threonine metabolism; metabolic pathways; the hedgehog signalling pathway; and carbon-nitrogen ligase activity, with glutamine as amido-N-donor (Table 1). As has been previously reported, fatty acid biosynthesis, metabolic pathways, hedgehog signalling, and glutamine amido-N-donor carbon-nitrogen ligase activity have been demonstrated to have a significant effect on the development of insect larvae24,25,26,27,28. We performed blast and phylogenetic analyses of the most differentially expressed genes in the significantly enriched pathways and metabolic processes: namely, a protein kinase DC2 gene (PKA) involved in the hedgehog signalling pathway, one fatty acid amide hydrolase gene (FAAH) involved in glutamine amido-N-donor carbon-nitrogen ligase activity, and 4 fatty acid synthase genes (FAT1, FAT2, FAT3, FAT4) involved in the fatty acid biosynthesis and metabolic pathways (Figure 6A, 6B, and 6C; Table 1, Table 2).
Figure 5. Diversity of ontological categories of differentially expressed genes.
(A): Ontological categories in biological process. (B): Ontological categories in cell component. (C): Ontological categories in molecular function.
Table 1. Significant differences in enriched pathways for differentially expressed genes.
| Pathway | No. of differentially expressed genes | P value | Pathway ID |
|---|---|---|---|
| Fatty acid biosynthesis | 4 | 0.0007 | hsa00061 |
| Glycine, serine and threonine metabolism | 6 | 0.0012 | hsa00260 |
| Metabolic pathways | 33 | 0.0023 | hsa01100 |
| Carbon-nitrogen ligase activity, with glutamine as amido-N-donor | 1 | 0.0070 | GO:0016884 |
| Hedgehog signalling pathway | 1 | 0.0098 | dme04340 |
Figure 6. Neighbour-joining trees of PKA, FAAH, and FAT1-4 created using DNAMAN software.
The tree is collapsed to nodes with 50% or greater bootstrap support (n = 1000 replicates), and the bootstrap values are listed at each node. (A): Neighbour-joining tree of PKA. (B): Neighbour-joining tree of FAAH. C: Neighbour-joining tree of FAT1-4. Information on the genes is given in Supplementary Table S1.
Table 2. Partially differentially expressed genes involved in significantly enriched pathways.
| Gene ID | Gene name | Log2 Ratio | Up-down regulation | P value | FDR | Description | Enriched pathway |
|---|---|---|---|---|---|---|---|
| RIFA001 | FAAH | 11.39 | Up | 3.63E-05 | 3.72E-04 | Fatty acid amide hydrolase 2 | Carbon-nitrogen ligase activity, with glutamine as amido-N-donor |
| RIFA247 | PKA | -1.49 | Down | 1.16E-15 | 4.47E-14 | Protein kinase DC2 | Hedgehog signalling pathway |
| RIFA181 | FAT1 | -2.05 | Down | 6.38E-08 | 1.08E-06 | Fatty acid synthase | Fatty acid biosynthesis & Metabolic pathways |
| RIFA215 | FAT2 | -1.71 | Down | 1.56E-14 | 5.68E-13 | Fatty acid synthase | Fatty acid biosynthesis & Metabolic pathways |
| RIFA253 | FAT3 | -1.46 | Down | 2.27E-07 | 3.54E-06 | Fatty acid synthase | Fatty acid biosynthesis & Metabolic pathways |
| RIFA337 | FAT4 | -1.12 | Down | 8.57E-06 | 0.0001 | Fatty acid synthase | Fatty acid biosynthesis & Metabolic pathways |
Relationship between expression patterns of Si-CSP9, PKA, FAAH, and FAT1-4 and developmental stages
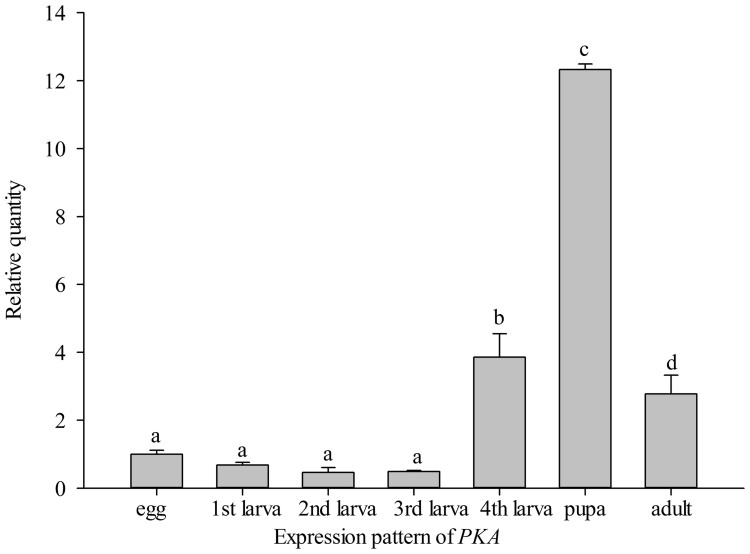
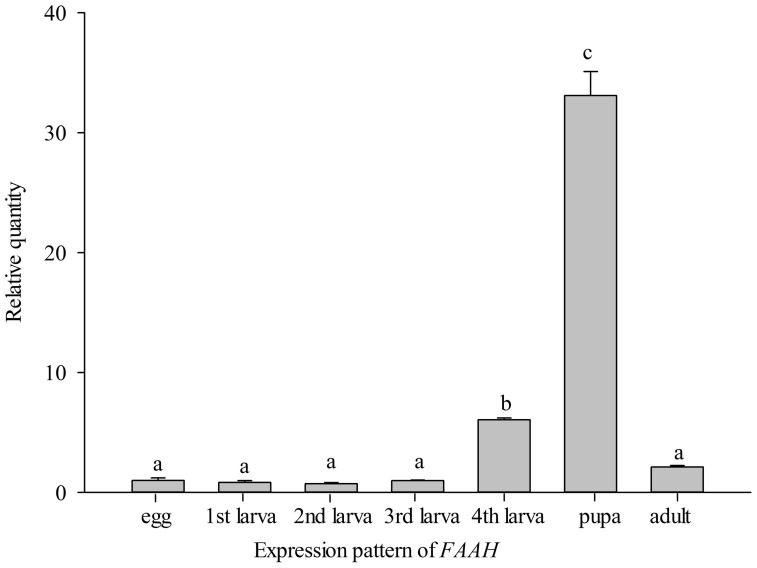
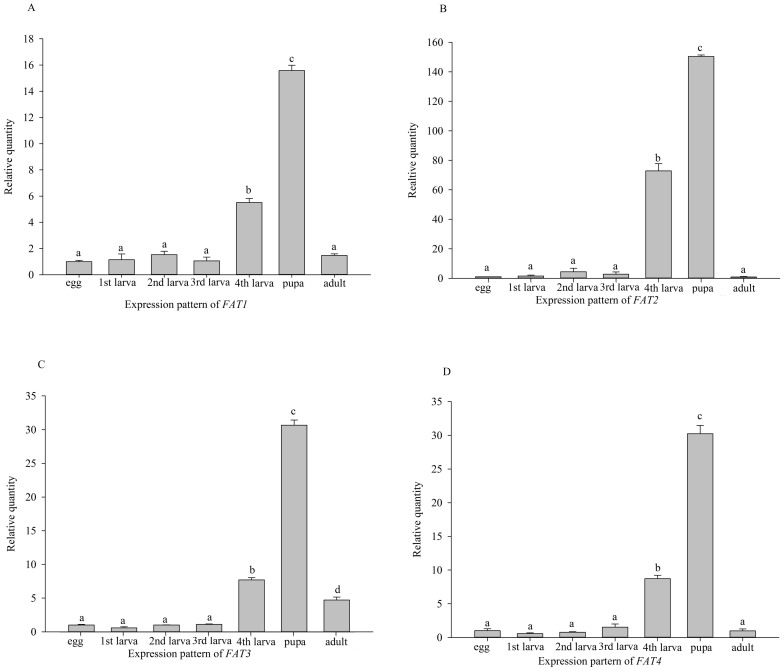
A one-way analysis of variance showed that PKA, FAAH, and FAT1-4 had significantly higher expression in 4th-instar larvae than other developmental stages, identical to Si-CSP9 (PKA: F = 461.68, P < 0.001, Figure 7; FAAH: F = 719.24, P < 0.001, Figure 8; FAT1: F = 1001, P < 0.001; FAT2: F = 2127, P < 0.001; FAT3: F = 2701, P < 0.001; FAT4: F = 1222, P < 0.001, Figure 9). The expression pattern correlation analysis between PKA, FAAH, FAT1-4, and Si-CSP9 revealed the same expression patterns in the developmental stages, with each gene exhibiting a significantly related Pearson correlation with another gene at the 0.01 level (Table 3).
Figure 7. Development-specific expression of PKA.
Means ± SE that are labelled with the same letter within each treatment are not significantly different.
Figure 8. Development-specific expression of FAAH.
Means ± SE that are labelled with the same letter within each treatment are not significantly different.
Figure 9. Development-specific expressions of FAT1-4.
Means ± SE that are labelled with the same letter within each treatment are not significantly different.
Table 3. Correlations of expression patterns between genes (N* = 21).
| Si-CSP9 | PKA | FAAH | FAT1 | FAT2 | FAT3 | FAT4 | ||
|---|---|---|---|---|---|---|---|---|
| Si-CSP9 | Pearson Correlation | 1 | 0.710** | 0.663** | 0.751** | 0.851** | 0.690** | 0.741** |
| Sig. (2-tailed) | 0.000 | 0.001 | 0.000 | 0.000 | 0.001 | 0.000 | ||
| PKA | Pearson Correlation | 0.710** | 1 | 0.980** | 0.981** | 0.954** | 0.995** | 0.978** |
| Sig. (2-tailed) | 0.000 | 0.000 | 0.000 | 0.000 | 0.000 | 0.000 | ||
| FAAH | Pearson Correlation | 0.663** | 0.980** | 1 | 0.987** | 0.947** | 0.994** | 0.991** |
| Sig. (2-tailed) | 0.001 | 0.000 | 0.000 | 0.000 | 0.000 | 0.000 | ||
| FAT1 | Pearson Correlation | 0.751** | 0.981** | 0.987** | 1 | 0.983** | 0.988** | 0.995** |
| Sig. (2-tailed) | 0.000 | 0.000 | 0.000 | 0.000 | 0.000 | 0.000 | ||
| FAT2 | Pearson Correlation | 0.851** | 0.954** | 0.947** | 0.983** | 1 | 0.956** | 0.977** |
| Sig. (2-tailed) | 0.000 | 0.000 | 0.000 | 0.000 | 0.000 | 0.000 | ||
| FAT3 | Pearson Correlation | 0.690** | 0.995** | 0.994** | 0.988** | 0.956** | 1 | 0.989** |
| Sig. (2-tailed) | 0.001 | 0.000 | 0.000 | 0.000 | 0.000 | 0.000 | ||
| FAT4 | Pearson Correlation | 0.741** | 0.978** | 0.991** | 0.995** | 0.977** | 0.989** | 1 |
| Sig. (2-tailed) | 0.000 | 0.000 | 0.000 | 0.000 | 0.000 | 0.000 |
N*: number of tested samples; **Correlation is significant at the 0.01 level.
Functional analysis of PKA by RNAi
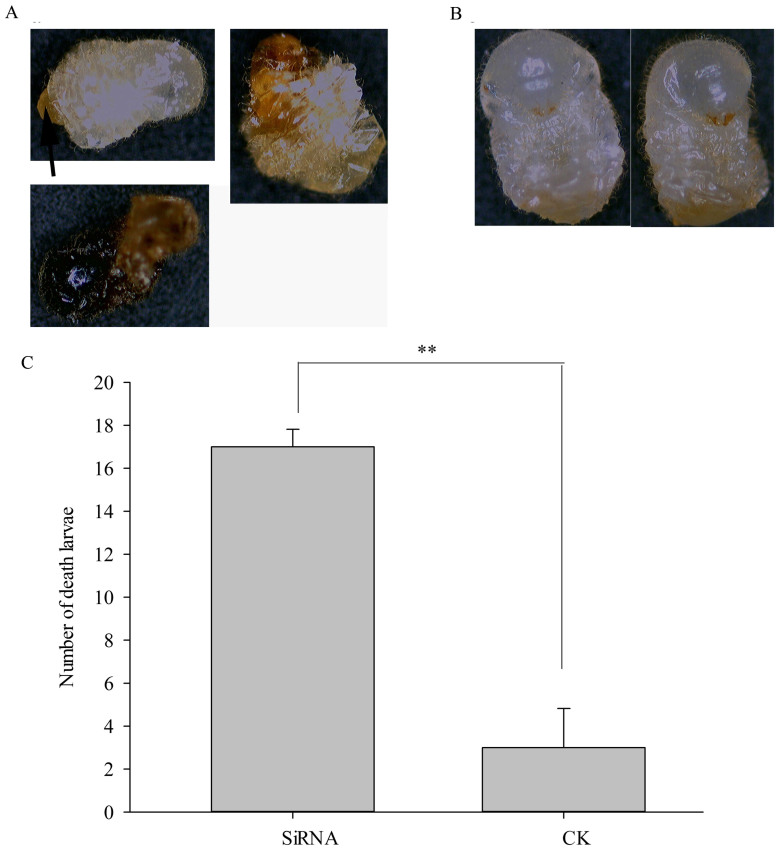
Phenotypic observations revealed that the larvae treated with PKA RNAi had a slower development rate compared to the normal control treatment. The larvae were unable to moult or moulted incompletely under PKA RNAi treatment, and this dramatic change was found after 72 h of RNAi feeding (Figure 10). Separation between the 3rd-instar larval cuticle and the newly synthesised 4th-instar larval cuticle was observed. However, the L4 could not remove the cuticle from their bodies, and it remained attached to the abdomen by a brown nodule (Figure 10A, black arrow). The other type of deformation was characterised by an atrophic body (Figure 10A, right); the ultimate destiny of the larvae was death and melanism (Figure 10A, bottom). In contrast, the larvae receiving the normal control treatment displayed all the normal characteristics of L4 and developed normally and successfully to the next stage (Figure 10B). All these phenotypes were identical to those in the Si-CSP9 RNAi treatment (Figure 4).
Figure 10. Phenotype and mortality of larvae after PKA silencing.
(A): Phenotype of larvae with PKA silencing. (B): Phenotype of larvae in CK. (C): Number of dead compared within the silenced PKA samples and normally expressed PKA samples. “**” denotes P < 0.01.
The difference in mortality of L3 between the RNAi treatment and normal control treatment was analysed after 96 h, with a significantly higher mortality observed under the RNAi treatment (independent samples t-test, t = −14, P < 0.001; Figure 10C). This result was similar to the result obtained under the Si-CSP9 RNAi treatment (Figure 4).
Effects of PKA RNAi treatment on the expression of Si-CSP9, FAAH, and FATs
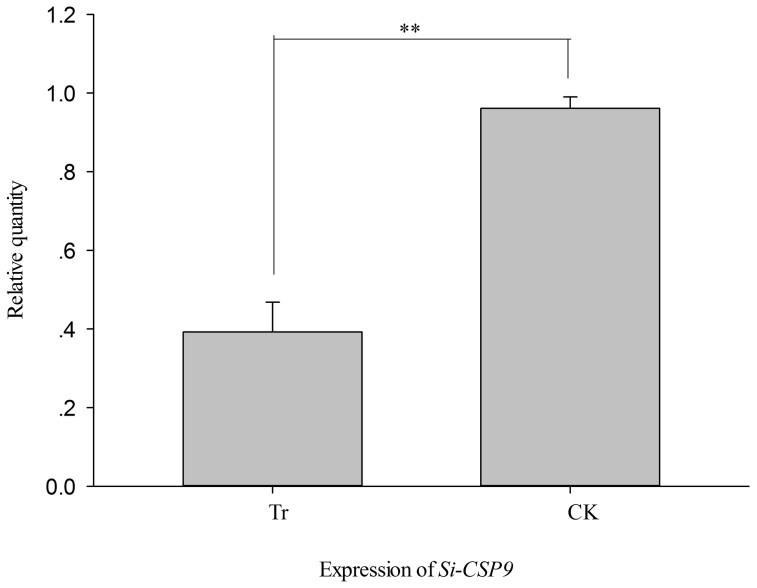
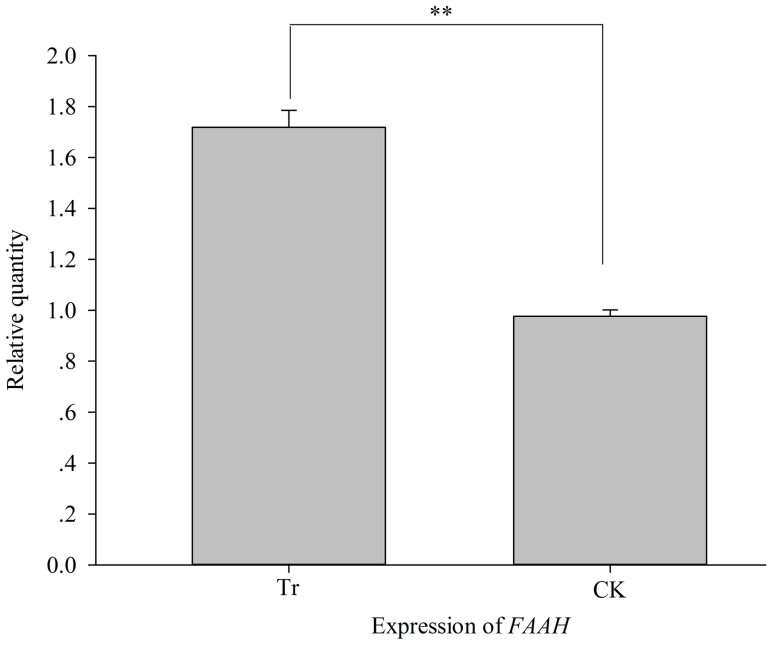
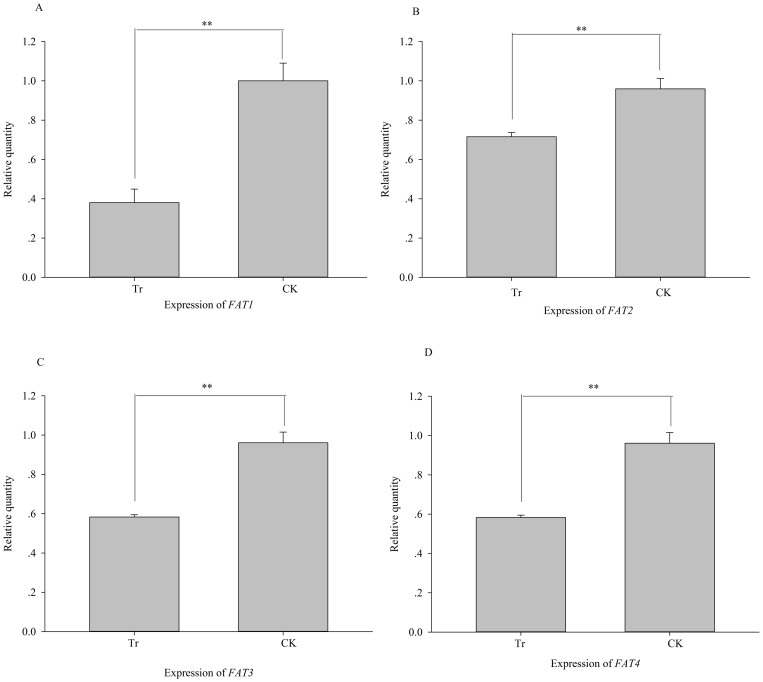
In the PKA RNAi treatment, Si-CSP9 and FAT1-4 exhibited a significant decrease in expression, whereas FAAH increased significantly, consistent with the Si-CSP9 RNAi treatment (independent samples t-test, Si-CSP9: t = −12.137, P < 0.001, Figure 11; FAAH: t = −18.12, P < 0.001, Figure 12; FAT1: t = −15.566, P < 0.001; FAT2: t = −7.435, P = 0.002; FAT3: t = −16.142, P < 0.001; FAT4: t = −11.78, P < 0.001, Figure 13).
Figure 11. Effects on expression of Si-CSP9 after silencing of PKA.
Tr: samples with PKA silenced; CK: samples with PKA normally expressed.
Figure 12. Effects on expression of FAAH after silencing of PKA.
Tr: samples with PKA silenced; CK: samples with PKA normally expressed.
Figure 13. Effects on expression of FAT1-4 after silencing of PKA.
(A): expression of FAT1; (B): expression of FAT2; (C): expression of FAT3; (D): expression of FAT4. Tr: samples with PKA silenced; CK: samples with PKA normally expressed.
Discussion
In this study, we demonstrated that the chemosensory protein encoded by Si-CSP9 may be involved in the developmental process that occurs in the transition from L3 to L4, particularly the cuticularisation and moulting processes, in which FAAH and FAT1-4 play important roles29,30.
Through RNAi assays and oligonucleotide microarray analysis, we illustrated that decreased Si-CSP9 expression may affect fatty acid biosynthesis, metabolic pathways, and glutamine amido-N-donor carbon-nitrogen ligase activity. Indeed, FATs and FAAH are differentially expressed, affecting the development of larvae (Table 1 & Table 2), though the disSiRNA control showed no such effects (data not shown). To our knowledge, this study is the first to identify the relationship between chemosensory genes and FAAH and FATs genes in the red imported fire ant, and our data are important for understanding the new role of chemosensory proteins in social insects.
Recently, animal development has been found to be affected by many internal and external factors31,32,33. Previous studies have also indicated similar roles of the chemosensory system in other organisms. For example, studies have indicated that chemosensory neurons34 and small-molecule pheromones in the nematode Caenorhabditis elegans can control larval development. Data also show that C. elegans larval development is controlled by the activities of four classes of chemosensory neurons and that larvae are regulated by competing environmental stimuli: food and a dauer pheromone, which are recognised by chemosensory proteins35,36. Interestingly, studies have also found a novel role for chemosensory proteins in controlling development in insects23. CSPs from other insects have been shown to be expressed in large amounts in the epidermis11,37,38, which is critical during development39,40. However, more evidence is required to determine whether there are environmental stimuli that can be recognised by Si-CSP9 and affect the development of red imported fire ant larvae.
Similar techniques and results have been reported in the honeybee (Apis mellifera)23. Using RNAi, researchers have found that CSP5 plays a role in the development of the embryonic integument. However, no analysis of the RNAi-induced phenotype by high-throughput technologies such as microarrays to identify other genes involved in this transition has been performed. In our experiments, the function of Si-CSP9 in the developmental process between L3 and L4 was revealed by RNAi. Moreover, the entire network of interactions during cuticle synthesis was unravelled using RNA-seq. Our results clearly provide evidence for the hypothesis that CSPs may perform a non-olfactory function, which will be essential to understanding the origins of evolutionary novelties in different lineages. However, the affected stages are different between the honeybee and red imported fire ant. This result demonstrates the multifunctional nature of CSPs, especially in Hymenoptera.
Furthermore, a gene identified in our study, PKA, is involved in the hedgehog signalling pathway, which plays key roles in a wide variety of developmental processes, even in larval body segment development and in the formation of adult appendages41. Abnormal larvae and a significantly higher death rate, which were also observed with Si-CSP9 RNAi treatment, were observed with PKA silencing (Figure 4 & Figure 10). Thus, we predict interaction between Si-CSP9 and PKA in the larval development of S. invicta. Fujiwara, et al. (2002)42 have found that interaction between sensory stimuli and PKA can regulate the body size and behavioural state of C. elegans, which is direct evidence that PKA has a close and vital relationship with the chemosensory system during olfactory recognition. We also found that Si-CSP9 was down-regulated with PKA silencing (Figure 11). Furthermore, the correlation analysis of expression patterns between Si-CSP9 and PKA in developmental stages showed a significant relationship (Table 3). Thus, we suggest that Si-CSP9 and PKA are involved in the same network that affects larval development.
Our results also suggested that FAAH and FATs are significantly affected by PKA silencing, with an abnormal phenotype (Figure 10, Figure 12 and Figure 13). PKA exhibited a significant Pearson correlation with FAAH and FATs with regard to expression patterns (Table 3). As the primary element43 in the cAMP signal transduction system, one of several second messenger-dependent pathways that generates intracellular responses to extracellular signals44, PKA was also found to affect the development of Drosophila larvae45. Studies have found that interactions between the inositol and cyclic AMP signalling pathways, in which the role of PKA is important, can regulate larval moulting in Drosophila46. In addition, PKA activity is regulated by chemosensory stimulation in the honeybee antennal lobe47. All this evidence leads us to believe that PKA can regulate larval development in the red imported fire ant.
However, the details of the interaction between Si-CSP9 and PKA remain unclear. Research indicates that the cAMP/PKA pathway rapidly activates SIRT1 to promote fatty acid oxidation independently of changes in NAD+ 48. As mentioned by Maleszka (2007)23, it is reasonable to assume that Si-CSP9 encodes a carrier protein transporting lipophilic compounds used for embryonic integument synthesis, a role consistent with the properties of CSPs. Hydrocarbons (HCs), which are synthesised by oenocytes situated in the integument, comprise one of the major constituents of the insect epicuticular lipid layer49. The cuticle and ovary appear to be the main target tissues for the transport pathways of insect HCs49. Research has also found that interactions between cuticular hydrocarbon and CSPs are vital in ant nestmate and non-nestmate discrimination50. Thus, it is possible that Si-CSP9 and PKA are involved in the shuttling of HCs through an aqueous medium to the epicuticle. However, more data are needed to examine this hypothesis.
Traditionally, CSPs are thought to function in olfaction and gustation by transporting hydrophobic ligands in the sensillum lymph5,6. Our studies suggested that the CSPs could play a different role, controlling the development of larvae by affecting the expression of PKA, FAAH, and FATs. Indeed, we identified several gene categories that are candidates for controlling the development of larvae and have close relationships to Si-CSP9, and this molecular mechanism is particularly significant for understanding the novel function of the CSP family.
Methods
Insects
Three colonies (polygyne) of red imported fire ants were collected from the campus of South China Agriculture University, Guangzhou, China (23.150967N, 113.3552E) and placed in plastic boxes with the walls dusted with talcum powder. The ant colonies were maintained in an incubator with 80% humidity, 26 ± 2°C and a 12:12 dark/light photoperiod and reared with 10% sugar-water and Tenebrio molitor.
Experimental samples
For each colony, samples of insects at newly emerged developmental stages (egg, 1st-instar larvae, 2nd-instar larvae, 3rd-instar larvae (L3), 4th-instar larvae (L4), pupae and adults), castes (females, males and workers) and tissues (antennae, heads, thoraxes, legs and abdomens) of workers were collected and immediately place in liquid nitrogen for later qRT-PCR. For developmental stages and castes, 5 ants were selected for each sample; for tissues, 100 ants were dissected for each sample. Three replicate samples were taken for each stage, caste and tissue. Nine individuals (3 individuals for each sample) were also sampled every 24 hours during the L3 and L4 stages to investigate the expression profiles of Si-CSP9.
RNA extraction and quality assessment
Total RNA was extracted using the TRIzol reagent (Invitrogen, USA) following the manufacturer's instructions. The RNA sample quality was examined through 4 steps: (1) analysis of sample degradation and contamination via agarose gel electrophoresis; (2) examination of purity using a NanoDrop 2000 spectrophotometer; (3) precise quantification of the concentration using a Qubit® 2.0 fluorometer; and (4) accurate detection of integrity using an Agilent 2100 Bioanalyzer.
5′ race and 3′ race analysis of Si-CSP9
To determine the structure of Si-CSP9, 5′ and 3′ rapid amplification of cDNA ends (RACE) was performed using the SMARTerTM RACE cDNA Amplification Kit (Clontech, California, USA) according to the manufacturer's instructions (primer sequences are shown in Table 4). To determine the exon and intron structure of this gene, the full-length cDNA of Si-CSP9 was subjected to a nucleotide Blast search using S. invicta genomic resources (http://hymenopteragenome.org/ant_genomes/?q=blast).
Table 4. Primer information.
| Primer name | Primer sequence (5′-3′) | Product size |
|---|---|---|
| Si-CSP9-race | F:CAACTGAACATAGCCCTGAGCGACAAR: ACTTTTCAAACGACGTCCGACGGGG | |
| qSi-CSP9 | F: GGTCTCCGACGAACAACTR: GAACCAGCGGCACTAAAC | 131 bp |
| qSi-CSP2 | F: GACGTTGTGCGACAGAAAGCR: TCCAAGTATCGGGTTGGTTCT | 187 bp |
| qSi-CSP3 | F: GCAATGAGCGTACTGACGTGR: TGCTGTTCTAGTGTGCACGG | 152 bp |
| RNAi-Si-CSP9 | 5′-GATCACTAATACGACTCACTATAGGGCAGGATAGTGCAACAATACTT-3′3′-CTAGTGATTATGCTGAGTGATATCCCGTCCTATCACGTTGTTATGAA-5′5′-AACAGGATAGTGCAACAATACCCCTATAGTGAGTCGTATTAGTGATC-3′3′-TTGTCCTATCACGTTGTTATGGGGATATCACTCAGCATAATCACTAG-5′ | |
| RNAi-PKA | 5′-GATCACTAATACGACTCACTATAGGGTTTACGAGATGTTGGCGGGTT-3′3′-CTAGTGATTATGCTGAGTGATATCCCAAATGCTCTACAACCGCCCAA-5′5′-AATTTACGAGATGTTGGCGGGCCCTATAGTGAGTCGTATTAGTGATC-3′3′-TTAAATGCTCTACAACCGCCCGGGATATCACTCAGCATAATCACTAG-5′ | |
| qPKA | GTAGACTGGTGGGCGTTAGGCG TCTTCGTTCTGTCGGCGATCAA | |
| qFAT1 | F:CTGCGACGGTCCCATGTATTR:TGTCATTCGTGCCCACAGTT | 177 bp |
| qFAT2 | F:GGCTAAGAATTTTTCAGGACGCR:TTTTCCTTGCCAGGTCTACTGT | 159 bp |
| qFAT3 | F:CAGAAAGCGAAGCATGCGAAR:TGACAAACCGCAACTCTCGT | 150 bp |
| qFAT4 | F:AATGGGGTGCGATTGGTGATR:CTGCTTACGATAGGCCGGTT | 154 bp |
| qFAAH | F:TCCCATACTGCGATGACACGR:TATTCGCCTCAAGTCCACCG | 152 bp |
RNA interference (RNAi)
Small interference RNAs (SiRNA) specific to Si-CSP9 and PKA were prepared using an in vitro transcription T7 kit (Takara) following the manufacturer's instructions (primer sequences are shown in Table 1). As a control, small interference RNAs with disordered sequences to the target genes (disSiRNA) were also prepared. RNAi and phenotype analyses were performed to identify the in vivo function of Si-CSP9. In this procedure, 12 μg siRNA complementary to Si-CSP9 (siRNA) was mixed into sugar-water and fed to L3. As a control, 10% sugar-water and sequence-disordered siRNA (disSiRNA) mixed in sugar-water were also fed to L3. For 72 hours, the larvae were sampled every 24 hours to identify the expression of Si-CSP9 by qRT-PCR. A control for the expression of CSPs during the RNAi experiment was confirmed by investigating the expression of Si-CSP2 and Si-CSP3, which have the highest degree of homology to Si-CSP99.
RNA-seq and analysis of differentially expressed genes
To detect associations between Si-CSP9 and other genes or pathways, gene expression profile differences between the Si-CSP9 RNAi treatment sample and Si-CSP9 normally control sample were compared by RNA-seq. The quantified RNA samples were enriched for mRNA using magnetic beads with oligonucleotide (dT), and the enriched mRNA was then fragmented into 400–600 bp fragments using fragmentation buffer and used as a template to synthesise both the first-strand cDNA and second-strand cDNA. The double-stranded cDNA generated was purified using AMPure XP beads, and the end of the double-stranded cDNA was then repaired, a base A tail was added, and sequencing adapters were connected to the end of the double-stranded cDNA. Finally, fragments were selected based on size (400–600 bp fragments) using AMPure XP beads. PCR was used for amplification, and the PCR products were purified using AMPure XP beads to generate cDNA libraries. The prepared libraries were sequenced by the pair-end method using the Illumina HiSeq platform. The sequencing read length was 200 bp. We sequenced 2.66 G clean bases for each sample. The Trinity software51 was used for transcript assembly (version: v2012-10-05; min_kmer_cov = 2; the default settings were used for the remaining parameters). The assembly process was as described in Grabherr (2011)52. The sequences assembled by Trinity were mapped onto the genome of the red imported fire ant (http://hymenopteragenome.org/ant_genomes/?q=blast) for the ensuing analysis. In the mapping process, the software RSEM was used according to the manufacturer's instruction53. The mapping results from RSEM were calculated to generate the read count for each gene and transferred into RPKM (reads per kilobases per million mapped reads) using the estimation method in Mortazavi et al. (2008)54. DESeq54 was introduced to analyse the read count data and identify differentially expressed genes under different experimental conditions. In the case of genes with FDR ≤ 0.001 and |log2Ratio| ≥ 1, the tested gene was differently expressed compared to the reference sample54,55.
Pathway enrichment analysis was performed using the KEGG Orthology-based Annotation System 2.0 (KOBAS 2.0, http://kobas.cbi.pku.edu.cn) in the Drosophila melanogaster database. InterPro categories were enriched for the supplied gene list based on the algorithm presented by GOstat56.
Phenotype observation after Si-CSP9 and protein kinase DC2 gene (PKA) silencing
Twenty L3 were selected and cared for by 15 adult workers in an incubator. Every 24 h, the ants were fed with 12 μg siRNA mixed in sugar-water (SiRNA) as the test treatment. Two groups of ants were used as controls: the first group received the control treatment, being fed only 10% sugar-water, and the second group was fed with 12 μg disSiRNA mixed in 10% sugar-water. After 72 h, we recorded the number of dead larvae and photographed them.
Expression patterns and relationships between Si-CSP9, PKA, the fatty acid amide hydrolase (FAAH) gene, and fatty acid synthase (FAT) genes
To confirm the RNA-seq results, the expression levels of the four groups of significantly differentially expressed genes (Si-CSP9, PKA, FAA and FAT1-4) were detected by qRT-PCR. Newly emerged eggs, 1st-instar larvae, 2nd-instar larvae, 3rd-instar larvae, 4th-instar larvae, pupae and adults were collected, and total RNA was extracted. The cDNA was reverse-transcribed from 2 μg total RNA using PrimeScriptR° 1st Strand cDNA Synthesis Kit (Takara). The expression levels of Si-CSP9, PKA, FAAH, and FAT1-4 were investigated by qRT-PCR (primer sequences are shown in Table 4). The standard curve method was used to measure the relative expression levels of the samples, and ef-beta and rpl18 were used as reference genes to normalise the reaction57. PCR amplification was conducted using the Mx3000P spectrofluorometric thermal cycler (Stratagene), as follows: a 2 min incubation at 95°C, followed by 40 cycles of 95°C for 20 s, 57°C for 30 s, and 68°C for 20 s. A melting curve analysis was performed to confirm the specificity of amplification.
Statistical analysis
The independent samples t-test was applied to test the expression differences of Si-CSP9 and PKA between SiRNA-fed ants and CK and the differences between the numbers of dead larvae in the SiRNA-fed ants and CK. Differences in the expression patterns of Si-CSP9, PKA, FAAH, and FAT1-4 were compared by a one-way analysis of variance (ANOVA), followed by Tukey's test for multiple comparisons. Pearson correlation coefficients between the gene expression patterns were calculated and compared using the independent samples t-test. Differences were considered to be significant at P < 0.05. The data were analysed using SPSS 16.0.
Author Contributions
D.C.: study design, experimental studies, statistical analysis and manuscript preparation. L.Z., Y.L. and G.L.: manuscript editing. X.H.: approval of the final version of the manuscript.
Supplementary Material
Supplementary Figure and Table
Supplementary Dataset S1
Acknowledgments
This work was supported by the Natural Science Foundation of China, www.nsfc.org.cn (30900942) and Guangdong Science and Technology Plan, www.pro.gdstc.gov.cn (2011B031500017).
References
- McKenna M. P., Hekmat-Scafe D. S., Gaines P. & Carlson J. R. Putative Drosophila pheromone-binding proteins expressed in a subregion of the olfactory system. J. Biol. Chem. 269, 16340–16347 (1994). [PubMed] [Google Scholar]
- Robertson H. M. et al. Diversity of odourant binding proteins revealed by an expressed sequence tag project on male Manduca sexta moth antennae. Insect Mol Biol 8, 501–518 (1999). [DOI] [PubMed] [Google Scholar]
- Vieira F. G. & Rozas J. Comparative Genomics of the Odorant-Binding and Chemosensory Protein Gene Families across the Arthropoda: Origin and Evolutionary History of the Chemosensory System. Genome Biol. Evol. 3, 476–490, 10.1093/gbe/evr033 (2011). [DOI] [PMC free article] [PubMed] [Google Scholar]
- Pelosi P. Odorant-binding proteins. Crit. Rev. Biochem. Mol. Biol. 29, 199–228, 10.3109/10409239409086801 (1994). [DOI] [PubMed] [Google Scholar]
- Pelosi P., Calvello M. & Ban L. Diversity of Odorant-binding Proteins and Chemosensory Proteins in Insects. Chem. Senses 30, i291–i292, 10.1093/chemse/bjh229 (2005). [DOI] [PubMed] [Google Scholar]
- Foret S. & Maleszka R. Function and evolution of a gene family encoding odorant binding-like proteins in a social insect, the honey bee (Apis mellifera). Genome Res. 16, 1404–1413, 10.1101/gr.5075706 (2006). [DOI] [PMC free article] [PubMed] [Google Scholar]
- Kulmuni J., Wurm Y. & Pamilo P. Comparative genomics of chemosensory protein genes reveals rapid evolution and positive selection in ant-specific duplicates. Heredity (Edinb.) 110, 538–547, 10.1038/hdy.2012.122 (2013). [DOI] [PMC free article] [PubMed] [Google Scholar]
- Gong D.-P. et al. Identification and expression pattern of the chemosensory protein gene family in the silkworm, Bombyx mori. Insect Biochem. Mol. Biol. 37, 266–277, doi:http://dx.doi.org/10.1016/j.ibmb.2006.11.012 (2007). [DOI] [PubMed] [Google Scholar]
- González D. et al. The major antennal chemosensory protein of red imported fire ant workers. Insect Mol. Biol. 18, 395–404, 10.1111/j.1365-2583.2009.00883.x (2009). [DOI] [PMC free article] [PubMed] [Google Scholar]
- Wanner K. W., Isman M. B., Feng Q., Plettner E. & Theilmann D. A. Developmental expression patterns of four chemosensory protein genes from the Eastern spruce budworm, Chroistoneura fumiferana. Insect Mol Biol 14, 289–300, 10.1111/j.1365-2583.2005.00559.x (2005). [DOI] [PubMed] [Google Scholar]
- Nomura Kitabayashi A., Arai T., Kubo T. & Natori S. Molecular cloning of cDNA for p10, a novel protein that increases in the regenerating legs of Periplaneta americana (American cockroach). Insect Biochem. Mol. Biol. 28, 785–790, doi:http://dx.doi.org/10.1016/S0965-1748(98)00058-7 (1998). [DOI] [PubMed] [Google Scholar]
- Porter S. D., Van Eimeren B. & Gilbert L. E. Invasion of Red Imported Fire Ants (Hymenoptera: Formicidae): Microgeography of Competitive Replacement. Ann. Entomol. Soc. Am. 81, 913–918 (1988). [Google Scholar]
- Gotzek D. & Ross K. G. Current status of a model system: the gene Gp-9 and its association with social organization in fire ants. PLoS One 4, e7713, 10.1371/journal.pone.0007713 (2009). [DOI] [PMC free article] [PubMed] [Google Scholar]
- Wurm Y. et al. The genome of the fire ant Solenopsis invicta. Proc. Natl. Acad. Sci 108, 5679–5684, 10.1073/pnas.1009690108 (2011). [DOI] [PMC free article] [PubMed] [Google Scholar]
- Huang Y.-C. & Wang J. Did the fire ant supergene evolve selfishly or socially? Bioessays 36, 200–208, 10.1002/bies.201300103 (2014). [DOI] [PubMed] [Google Scholar]
- Tangtrakulwanich K., Chen H., Baxendale F., Brewer G. & Zhu J. J. Characterization of olfactory sensilla of Stomoxys calcitrans and electrophysiological responses to odorant compounds associated with hosts and oviposition media. Med. Vet. Entomol. 25, 327–336, 10.1111/j.1365-2915.2011.00946.x (2011). [DOI] [PubMed] [Google Scholar]
- Nakanishi A., Nishino H., Watanabe H., Yokohari F. & Nishikawa M. Sex-specific antennal sensory system in the ant Camponotus japonicus: Glomerular organizations of antennal lobes. J. Comp. Neurol. 518, 2186–2201, 10.1002/cne.22326 (2010). [DOI] [PubMed] [Google Scholar]
- Marques-Silva S. et al. Sensilla and secretory glands in the antennae of a primitive ant: Dinoponera lucida (Formicidae: Ponerinae). Microsc. Res. Tech. 69, 885–890, 10.1002/jemt.20356 (2006). [DOI] [PubMed] [Google Scholar]
- Guntur K. V. P. et al. Apolipophorin-III-like protein expressed in the antenna of the red imported fire ant, Solenopsis invicta Buren (Hymenoptera: Formicidae). Arch. Insect Biochem. Physiol. 57, 101–110, 10.1002/arch.20019 (2004). [DOI] [PubMed] [Google Scholar]
- Miklos G. L. G. & Maleszka R. Protein functions and biological contexts. Proteomics 1, 169–178, (2001). [DOI] [PubMed] [Google Scholar]
- Bidaut G. Gene Function Inference From Gene Expression of Deletion Mutants. Vol. 408 1–18 (Humana Press, 2007). [DOI] [PubMed] [Google Scholar]
- Li X. L., Tan Y. C. & Ng S. K. Systematic gene function prediction from gene expression data by using a fuzzy nearest-cluster method. BMC Bioinformatics 7, S23, 10.1186/1471-2105-7-S4-S23 (2006). [DOI] [PMC free article] [PubMed] [Google Scholar]
- Maleszka J., Foret S., Saint R. & Maleszka R. RNAi-induced phenotypes suggest a novel role for a chemosensory protein CSP5 in the development of embryonic integument in the honeybee (Apis mellifera). Dev. Genes Evol. 217, 189–196, 10.1007/s00427-006-0127-y (2007). [DOI] [PubMed] [Google Scholar]
- Stanley-Samuelson D. W., Jurenka R. A., Cripps C., Blomquist G. J. & de Renobales M. Fatty acids in insects: Composition, metabolism, and biological significance. Arch. Insect Biochem. Physiol. 9, 1–33, 10.1002/arch.940090102 (1988). [DOI] [Google Scholar]
- Sweetlove L. J. & Fernie A. R. Regulation of metabolic networks: understanding metabolic complexity in the systems biology era. New Phytol 168, 9–24, 10.1111/j.1469-8137.2005.01513.x (2005). [DOI] [PubMed] [Google Scholar]
- Cohen M. M. The hedgehog signaling network. Am. J. Med. Genet. A 123A, 5–28, 10.1002/ajmg.a.20495 (2003). [DOI] [PubMed] [Google Scholar]
- Boguś M. I. et al. Effects of insect cuticular fatty acids on in vitro growth and pathogenicity of the entomopathogenic fungus Conidiobolus coronatus. Exp. Parasitol. 125, 400–408, doi:http://dx.doi.org/10.1016/j.exppara.2010.04.001 (2010). [DOI] [PubMed] [Google Scholar]
- Lambremont E. N. Lipid metabolism of insects: Interconversion of fatty acids and fatty alcohols. Insect Biochem. 2, 197–202, doi:http://dx.doi.org/10.1016/0020-1790(72)90053-4 (1972). [Google Scholar]
- McKinney M. K. & Cravatt B. F. structure and function of fatty acid amide hydrolase. Annu. Rev. Biochem. 74, 411–432, 10.1146/annurev.biochem.74.082803.133450 (2005). [DOI] [PubMed] [Google Scholar]
- Zhang D. et al. Fatty acid amide hydrolase inhibitors display broad selectivity and inhibit multiple carboxylesterases as off-targets. Neuropharmacology 52, 1095–1105, doi:http://dx.doi.org/10.1016/j.neuropharm.2006.11.009 (2007). [DOI] [PubMed] [Google Scholar]
- Lennox J. G. The Comparative Study of Animal Development: William Harvey's Aristotelianism., 21–46 (Cambridge University Press, 2006). [Google Scholar]
- Wu D. et al. Uracil-DNA Glycosylase is involved in DNA demethylation and required for embryonic development in the zebrafish embryo. J. Biol. Chem., jbc. M114. 561019, 10.1074/jbc.M114.561019 (2014). [DOI] [PMC free article] [PubMed] [Google Scholar]
- Shieh B.-H., Kristaponyte I. & Hong Y. Distinct Roles of Arrestin 1 in Photoreceptors During Drosophila Development. J. Biol. Chem., jbc. M114. 571224, 10.1074/jbc.M114.571224 (2014). [DOI] [PMC free article] [PubMed] [Google Scholar]
- Bargmann C. I. & Horvitz H. R. Control of larval development by chemosensory neurons in Caenorhabditis elegans. Science 251, 1243–1246 (1991). [DOI] [PubMed] [Google Scholar]
- Mekuchi M. et al. Molecular cloning, gene structure, molecular evolution and expression analyses of thyrotropin-releasing hormone receptors from medaka (Oryzias latipes). Gen Comp Endocrinol 170, 374–380, 10.1016/j.ygcen.2010.10.013 (2011). [DOI] [PubMed] [Google Scholar]
- Nomura A., Kawasaki K., Kubo T. & Natori S. Purification and localization of p10, a novel protein that increases in nymphal regenerating legs of Periplaneta americana (American cockroach). Int. J. Dev. Biol. 36, 391–398 (1992). [PubMed] [Google Scholar]
- Wanner K. W. et al. Analysis of the insect os-d-like gene family. J Chem Ecol 30, 889–911 (2004). [DOI] [PubMed] [Google Scholar]
- Marchese S. et al. Soluble proteins from chemosensory organs of Eurycantha calcarata (Insects, Phasmatodea). Insect Biochem Mol Biol 30, 1091–1098 (2000). [DOI] [PubMed] [Google Scholar]
- Palli S. R. & Locke M. The synthesis of hemolymph proteins by the larval epidermis of an insect Calpodes ethlius (Lepidoptera: Hesperiidae). Insect Biochem. 17, 711–722, doi:http://dx.doi.org/10.1016/0020-1790(87)90041-2 (1987). [Google Scholar]
- Aye T. T., Shim J.-K., Rhee I.-K. & Lee K.-Y. Upregulation of the immune protein gene hemolin in the epidermis during the wandering larval stage of the Indian meal moth, Plodia interpunctella. J. Insect Physiol. 54, 1301–1305, doi:http://dx.doi.org/10.1016/j.jinsphys.2008.07.003 (2008). [DOI] [PubMed] [Google Scholar]
- Ingham P. W. & McMahon A. P. Hedgehog signaling in animal development: paradigms and principles. Genes Dev 15, 3059–3087, 10.1101/gad.938601 (2001). [DOI] [PubMed] [Google Scholar]
- Fujiwara M., Sengupta P. & McIntire S. L. Regulation of Body Size and Behavioral State of C. elegans by Sensory Perception and the EGL-4 cGMP-Dependent Protein Kinase. Neuron 36, 1091–1102, doi:http://dx.doi.org/10.1016/S0896-6273(02)01093-0 (2002). [DOI] [PubMed] [Google Scholar]
- Beebe S. J. The cAMP-dependent protein kinases and cAMP signal transduction. Semin. Cancer Biol. 5, 285–294 (1994). [PubMed] [Google Scholar]
- Anand-Srivastava M. B., Sairam M. R. & Cantin M. Ring-deleted analogs of atrial natriuretic factor inhibit adenylate cyclase/cAMP system. Possible coupling of clearance atrial natriuretic factor receptors to adenylate cyclase/cAMP signal transduction system. J Biol Chem 265, 8566–8572 (1990). [PubMed] [Google Scholar]
- Lane M. E. & Kalderon D. Genetic investigation of cAMP-dependent protein kinase function in Drosophila development. Genes Dev 7, 1229–1243, 10.1101/gad.7.7a.1229 (1993). [DOI] [PubMed] [Google Scholar]
- Venkatesh K., Siddhartha G., Joshi R., Patel S. & Hasan G. Interactions Between the Inositol 1,4,5-Trisphosphate and Cyclic AMP Signaling Pathways Regulate Larval Molting in Drosophila. Genetics 158, 309–318 (2001). [DOI] [PMC free article] [PubMed] [Google Scholar]
- Hildebrandt H. & Müller U. PKA activity in the antennal lobe of honeybees is regulated by chemosensory stimulation in vivo. Brain Res. 679, 281–288, doi:http://dx.doi.org/10.1016/0006-8993(95)00246-M (1995). [DOI] [PubMed] [Google Scholar]
- Gerhart-Hines Z. et al. The cAMP/PKA Pathway Rapidly Activates SIRT1 to Promote Fatty Acid Oxidation Independently of Changes in NAD+. Mol. Cell 44, 851–863, doi:http://dx.doi.org/10.1016/j.molcel.2011.12.005 (2011). [DOI] [PMC free article] [PubMed] [Google Scholar]
- Schal C., Sevala V. L., Young H. P. & Bachmann J. A. S. Sites of Synthesis and Transport Pathways of Insect Hydrocarbons: Cuticle and Ovary as Target Tissues. Am. Zool. 38, 382–393, 10.1093/icb/38.2.382 (1998). [DOI] [Google Scholar]
- Ozaki M. et al. Ant nestmate and non-nestmate discrimination by a chemosensory sensillum. Science 309, 311–314, 10.1126/science.1105244 (2005). [DOI] [PubMed] [Google Scholar]
- Iyer M. K. & Chinnaiyan A. M. RNA-Seq unleashed. Nat. Biotechnol. 29, 599–600, 10.1038/nbt.1915 (2011). [DOI] [PubMed] [Google Scholar]
- Grabherr M. G. et al. Full-length transcriptome assembly from RNA-Seq data without a reference genome. Nat. Biotechnol. 29, 644–U130, 10.1038/Nbt.1883 (2011). [DOI] [PMC free article] [PubMed] [Google Scholar]
- Li B. & Dewey C. N. RSEM: accurate transcript quantification from RNA-Seq data with or without a reference genome. BMC Bioinformatics 12, 323, 10.1186/1471-2105-12-323 (2011). [DOI] [PMC free article] [PubMed] [Google Scholar]
- Mortazavi A., Williams B. A., McCue K., Schaeffer L. & Wold B. Mapping and quantifying mammalian transcriptomes by RNA-Seq. Nat. Methods 5, 621–628, 10.1038/nmeth.1226 (2008). [DOI] [PubMed] [Google Scholar]
- Benjamini Y. & Hochberg Y. Controlling the false discovery rate: a practical and powerful approach to multiple testing. J. Roy. Stat. Soc. Ser. B. 57, 289–300 (1995). [Google Scholar]
- Beißbarth T. & Speed T. P. GOstat: find statistically overrepresented Gene Ontologies within a group of genes. Bioinformatics 20, 1464–1465, 10.1093/bioinformatics/bth088 (2004). [DOI] [PubMed] [Google Scholar]
- Cheng D., Zhang Z., He X. & Liang G. Validation of reference genes in Solenopsis invicta in different developmental stages, castes and tissues. PLoS One 8, e57718, 10.1371/journal.pone.0057718 (2013). [DOI] [PMC free article] [PubMed] [Google Scholar]
Associated Data
This section collects any data citations, data availability statements, or supplementary materials included in this article.
Supplementary Materials
Supplementary Figure and Table
Supplementary Dataset S1


