

Abstract
Background
There is considerable interest in oxygen partial pressure (Po2) monitoring in physiology, and in tracking Po2 changes dynamically when it varies rapidly. For example, arterial Po2 () can vary within the respiratory cycle in cyclical atelectasis (CA), where is thought to increase and decrease during inspiration and expiration, respectively. A sensor that detects these oscillations could become a useful diagnostic tool of CA during acute respiratory distress syndrome (ARDS).
Methods
We developed a fibreoptic Po2 sensor (<200 µm diameter), suitable for human use, that has a fast response time, and can measure Po2 continuously in blood. By altering the inspired fraction of oxygen () from 21 to 100% in four healthy animal models, we determined the linearity of the sensor's signal over a wide range of values in vivo. We also hypothesized that the sensor could measure rapid intra-breath oscillations in a large animal model of ARDS.
Results
In the healthy animal models, responses to changes in were in agreement with conventional intermittent blood-gas analysis (n=39) for a wide range of values, from 10 to 73 kPa. In the animal lavage model of CA, the sensor detected oscillations, also at clinically relevant levels close to 9 kPa.
Conclusions
We conclude that these fibreoptic sensors have the potential to become a diagnostic tool for CA in ARDS.
Keywords: acute respiratory distress syndrome, arterial oxygen monitoring, cyclical atelectasis, fibreoptic sensor
Editor's key points.
A fibreoptic sensor was developed which can measure Po2 continuously in blood.
The sensor was tested in animal models over a range of values.
The sensor agreed with conventional blood gas analysis.
In a model of cyclical atelectasis, the sensor detected arterial Po2 oscillations.
The sensor has clinical potential.
It is commonly accepted that arterial oxygenation remains essentially constant during the respiratory cycle in the healthy lung. Only minimal variations have been observed, with a period corresponding to the breathing period.1–4 In contrast, in some conditions of lung injury, the arterial partial pressure of oxygen () is known to oscillate to a great extent.5–7 It is thought that these oscillations are caused by alveolar opening during inspiration, when increases, and by alveolar collapse during expiration, when decreases; this phenomenon is called cyclical atelectasis (CA). This understanding is supported in part by evidence from imaging studies using, for example, computed tomography and positron emission tomography scans (reviewed in8 and9) and in part by studies using optical intravascular sensors, which showed oscillations in animal models of lung injury.6,7,10–13
These insightful investigations have furthered our understanding of the relationship between levels and lung mechanics, and have better informed the management of mechanical ventilation. However, investigations using fast sensors have not yet been conducted in human patients because early embodiments of these sensors contained ruthenium, a toxic material,14 which needs to be exposed in order for the sensors to achieve a sufficiently rapid response time.15 The assessment of individual sensors is a critical step when using these prototype sensors for physiological or medical research.15–17 Furthermore, the relevance of animal studies and their translation into medical practice remain unclear, due, for example, to anatomical and pathophysiological differences between species.
In order to avoid the requirement for a toxic component in these sensors, we produced a sensor based on a platinum complex, immobilized in a polymer matrix,18,19 which has the potential to be safely used in humans, once its reliability is established in large animal models. We recently showed that this sensor can detect up to 60 Po2 oscillations per minute in vitro, simulating the occurrence of CA at a high respiratory rate.17 We also showed that, when exposed to non-heparinized blood, the sensor is resistant to blood clotting at least for a period of 24 h in vivo.17
This sensor has the potential to become a useful diagnostic tool for CA in the acute respiratory distress syndrome (ARDS), or in other clinical scenarios where is thought to change rapidly. Moreover, the continuous real-time signal would provide immediate feedback on the effect of changes in ventilatory settings, which could be tailored on an individual basis, possibly leading towards a more personalized form of ventilation therapy.
This study aimed at establishing the sensor's response time, exploring the range over which the sensor can generate reliable results, using standard blood gas analysis as a control measurement, and assessing whether it could detect oscillations in an ovine model of ARDS in vivo.
Methods
The methods for the assessment of sensor's response time in vitro are presented elsewhere,18,20 and outlined in the Supplementary material.
All the animal experiments conformed to the National Institutes of Health Guidelines for the Use of Laboratory Animals. The protocols for the linearity experiments at the Charles University, Czech Republic, were approved by the local University Animal Care Committee. The protocols for the ovine lavage model studies were approved by the UK Home Office. At the end of each study, the animals were killed under anaesthesia with an overdose of pentobarbital (∼100 mg kg−1). Relevant sections of the ARRIVE guidelines were adhered to.
Assessment of sensor linearity
The in vivo linearity of the polymethyl methacrylate (PMMA) sensor was first assessed in experiments at the Faculty of Medicine, Charles University, Plzen, Czech Republic. One female domestic pig (weight 38 kg, age 3 months) was studied during the 8 h recovery and stabilization period from surgery, before the beginning of a separate experiment on the same animal.
Anaesthesia was induced with i.v. propofol (1–2 mg kg−1) and ketamine (2 mg kg−1). The trachea was intubated and the lungs were mechanically ventilated with tidal volumes of 8 ml kg−1, with a PEEP of 6 cm H2O, and of 35%. The respiratory rate was adjusted to maintain normocapnia. Anaesthesia was maintained with continuous infusions of propofol (1–4 mg kg−1 h−1) plus fentanyl (10–15 µg kg−1 h−1). After preparation, the infusion of fentanyl was decreased to 5 µg kg−1 h−1, and maintained until the end of the experiment. Adequacy of anaesthesia was determined by end tidal agent monitoring, the absence of movement, haemodynamic monitoring (heart rate and arterial pressure), and absence of reflexes. Continuous infusion of Ringerfundin™ solution (Braun Melsungen Ag, Melsungen, Germany) was used as a fluid replacement in doses of 10 ml kg−1 h−1 during the preparation and reduced to 7 ml kg−1 h−1 thereafter.
The PMMA sensor was connected to the phase measurement system,17 and inserted in the femoral artery through a standard catheter (length 10 cm, diameter 1.2 mm) to monitor responses to changes in . This was temporarily decreased to 21%, and then increased to 60%, 80%, and 100%, interspersed with recovery periods where was returned to baseline (i.e. 35%); each condition lasted for about 4 min. The sensor was calibrated a posteriori, on the basis of the smallest and greatest values, as recorded with standard analysis of arterial blood gas (ABG, ABL710, Radiometer, Copenhagen, Denmark). Arterial blood samples were obtained once had been maintained at 21%, 35%, 60%, 80%, 100%, and 35% for ∼3 min, just before was changed to a different concentration; ABG results were used as a means of comparison with data continuously recorded through the sensor. The sampling rate was set at 10 Hz.
In a second set of experiments, the linearity of the sensor was assessed at the University of Bristol, School of Veterinary Sciences, where a series of changes (similar to those presented above) were applied before induction of lung injury in three ovine models. Female sheep [weight 69 (2) kg; age ∼18 months] were obtained from a local commercial farm source. For these studies, the sensor was calibrated in vivo, on the basis of standard ABG analysis at baseline (i.e. =21%), and at of 35%; this range of values was chosen because it was associated with values of about 11–20 kPa, where ABG analysis is frequently used. One PMMA sensor was used in each in vivo study (i.e. one for the porcine model, and three for the ovine models, such that a total of four sensors was used).
Detection of within-breath oscillations
To determine whether the sensor was capable of detecting within-breath oscillations, one sheep with lavage-induced lung injury was studied at the School of Veterinary Sciences, University of Bristol, UK. An 18 G catheter was placed in the right cephalic vein and anaesthesia was induced with i.v. midazolam (0.4 mg kg−1) and propofol to effect (∼2 mg kg−1). The trachea was intubated and anaesthesia maintained with isoflurane (∼1% end-tidal) with the Anaconda system (Sedana Medical AB, Stockholm, Sweden). The sheep was positioned in sternal recumbency, morphine (0.15 mg kg−1 i.v.) was administered together with remifentanil or alfentanil infusion. Hartmann's solution was infused i.v. at ∼10 ml kg−1 h−1. Adequacy of anaesthesia was determined by end tidal agent monitoring, the absence of movement, haemodynamic monitoring (heart rate and arterial pressure), and absence of reflexes. A catheter was placed in an auricular artery for arterial pressure measurement. The ECG, direct arterial pressure, , and end-tidal carbon dioxide were monitored throughout. The PMMA sensor was positioned in the carotid artery via a standard arterial catheter (length 8 cm, diameter 0.9 mm), the insertion of which was guided with ultrasound imaging. Ventilation was achieved with a Siemens Servo 900C mechanical ventilator in the pressure-control mode, and adjusted to maintain normocapnia (arterial carbon dioxide tension 4–5 kPa). At this proof-of-concept stage, the respiratory rate was set between 5 and 6 bpm for the detection of oscillations, in agreement with previous studies.6,11,12,21 Although this respiratory rate is not clinically relevant, it was chosen in order to provoke the maximum cyclic recruitment and derecruitment, and hence potentially the greatest oscillations.11,22 Physiological variables were continuously monitored with standard patient monitors (Datex Ohmeda Capnomac Ultima; multi-parameter patient monitor: Datex AS3). Following baseline measurements, warm saline lavages were performed (30 ml kg−1 0.9% NaCl at about 38°C) until a ratio of <13 kPa (98 mm Hg) was achieved, as recorded by standard arterial blood gas analysis.
Statistical analysis
For the linearity tests, values were averaged over the relevant 2 s periods, and compared with the associated ABG results. Results were assessed statistically using analysis of variance (IBM SPSS Statistics for Windows, Version 20.0; Armonk, NY, USA). Comparison between results from standard ABG results and from our sensor was performed with the Bland–Altman analysis.23–25
Results
Results from the response time of the sensor in vitro experiments are presented in the Supplementary material.
values recorded continuously in response to changes in in one anaesthetized, non-heparinized animal (temperature 38°C) and the contemporaneous standard ABG results are shown in Figure 1. The sensor-recorded values matched those measured by ABG analysis, in a range between 10 and 73 kPa, over a period of 37 min. The agreement between results obtained with our sensors and results from the standard ABG analysis, as observed during change experiments, are given in Figure 2. Combining data from ovine and porcine experiments allowed a collection of 39 samples in total. The difference between recorded sensor values and ABG values marginally increased at higher values of . A Bland–Altman analysis is shown in Figure 3, which compares results obtained with the two methods; the bias ratio value appeared small (0.98) with limits of agreement of 0.73 and 1.24.
Fig 1.
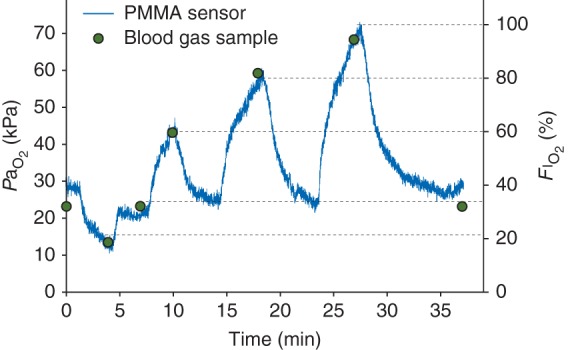
Arterial Po2 responses to step changes in one anaesthetized animal (pig) are plotted against time (sampling rate=10 Hz). The blue line shows recorded by the PMMA sensor, the circles show results from arterial blood gas sampling at 0, 4, 7, 10, 18, 27, and 37 minutes; at these time points was 21, 35, 60, 80, 100, and 35% respectively. The dotted horizontal lines highlight the values at the time when blood samples were taken.
Fig 2.
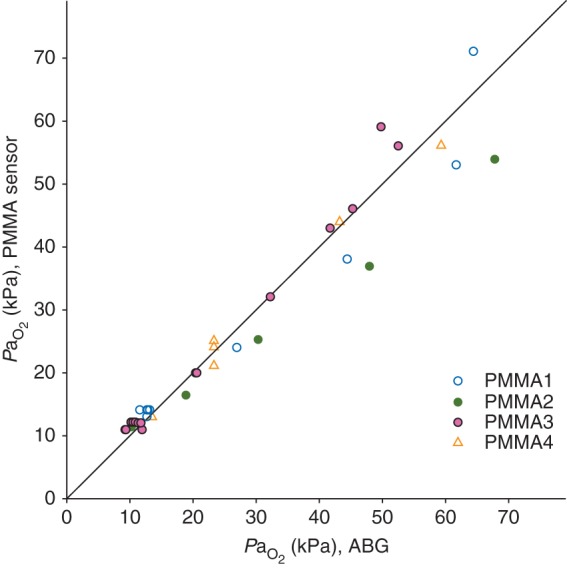
PMMA sensor results (average value for 2 s) plotted against standard ABG analysis results (n=39). Sensors coded PMMA1, PMMA2, and PMMA3 were used in the ovine models; sensor PMMA4 was used in the porcine model. The identity line illustrates the degree of agreement between ABG analysis and the PMMA sensor.
Fig 3.
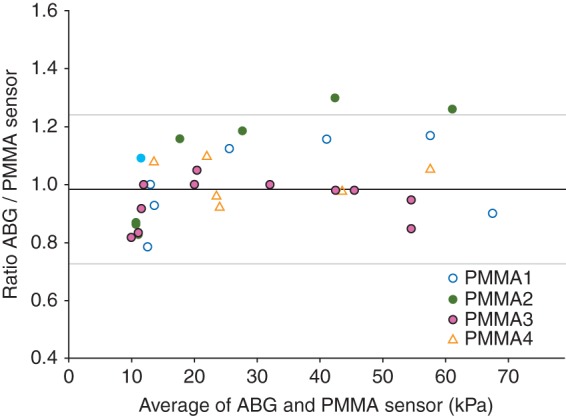
values measured using ABG and the PMMA sensor (n=39) compared by the Bland–Altman plot; the horizontal axis is the paired average, and the vertical axis is the paired ratio (ABG/PMMA). Sensor codes are the same as in given in Figure 2. The middle solid line represents the bias (0.98), and top and bottom grey lines represent the 95% limits of agreement [mean ratio (2 sd); sd was 0.13].
Figure 4 shows the results recorded with the PMMA sensor in the healthy lung study [(green lines, inspired fraction of oxygen (FIO2 = 30%)], where PaO2 remained at about 12 kPa over a series of five breaths. Figure 4 also shows results following lung lavage (blue lines, FIO2 = 100%), where PaO2 oscillations with the same period as respiration were detected in (a) mild, and (b) severe ARDS.
Fig 4.
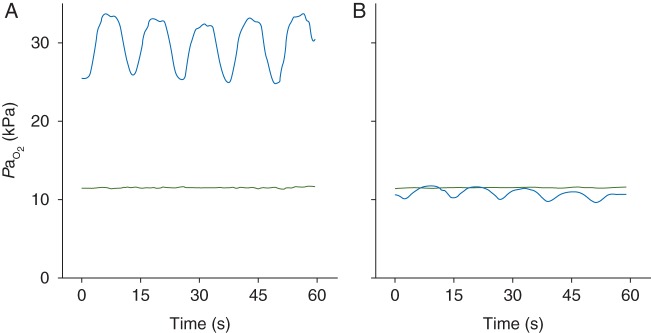
Continuous recordings of for a period of about 1 min in a healthy ovine lung (green line) and after saline lavages (blue line); the inspired oxygen fraction was 30% and 100%, respectively. values are shown for (a) mild and (b) severe ARDS-like conditions. Respiratory rate was 5 bpm in each experiment. oscillations with the same period as breathing were detected in each ARDS model.
Discussion
This study presents the first in vivo applications of a novel, fast intravascular sensor, showing its capacity to track changes over a wide range, covering physiological and pathophysiological levels, and to detect oscillations associated with the respiratory period at levels close to 9 kPa.
These prototype sensors are not produced in series, hence differences in performance may vary considerably between sensors.15,16 In order to avoid uncertainty in the interpretation of physiological results, it is essential that these sensors are tested individually, and that their performance is clearly defined before they are used for physiological studies. This rationale motivated our in vitro tests, where our sensor's response time was sufficiently fast to track the oscillations that are expected to occur in animal models of lung injury. One limitation of this part of the study was in the testing of the response time of the sensor in the gas phase, while the in vivo measurements were performed in the liquid phase (i.e. in whole non-heparinized blood). From a technical perspective, the sensor's response time is independent of the medium that it samples, as it is only a function of oxygen diffusion and solubility within the sensor's matrix. Moreover, we have shown in heparinized whole blood that these sensors are capable of tracking up to 60 oscillations per minute;17 hence, even a relatively slow sensor would be able to follow the oscillations in our in vivo study (i.e. about 5 min−1). The results of these tests in gas (Supplementary Fig. 1) are presented here for future reference, since it will be easier and cheaper to test other prototype sensors in gas rather than the liquid phase.
The sensor's output is temperature-dependent, so calibration needs to be performed at the temperature at which the sensor will operate. In this study, our sensors were calibrated either a posteriori or in vivo, when the temperature was known and stable. These forms of calibrations are standard approaches,22,26,27 although we acknowledge that further work must be done in order to make these sensors more easily usable for clinical settings, where ‘plug-and-play’ devices are more welcome. In general, a two point calibration is only practically useful if the sensor's signal is linear between these two points. The sensor had a very linear response to changes, ranging from clinically relevant, low levels, to rather elevated levels of around 70 kPa; this feature is a technical improvement over currently used optical sensors, which are normally designed to monitor either high or low Po2 levels. In particular, our sensors were in strong agreement with results from standard blood gas analysis for the lower part of the range studied, which is the range that is physiologically and clinically most interesting. As oxygen quenches the fluorescence intensity, the PMMA sensor's signal is intrinsically reduced at high Po2 levels, a technical factor that may have increased the variability of the results and reduced the degree of agreement with standard ABG for values >40 kPa.
Apart from their accuracy, one of the greatest advantages of these fast sensors is their capacity to record continuously, giving the opportunity to study dynamic changes. The preliminary test of the sensor in vivo in a large animal model showed that the sensor accurately and rapidly responded to changes, as confirmed by standard ABG analysis. In response to a rapid change in , the response appeared to be bi-phasic, characterized by an initial rapid phase, followed by a slower one. Although we can only speculate on the implications of this result, it seems possible that ultrafast sensors could provide useful information for respiratory physiology and pathophysiology, in particular with reference to ventilatory distribution and oxygen uptake efficiency even in the absence of atelectasis/recruitment.
Fast response time sensors afford the possibility to detect rapid oscillations within breath in real time, like the oscillations that occur in CA.6,7 In this respect, the novelty of our work does not lay at the proof-of-concept level, but rather in its potential to confirm this phenomenon in humans. Most importantly, to the best of our knowledge, this study is the first to show oscillations in a clinically relevant range; previous studies investigated levels that are much greater than those observed in a clinical scenario.6,11,22,26,27 An alternative approach to assess the degree of variable shunt associated with CA involves standard ABG analysis, where arterial blood is sampled close to the end-inspiratory and end-expiratory stages,13 a procedure that is rather cumbersome and, in our experience, unreliable.
The within-breath variation in levels is thought to be associated with CA, where gas exchange between alveoli and pulmonary circulation is impaired during the expiratory phase of the respiratory cycle, when alveolar collapse occurs.6,7 This conclusion is also supported by dynamic computed tomography, positron emission tomography, and electric impedance tomography studies, showing less or more dense lung regions, presumably indicating aerated or collapsed lung.28–31 As in many previous studies of oscillations in models of CA, one of the limitations of our study was in the lack of direct evidence of lung collapse, which was assumed on the basis of intermittently low values.
The nature of the relationship between the magnitude of oscillations and CA is complex. It is generally accepted that an increase in the magnitude of oscillations is associated with greater recruitment and derecruitment in CA. However, these phenomena must be looked at also in consideration of the mean ; advanced mathematical modelling characterizing associations and relationships between these variables will contribute to a more accurate clinical interpretation of the oscillations. Studies exploring oscillations at high mean levels have the advantage of showing very clear oscillations, larger than the ones shown in this study. This difference in the magnitude of oscillations is observed most likely because at high mean levels, the oxygen–haemoglobin dissociation curve is relatively flat, meaning that small changes in the oxygen content of arterial blood (as would result from alveolar recruitment) would change the oxygen partial pressure considerably. Our study shows that these oscillations are also detectable at a low mean , affording a potential usefulness of the sensor in clinical settings.
In order to test the full potential of these fast sensors in diagnosing CA and in managing mechanical ventilation, further research in large animal models of ARDS is required to facilitate comparison with human adult and paediatric patients. Moreover, whether anatomical and physiological differences between species affect oscillations in ARDS is unclear, so it is becoming more and more urgent to perform such studies in patients with ARDS, and in mechanically ventilated patients.
Supplementary material
Supplementary material is available at British Journal of Anaesthesia online.
Authors' contributions
F.F., A.D.F., and C.E.W.H.: conceived and designed the study; F.F., R.C., H.M., A.D.F., M.M., and P.J.M.: performed the experiments; F.F.: performed the data and statistical analysis; F.F.: prepared the figures; F.F., A.D.F., and C.E.W.H.: interpreted the results of experiments; F.F.: drafted the manuscript; F.F., A.D.F., and C.E.W.H.: edited and revised the manuscript; F.F., R.C., M.M., P.J.M, H.M., A.D.F., and C.E.W.H.: approved the final version of the manuscript.
Declaration of interest
None declared.
Funding
The laboratory and animal work was supported by a Wellcome Trust Translational Award, Wellcome Trust, UK.
Supplementary Material
Acknowledgements
We are grateful for the skilled technical assistance offered by our colleagues Jiri Chvojka, Jan Benes, Lenka Ledvinova, and Vojtech Danihel at the Faculty of Medicine in Pilsen, Czech Republic, Philip Turner at the Department of Physiology, University of Oxford, and Lindsey Duckett at the School of Veterinary Sciences, University of Bristol, UK. We are also grateful to Professor Douglas Altman for his assistance with statistical analysis.
References
- 1.Bergman NA. Cyclic variations in blood oxygenation with the respiratory cycle. Anesthesiology. 1961;22:900–8. doi: 10.1097/00000542-196111000-00006. [DOI] [PubMed] [Google Scholar]
- 2.Folgering H, Smolders FDJ, Kreuzer F. Respiratory oscillations of the arterial PO2 and their effects on the ventilatory controlling system in the cat. Pflugers Arch. 1978;375:1–7. doi: 10.1007/BF00584141. [DOI] [PubMed] [Google Scholar]
- 3.Purves MJ. Fluctuations of arterial oxygen tension which have the same period as respiration. Respir Physiol. 1966;1:281–96. doi: 10.1016/0034-5687(66)90047-8. [DOI] [PubMed] [Google Scholar]
- 4.Purves MJ. Communications. J Physiol. 1965;176:7–8P. [Google Scholar]
- 5.Albert RK. The role of ventilation-induced surfactant dysfunction and atelectasis in causing acute respiratory distress syndrome. Am J Respir Crit Care Med. 2012;185:702–8. doi: 10.1164/rccm.201109-1667PP. [DOI] [PubMed] [Google Scholar]
- 6.Baumgardner JE, Markstaller K, Pfeiffer B, Doebrich M, Otto CM. Effects of respiratory rate, plateau pressure, and positive end-expiratory pressure on PaO2 oscillations after saline lavage. Am J Respir Crit Care Med. 2002;166:1556–62. doi: 10.1164/rccm.200207-717OC. [DOI] [PubMed] [Google Scholar]
- 7.Williams EM, Viale JP, Hamilton RM, McPeak H, Sutton L, Hahn CE. Within-breath arterial PO2 oscillations in an experimental model of acute respiratory distress syndrome. Br J Anaesth. 2000;85:456–9. doi: 10.1093/bja/85.3.456. [DOI] [PubMed] [Google Scholar]
- 8.Hedenstierna G, Frostell C. Animal models for the study of pulmonary edema. In: Hoosier JHaGLV., editor. Handbook of Laboratory Animal Science. Boca Raton, FL: CRC Press; 2004. pp. 289–300. [Google Scholar]
- 9.Hedenstierna G, Nyman G, Frostell C. Animal models of lung physiology during anesthesia. In: Hoosier JHaGLV., editor. Handbook of Laboratory Animal Science. Boca Raton, FL: CRC Press; 2004. pp. 263–87. [Google Scholar]
- 10.Bodenstein M, Wang H, Boehme S, et al. Observation of ventilation-induced Spo2 oscillations in pigs: first step to noninvasive detection of cyclic recruitment of atelectasis? Exp Lung Res. 2010;36:270–6. doi: 10.3109/01902140903575971. [DOI] [PubMed] [Google Scholar]
- 11.Klein KU, Hartmann EK, Boehme S, et al. PaO2 oscillations caused by cyclic alveolar recruitment can be monitored in pig buccal mucosa microcirculation. Acta Anaesthesiol Scand. 2013;57:320–5. doi: 10.1111/aas.12019. [DOI] [PubMed] [Google Scholar]
- 12.Shi C, Boehme S, Hartmann EK, Markstaller K. Novel technologies to detect atelectotrauma in the injured lung. Exp Lung Res. 2011;37:18–25. doi: 10.3109/01902148.2010.501402. [DOI] [PubMed] [Google Scholar]
- 13.Pfeiffer B, Syring RS, Markstaller K, Otto CM, Baumgardner JE. The implications of arterial Po2 oscillations for conventional arterial blood gas analysis. Anesth Analg. 2006;102:1758–64. doi: 10.1213/01.ane.0000208966.24695.30. [DOI] [PubMed] [Google Scholar]
- 14.Yasbin RE, Matthews CR, Clarke MJ. Mutagenic and toxic effects of ruthenium. Chem Biol Interact. 1980;31:355–65. doi: 10.1016/0009-2797(80)90023-x. [DOI] [PubMed] [Google Scholar]
- 15.Baumgardner JE, Otto CM, Markstaller K. Large changes in PaO2 oscillation amplitude with respiratory rate are not measurement artifact. Respir Physiol Neurobiol. 2014;195:59. doi: 10.1016/j.resp.2014.01.013. [DOI] [PubMed] [Google Scholar]
- 16.Formenti F, Farmery AD, Hahn CE. Response to Baumgardner et al. Respir Physiol Neurobiol. 2014;196C:38. doi: 10.1016/j.resp.2014.01.012. [DOI] [PubMed] [Google Scholar]
- 17.Formenti F, Chen R, McPeak H, Matejovic M, Farmery AD, Hahn CE. A fibre optic oxygen sensor that detects rapid PO2 changes under simulated conditions of cyclical atelectasis in vitro. Respir Physiol Neurobiol. 2014;191:1–8. doi: 10.1016/j.resp.2013.10.006. [DOI] [PMC free article] [PubMed] [Google Scholar]
- 18.Chen R, Farmery AD, Obeid A, Hahn CEW. A cylindrical-core fiber-optic oxygen sensor based on fluorescence quenching of a platinum complex immobilized in a polymer matrix. IEEE Sensors J. 2012;12:71–5. [Google Scholar]
- 19.Chen R, Formenti F, Obeid A, Hahn CE, Farmery AD. A fibre-optic oxygen sensor for monitoring human breathing. Physiol Meas. 2013;34:N71–81. doi: 10.1088/0967-3334/34/9/N71. [DOI] [PubMed] [Google Scholar]
- 20.Saied A, Edgington L, Gale L, et al. Design of a test system for fast time response fibre optic oxygen sensors. Physiol Meas. 2010;31:N25–33. doi: 10.1088/0967-3334/31/4/N02. [DOI] [PubMed] [Google Scholar]
- 21.Syring RS, Otto CM, Spivack RE, Markstaller K, Baumgardner JE. Maintenance of end-expiratory recruitment with increased respiratory rate after saline-lavage lung injury. J Appl Physiol. 2007;102:331–9. doi: 10.1152/japplphysiol.00002.2006. [DOI] [PubMed] [Google Scholar]
- 22.Hartmann EK, Boehme S, Bentley A, et al. Influence of respiratory rate and end-expiratory pressure variation on cyclic alveolar recruitment in an experimental lung injury model. Crit Care. 2012;16:R8. doi: 10.1186/cc11147. [DOI] [PMC free article] [PubMed] [Google Scholar]
- 23.Bland JM, Altman DG. Statistical methods for assessing agreement between two methods of clinical measurement. Lancet. 1986;1:307–10. [PubMed] [Google Scholar]
- 24.Bland JM, Altman DG. Measuring agreement in method comparison studies. Stat Methods Med Res. 1999;8:135–60. doi: 10.1177/096228029900800204. [DOI] [PubMed] [Google Scholar]
- 25.Altman DG, Bland JM. Measurement in medicine—the analysis of method comparison studies. Statistician. 1983;32:307–17. [Google Scholar]
- 26.Herweling A, Karmrodt J, Stepniak A, et al. A novel technique to follow fast PaO2 variations during experimental CPR. Resuscitation. 2005;65:71–8. doi: 10.1016/j.resuscitation.2004.04.017. [DOI] [PubMed] [Google Scholar]
- 27.Klein KU, Boehme S, Hartmann EK, et al. Transmission of arterial oxygen partial pressure oscillations to the cerebral microcirculation in a porcine model of acute lung injury caused by cyclic recruitment and derecruitment. Br J Anaesth. 2013;110:266–73. doi: 10.1093/bja/aes376. [DOI] [PubMed] [Google Scholar]
- 28.Borges JB, Costa EL, Suarez-Sipmann F, et al. Early inflammation mainly affects normally and poorly aerated lung in experimental ventilator-induced lung injury. Crit Care Med. 2014;42:e279–87. doi: 10.1097/CCM.0000000000000161. [DOI] [PubMed] [Google Scholar]
- 29.Derosa S, Borges JB, Segelsjo M, et al. Reabsorption atelectasis in a porcine model of ARDS: regional and temporal effects of airway closure, oxygen, and distending pressure. J Appl Physiol (1985) 2013;115:1464–73. doi: 10.1152/japplphysiol.00763.2013. [DOI] [PubMed] [Google Scholar]
- 30.Markstaller K, Eberle B, Kauczor HU, et al. Temporal dynamics of lung aeration determined by dynamic CT in a porcine model of ARDS. Br J Anaesth. 2001;87:459–68. doi: 10.1093/bja/87.3.459. [DOI] [PubMed] [Google Scholar]
- 31.Markstaller K, Kauczor HU, Weiler N, et al. Lung density distribution in dynamic CT correlates with oxygenation in ventilated pigs with lavage ARDS. Br J Anaesth. 2003;91:699–708. doi: 10.1093/bja/aeg246. [DOI] [PubMed] [Google Scholar]
Associated Data
This section collects any data citations, data availability statements, or supplementary materials included in this article.