

Significance
We established a minimum competing endogenous RNA (ceRNA) model to quantitatively analyze the behavior of the ceRNA regulation and implemented multifluorescent synthetic gene circuits in cultured human cells to validate our predictions. Our results suggested that the ceRNA effect is affected by the abundance of microRNA (miRNA) and ceRNAs, the number and affinity of binding sites, and the mRNA degradation pathway determined by the degree of miRNA–mRNA complementarity. Furthermore, we found that a nonreciprocal competing effect between partial and perfect complementary targets is mainly due to different miRNA loss rates in these two types of repressions, which sheds light on utilizing such a competing model for rational design of effective siRNA.
Keywords: microRNA regulation, competing endogenous RNA, quantitative biology, RNA interference efficiency, synthetic gene circuits
Abstract
Competing endogenous RNAs (ceRNAs) cross-regulate each other at the posttranscriptional level by titrating shared microRNAs (miRNAs). Here, we established a computational model to quantitatively describe a minimum ceRNA network and experimentally validated our model predictions in cultured human cells by using synthetic gene circuits. We demonstrated that the range and strength of ceRNA regulation are largely determined by the relative abundance and the binding strength of miRNA and ceRNAs. We found that a nonreciprocal competing effect between partially and perfectly complementary targets is mainly due to different miRNA loss rates in these two types of regulations. Furthermore, we showed that miRNA-like off targets with high expression levels and strong binding sites significantly diminish the RNA interference efficiency, but the effect caused by high expression levels could be compensated by introducing more small interference RNAs (siRNAs). Thus, our results provided a quantitative understanding of ceRNA cross-regulation via shared miRNA and implied an siRNA design strategy to reduce the siRNA off-target effect in mammalian cells.
MicroRNAs (miRNAs) are a class of ∼22-nt short noncoding RNAs that are loaded onto RNA-induced silencing complexes (RISC) and subsequently bind to their target RNAs. In mammalian cells, the perfect pairing of miRNA to target RNAs causes RNA cleavage through the RNA interference (RNAi) pathway, whereas partial pairing results in translational repression and RNA destabilization (1, 2). miRNA-mediated regulation can be triggered by only 6-nt complementarity of the miRNA 5′-end “seed region” to the target RNA, which confers each miRNA species the capacity to interact with multiple RNA species, including gene-coding mRNAs (3, 4), long noncoding RNAs (5), and circular RNAs (6). Similarly, each RNA species can interact with multiple miRNA species through various miRNA response elements (MREs) (7).
The complex interaction network of miRNAs and their target RNAs has been shown to allow indirect cross-regulation between different competing endogenous RNAs (ceRNAs) by sequestering shared miRNAs, which is essential for regulating many biological functions (7). The strength of ceRNA regulation is largely determined by the relative abundance and binding strength of ceRNAs and miRNAs and whether the miRNA-bound ceRNA decays through a stoichiometric mechanism or a catalytic mechanism (8–10). The threshold-like behavior of the ceRNA regulation has been experimentally observed by measuring the abundance of two ceRNAs, phosphatase and tensin homolog (PTEN) and vesicle-associated membrane protein (VAMP)-associated protein A (VAPA) across various cell lines (8). Nevertheless, many quantitative predictions deduced from miRNA–ceRNA computational models have not been experimentally validated. Another intriguing question is whether the miRNA-mediated catalytic mechanism can be affected by the miRNA-mediated stoichiometric mechanism through a ceRNA effect or vice versa.
Currently, the ability to systematically elucidate features of the ceRNA effect is impeded by the complexity of natural miRNA–ceRNA regulatory networks. Synthetic biology provides a complementary approach to investigate miRNA-mediated regulations in a controlled and largely isolated biological setting by using engineered genetic circuits (11). Synthetic circuits have been constructed to help elucidate the underlying design principles of network motifs that combine transcriptional and miRNA-mediated regulations (12–14). It has also been demonstrated that miRNAs can generate a threshold in target gene expression by using a bidirectional reporter assay in mammalian cells (15). However, construction and implementation of a complex synthetic gene circuit in mammalian cells to experimentally investigate the aforementioned ceRNA effect remain a great challenge.
In this study, we aimed to obtain a comprehensive and quantitative understanding of miRNA regulation principles on competing RNAs. First, we formulated a coarse-grained model for a minimum miRNA–ceRNA system composed of one miRNA species and two competing RNA targets. Then, we engineered and implemented a corresponding genetic circuit in cultured human embryonic kidney 293 (HEK293) cells to quantify the ceRNA effect under various conditions by using a multifluorescent flow cytometry. Based on computational and experimental results, we demonstrated that the relative abundance of miRNAs and competing RNAs, the miRNA–target binding free energy, and the number of MREs have strong impacts on miRNA-mediated ceRNA regulation in suitable molecular environments. Furthermore, we proposed a special ceRNA system consisting of one target with partially paired MREs (miRNA-type target) and the other one with perfectly paired MREs (RNAi-type target). We found a nonreciprocal competition between partially and perfectly complementary targets that share the same miRNA species. This competing effect was largely due to the low miRNA loss rate in RNAi-type regulation and the high miRNA loss rate in miRNA-type regulation. In addition, we demonstrated that the RNAi efficiency of siRNA can be significantly reduced by miRNA-like off targets with high expression levels and strong binding sites. Increasing siRNA concentrations diminished the competing effect caused by highly expressed off targets, but severely repressed off targets with strong binding sites. This finding provided us an siRNA design strategy to reduce the siRNA off-target effect.
Results
Minimum miRNA–ceRNA Model and Experimental Design.
To analyze the quantitative behavior of the ceRNA effect, we established a minimum miRNA–ceRNA model in which two mRNA species are regulated by one miRNA species (Fig. 1A). This model was inspired by previous quantitative studies on the repression of small RNA in bacteria (16), miRNA regulation on a single target in mammalian cells (15), and in silico simulations on ceRNA effects (8). Following Mukherji et al. (15), we assumed that only the free mRNAs that are not bound by miRNAs can translate into proteins, and the protein concentration is proportional to the free mRNA concentration at the steady state. Therefore, the difference between the protein levels at the steady state with or without the competing RNA regulation indicates the strength of the ceRNA effect.
Fig. 1.

Minimum miRNA–ceRNA model and experimental design. (A) The minimum miRNA–ceRNA model. The parameters are described in detail in SI Materials and Methods. (B) Schematic representation of a minimal miRNA–ceRNA synthetic gene circuit. Arrows represent up-regulation; lines with bars designate down-regulation. For simplicity, all adjacent miRNA response elements (MREs) in the 3′-UTR region are shown as a green box.
Using a similar mathematical framework that has been used to study the threshold effect of miRNA and small RNA regulation (15, 16), we described the minimal ceRNA model (Fig. 1A) with a set of differential equations (SI Materials and Methods). We solved the equations for the concentration of free ceRNA1 and ceRNA2 mRNA species in the steady state as
where
For simplicity, lumped parameters R0, λ, θ, and φ were introduced. Assuming that gi, , gs, ki−, and αi are fixed quantities, is proportional to ki+, and is proportional to miRNA transcription rate kS. Compared with the previous model of a single-target system (15, 16), a major difference was the addition of , which indicated the regulation by ceRNA j upon ceRNA i. The parameter α () was introduced to represent the probability that a miRNA is destroyed after degrading its target (miRNA loss rate) (8, 9). When α = 1, miRNA is degraded via a stoichiometric interaction with its target RNA; when α = 0, miRNA is fully recycled through a catalytic interaction with its target.
To study the quantitative behavior of the ceRNA effect in a controlled manner, we designed a synthetic gene circuit based on our computational model (Fig. 1B). miR-21 that barely expresses in HEK293 cells (17) was cloned into a synthetic intron in the 3′-UTR of a near-infrared fluorescent protein (iRFP) gene, using a similar method to that described previously (13, 18). Four tandem repeats of miR-21 target sites (MREs) were fused to the 3′-UTRs of both red fluorescent protein (mKate, ceRNA1) and enhanced yellow fluorescent protein (EYFP, ceRNA2) genes that are driven by a constitutive human elongation factor 1α (hEF1α) promoter and a doxycycline (Dox) inducible promoter (pTRE), respectively. The monomeric blue fluorescent protein (TagBFP) gene driven by a constitutive promoter that is called the CAG promoter (hybrid promoter combing cytomegalovirus immediate-early gene enhancer, chicken β-actin promoter, 5′-flanking sequence, and the first intron sequence with a modified splice acceptor sequence derived from the rabbit β-globin gene) was used as an internal control (Table S1). In this experimental setup, we hypothesized that the level of miR-21 and the mRNA levels of mKate, EYFP, and TagBFP respectively correlate with the corresponding protein levels, as approximated by the corresponding fluorescent intensities.
Next, we introduced the plasmid DNAs that encode the synthetic circuit into HEK293 cells by transient cotransfection and simultaneously measured iRFP, mKate, EYFP, and TagBFP fluorescent intensities by using fluorescence-activated cell sorting (FACS) analysis at 48 h posttransfection. First, we confirmed that the mKate, EYFP, iRFP, and TagBFP fluorescent intensities linearly correlate with the corresponding miRNA/mRNA levels in the log–log scale (Fig. S1). Second, to capture the general trend of the transfected cell population with noisy gene expression, we binned individual cells based on TagBFP levels and then calculated the mean EYFP and mKate levels in each bin. We confirmed that in the absence of the synthetic miR-21, both mKate and EYFP mean values linearly correlated with TagBFP mean values in the log–log scale (Fig. S1B). These results suggested that the TagBFP level is an appropriate indicator for the ceRNAs’ transcription rate in our experimental setup (SI Materials and Methods). Next, we gated individual cells based on iRFP levels to a relatively narrow range to ensure that the synthetic miR-21 level is roughly constant in cells with different TagBFP fluorescent levels (Fig. S2) and compared the difference of the mKate level with or without Dox to evaluate the underlying miRNA–ceRNA regulation under various experimental conditions.
miRNA–ceRNA Relative Abundance Determines the Range and the Magnitude of the ceRNA Derepression Effect.
To investigate whether relative abundance between miRNA and ceRNA can influence the ceRNA regulation, we performed computational simulations using our minimal miRNA–ceRNA model with a varying parameter that indicates different miRNA expression level. The results showed that the ceRNA2-mediated ceRNA1 derepression occurs at a certain range relative to the ceRNA1 transcription level (Fig. 2A). Along with the increase of miRNA level, a higher ceRNA1 transcription level was needed to achieve the strongest ceRNA regulation, and the ceRNA2-mediated derepression of ceRNA1 became stronger as indicated by the fold change of ceRNA1 protein level between the systems with and without ceRNA2 (Fig. 2A).
Fig. 2.

Effect of miRNA relative abundance on ceRNA regulation. (A) Simulated protein1 level as a function of ceRNA1 transcriptional level at indicated miRNA levels, respectively. We assumed that the transcriptional level of ceRNA2 is proportional to that of ceRNA1 in simulations and experiments. Red lines designate the predicted protein1 levels in a system with only ceRNA1; blue lines represent the predicted protein1 levels in a system with both ceRNA1 and ceRNA2. Right panel shows the predicted fold change of protein1 between the systems with and without ceRNA2. (B) The sequences of MRE PDCD4 with its binding free energy to miR-21. (C) The ceRNA effect in a miRNA gradient experiment. The amounts of iRFP-encoding plasmid DNA used in transfection experiments are indicated on the top of each panel. Each red or blue circle shows the median mKate value of 150 FACS cell events in each bin sorted by the TagBFP value in the absence or the presence of Dox, respectively; red and blue lines denote the model-fitted mKate values in the absence and the presence of Dox, respectively. Model-fitted values are indicated in each panel. (D) Model-fitted values are proportional to the measured iRFP intensities. An R2 value indicates the degree of correlation. a.u., arbitrary units. Each data point shows mean ± SD from three independent replicates.
To verify our computational results, we controlled miRNA expression level by introducing varying amounts of iRFP plasmid DNA into HEK293 cells (Table S2 and Fig. S2). We cloned four tandem repeats of a moderate strength miR-21 MRE found in the programmed cell death protein 4 (PDCD4) gene (Fig. 2B), which is one of the experimentally verified miR-21 targets (19), to the 3′-UTR of mKate (ceRNA1) and EYFP (ceRNA2).
When ceRNA2 did not express, the system resembled the previous system with a single miRNA species and a single target species (15), and the increase of miRNA levels caused the miRNA repression threshold to shift to the higher target gene transcriptional level (red circles in Fig. 2C). Consistent with the model predictions, the Dox induction of ceRNA2 expression resulted in an obvious increase of mKate fluorescent level, and the range with clear ceRNA-mediated derepression effect shifted to higher ceRNA1 transcription levels while the miRNA level increased (Fig. 2C). In addition, the iRFP fluorescent value and the fitted parameter that theoretically indicates miRNA expression level were linearly correlated with an R2 of 0.99 (Fig. 2D).
The Binding Strength Between mRNA and miRNA Influences the ceRNA Regulation Efficiency.
Next, we performed computational simulations using our minimal miRNA–ceRNA model with a varying parameter that indicates various binding strengths of MREs. The results demonstrated that the miRNA–target binding strength strongly influenced the ceRNA regulation efficiency, but did not distinctly change the range of effective ceRNA-mediated derepression (Fig. 3A). Two main factors that may affect miRNA–target binding strength are the number of MREs in a given ceRNA and the free energy of miRNA–target hybridization (). We first cotransfected ceRNA1 along with ceRNA2 containing 0, 1, 4, 8, and 12 PDCD4 MREs, respectively into HEK293 cells (Table S2). As shown in Fig. 3B, differential mKate fluorescent levels could be observed only when introducing ceRNA2 with miR-21 MREs, and the derepression effect was more pronounced when ceRNA2 contained more PDCD4 MREs. Consistent with the previous finding obtained by using the one-miRNA–one-target system (15), the number of PDCD4 MREs in ceRNA2 was linearly correlated to the model-fitted parameter with a R2 of 0.99 (Fig. 3C). Next, we cloned six different experimentally verified miR-21 target sites with various predicted binding free energies (20) into the 3′-UTR of ceRNA2 (EYFP-expressing construct), respectively (Figs. 2B and 3D). As shown in Fig. 3E, when the MRE in ceRNA2 had a higher binding affinity, a stronger ceRNA effect was observed. In addition, the binding free energy () and the log-transformed value were linearly correlated with an R2 of 0.83 (Fig. 3F). This observation concurs with a recent report that the magnitude of derepression correlates with the number and binding efficacy of the MREs on the ceRNA (21). In agreement with the model prediction (Fig. 3A), the range relative to the ceRNA1 transcriptional level that showed a derepression effect was largely unchanged in both experiments (Fig. 3 B and E).
Fig. 3.
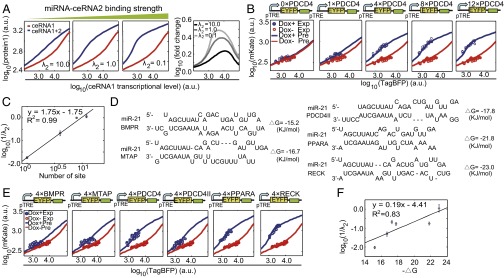
Effect of miRNA–target binding strength on ceRNA regulation. (A) Simulated protein1 level as a function of ceRNA1 transcriptional level in the presence of ceRNA2 containing MREs with the indicated binding strength. We assumed that the transcriptional level of ceRNA2 is proportional to that of ceRNA1 in simulations and experiments. MiRNA transcriptional level is equal in each panel. Right panel shows the fold change of protein1 between the system with ceRNA2 (blue line) and the system without ceRNA2 (red line). (B) The impact of MRE repeat number on the ceRNA effect. The numbers of PDCD4-type MREs are indicated on the schematic of ceRNA2 genes. (C) Model-fitted parameter is proportional to the number of MREs. (D) The sequences of five different types of MREs with various binding free energies to miR-21. (E) The impact of MRE binding free energy on the ceRNA effect. (F) Model-fitted parameter is proportional to binding free energy. Annotations for B and E are the same as described in Fig. 2C. Each data point in C and F shows mean ± SD from three independent replicates.
ceRNA Enhances the Threshold Behavior of miRNA Repression.
Next, we analyzed miRNA dose–response curves to study whether expression of EYFP (ceRNA2) can influence the miRNA repression efficacy on the level of mKate (ceRNA1). Both computational simulations (Fig. 4A) and experimental results (Fig. 4B) suggested that the mKate level is not sensitive to miRNA expression changes when the miRNA level is below a certain concentration, but responds sensitively when the miRNA level is larger than this threshold. Interestingly, elevated EYFP expression not only shifted the threshold to a higher miRNA level, but also caused the mKate level to be more sensitive to the miRNA level changes around the threshold. For example, repressing of mKate levels from 50% to 16% required 2.8-fold, 2-fold, and 1.4-fold more miR-21 for the samples transfected with 0 ng, 50 ng, and 80 ng EYFP plasmid DNA, respectively (Fig. 4B). This observation suggested that competing RNAs that sequester free miRNAs could enhance the switch-like miRNA regulation on target genes that have expression levels near the threshold.
Fig. 4.

CeRNA enhances the threshold behavior of miRNA repression. (A) Simulated ceRNA1 protein level as a function of miRNA level in the condition of different ceRNA2 expression levels. ceRNA1 transcriptional level is set to be a constant. Bottom shows the first-order derivative (logarithm gain) of the corresponding miRNA dose–response curve in the Top. (B) mKate (ceRNA1) level as a function of iRFP (miRNA) expression level in experiments with different amounts of transfected EYFP plasmid DNA. Each circle shows the relative mKate value, which is calculated as the mKate fluorescent value in the presence of synthetic miR-21 divided by the mKate fluorescent value in the first bin that synthetic miR-21 barely expressed. iRFP (miRNA) fold changes that further repress mKate from 50% to 16% relative level are marked on the plot. Each data point shows mean ± SD from three independent replicates.
Nonreciprocal Competition Effect Between Partially and Perfectly Paired Targets.
The degree of complementarity of a miRNA/siRNA to its target site determines whether the RISC enters into either a miRNA-type or a RNAi-type repression pathway (1). To assay whether these two types of regulations interfere with each other when both regulations share the same miRNA/siRNA species, we constructed a variant ceRNA system that consists of the mKate-encoding ceRNA1 with MREs partially paired to miR-21 and the EYFP-encoding ceRNA2 with MREs perfectly paired to miR-21 (Fig. 5A). Interestingly, ceRNA2 that contained partially paired MREs caused an obvious change on ceRNA1’s miRNA dose–response curve, whereas introducing ceRNA2 with perfectly complementary MREs hardly affected miRNA repression efficacy on ceRNA1 (Fig. 5B).
Fig. 5.
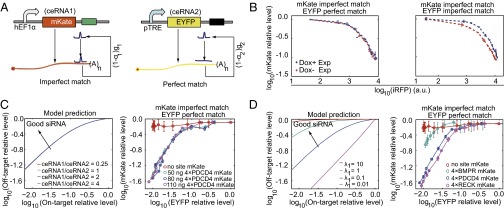
The variant ceRNA system with partially paired and perfectly paired targets. (A) Schematic representation of the variant ceRNA system. mKate (ceRNA1) contains four partially paired PDCD4 MREs, and the EYFP (ceRNA2) harbors four perfectly paired MREs. (B) The interference between RNAi-type and miRNA-type regulations. Each red or blue circle shows the relative mKate value, which is calculated as the mKate value in the presence of synthetic miR-21 divided by the mKate value without expressing the synthetic miR-21. (C) The influence of off-target expression levels on the on-target–off-target repression curve, where the EYFP relative expression level is used as the abscissa value and the mKate relative expression level is used as the ordinate value (Fig. S4). (D) The influence of the off target with various binding strengths. C and D, Left show simulation results. C and D, Right display the results obtained from transient cotransfection experiments with the indicated amount of the PDCD4-containing mKate construct (C) or mKate constructs harboring different types of MREs (D). Each data point shows mean ± SD from three independent replicates.
It has been shown that partially and perfectly paired targets have a similar disassociation rate in mammalian cells (22). Therefore, we conducted computational simulations to analyze whether the other parameters contribute to the nonreciprocal competition between two types of regulations, including the miRNA–target association rate k+, the degradation rate g of the miRNA–target complex, and the miRNA loss rate α. Interestingly, our simulation results suggested that this nonreciprocal competition was mainly caused by the difference in the parameter α, but not the parameter k+ or g (Fig. S3). By fitting the model to our experimental data, we estimated that the loss rate for miRNA-type repression is about five times higher than that for RNAi-type repression in our experimental configuration (SI Materials and Methods).
Deduced Design Principles for Efficient RNAi Repression Based on the Variant ceRNA System.
The repression of unintended genes through partial pairing is a major obstacle for RNAi applications (23). Previous studies have suggested that off-target gene expression level (24) and thermodynamic stability (25) of off-target binding sites can influence the RNAi efficiency. In our variant ceRNA system, ceRNA1 mimics the off target repressed through miRNA-type regulation, whereas ceRNA2 can be regarded as the intended target under RNAi-type regulation. As shown in Fig. S4A, the repression efficiency on miRNA-type and RNAi-type targets at different miRNA concentrations varied dramatically. Ideally, we can use this property to design siRNA with a proper concentration that can efficiently repress the on-target RNA but have much less effect on the off-target RNA. We introduced the on-target–off-target relative repression plot (Fig. S4) to better represent the down-regulation efficiency of on target and off target at different miRNA expression levels. A point near the top left corner of the plot in Fig. S4B indicates a certain siRNA/miRNA level that can efficiently repress the on target without substantial effect on the off target. As shown in Fig. 5C, changing the mKate-encoding off-target levels did not influence the shape of the relative repression curve, suggesting that although increasing the off-target level might weaken the siRNA efficiency at a given siRNA concentration (24), introducing additional siRNAs could completely compensate this effect. In contrast, altering off-target binding strength strongly influenced the shape of the relative repression curve (Fig. 5D). This result indicated that the off target with high-affinity binding sites weakens siRNA efficiency on the target RNA, and increasing siRNA concentration severely repressed the off-target RNA with high-affinity binding sites.
Impact on Endogenous miR-21 Targets.
To study the influence of the synthetic ceRNAs on the endogenous miR-21 targets, we performed RNA sequencing on the transfected HEK293 cells that expressed TagBFP at low, medium, and high levels with or without Dox. As expected, the mRNA level of the transfected genes as measured by fragments per kilobase of transcript per million mapped reads value increased gradually while TagBFP levels increased (Fig. S5A). In the low-TagBFP group, the synthetic genes’ expression level was comparable to that of the highly expressed endogenous transcripts, whereas in the medium-TagBFP and high-TagBFP groups, the EYFP RNA levels were higher than those of endogenous transcripts. This observation was confirmed by an independent quantitative RT (qRT)-PCR experiment (Fig. S5B). These results suggested that in general, the synthetic genes expressed in the high range of the transcriptome. In addition, low EYFP expression generated a subtle effect on mKate or miR-21 endogenous targets predicted by TargetScan (26) (Fig. S5C). At the medium and high EYFP levels, both mKate and the majority of endogenous miR-21 targets were significantly up-regulated. However, most target genes showed only less than twofold derepression, and only a few target genes induced more than fourfold.
Discussion
In this work, we applied a model-guided synthetic biology approach to quantitatively analyze the behavior of miRNA-mediated ceRNA regulation. Consistent with recent computational simulations (8–10), our results suggested that the ceRNA network operates in a highly quantitative manner. We showed that the relative miRNA level and binding strength of miRNA to its MREs determined the properties of the ceRNA effect. Notably, miRNA concentration influences both the range and the strength of ceRNA regulation (Fig. 2A), whereas binding strength mainly influences the magnitude of derepression but not the range of the ceRNA effect (Fig. 3A).
Our data suggested that significant relieving of miRNA repression could be observed only when introducing a large amount of ceRNA transcripts. This observation is consistent with a recent study on miR-122 in mouse liver cells (21). A possible explanation is that in the scenario of ceRNA regulation, the MREs introduced by a ceRNA species will compete for miRNA binding with all of the other binding sites of the miRNA species in the cell. Thus, to generate a significant derepression effect through ceRNA regulation, the amount of MREs provided by the ceRNA species need to be comparable to the total number of binding sites in the transcriptome. According to this hypothesis, although the ceRNA regulation could be widespread (3), in most cases, such a regulation generates only a weak derepression effect (21). Dramatic ceRNA-mediated derepression may be mainly restricted to highly expressed long noncoding RNAs, circular RNAs, or transcripts in specific physiological or disease conditions (27).
Each single miRNA species in a mammalian cell could bind to hundreds or even thousands of target genes, whereas most of these targets show only moderate repression by the miRNA. One prevailing hypothesis posits that miRNAs “tune” the expression of most targets but do not primarily act at the gene-to-gene level. However, there are also many examples suggesting that the phenotype generated by knocking out a miRNA species could be recovered by manipulating the expression of only a few target genes (28). Thus, an alternative explanation is that there are a few primary target genes heavily regulated by miRNAs, whereas the other weak targets titrate only the effective concentration of the miRNA available to bind these highly regulated targets (29). Our work suggested that the widespread MREs could act as a pool of sponges to sequester shared miRNAs and enhance the threshold behavior of miRNA repression for targets that have expression levels around the threshold, thus increasing the sensitivity of miRNA regulation on these primary targets. During the revision of this paper, a theoretical study further supported this hypothesis (27).
Directly measuring the miRNA loss rate is a great challenge due to experimental difficulties (30). Although recent in silico studies have predicted that the loss rate can strongly influence ceRNA effect in the steady state (8, 9), the loss rate for miRNA regulation is largely unknown. Previous studies have estimated this parameter ranging from a pure stoichiometric to almost a full catalytic mechanism (8, 9, 22, 30, 31). In this work, we constructed a variant ceRNA system containing one partially paired (miRNA-type) target and one perfectly paired (RNAi-type) target. We found a nonreciprocal crosstalk between these two types of regulations in mammalian cells. Our experimental results coupled with model simulations suggested that the RNAi-type repression has a loss rate about five times less than that for miRNA-type repression, which to our best knowledge has not been reported previously. Furthermore, we deduced principles for designing siRNAs that can effectively repress an on-target gene with a less off-target effect. Interestingly, we found that the influence of a high off-target gene expression level can be compensated by introducing a suitable amount of siRNAs, whereas off-target gene sequence with strong binding strength should be avoided.
Endogenous gene regulatory networks are complex and hard to perturb, which makes it extremely difficult to understand their behaviors in a quantitative way. On the other hand, our work and several recent publications demonstrated that synthetic gene circuits offer a powerful tool, in a largely controlled manner, to understand the fundamental design principles of complex cellular systems (12, 13, 15). Although the synthetic circuit used in our study could not be fully isolated from the cellular environment because natural miR-21 targets may compete with the synthetic ceRNAs, our model deviation suggested that taking endogenous miR-21 targets into account rescales only the parameter in our computational model but does not change any of our conclusions (SI Materials and Methods). In addition, our efforts also shed light on using such a model for rational design of an effective RNAi experiment to reduce the siRNA off-target effect.
Materials and Methods
A detailed description of experimental procedures used in this study (cell culture, plasmid construction, cell transfection, FACS measurement (Fig. S6), RNA extraction, qTR-PCR, RNA sequencing analysis, and data analysis procedures) is available in SI Materials and Methods. Lists of primers are available in Table S1. Plasmid concentrations used in experiments are available in Table S2. Fitted model parameters are shown in Table S3.
Supplementary Material
Acknowledgments
We thank Lei Wei for technical assistance. This work was supported by the National Basic Research Program (2012CB316503, to M.Q.Z. and X.W.), the National Natural Science Foundation (61322310 and 31371341, to X.W.; and 91019016, to M.Q.Z.), the Foundation for the Author of National Excellent Doctoral Dissertation (201158, to X.W.) of China, Outstanding Tutors for doctoral dissertations of Science and Technology project in Beijing (20111000304, to Y.L.), the Junior “1000 Plan” Program (Z.X.), and a Tsinghua National Laboratory for Information Science and Technology Outstanding Scholar Award (to Z.X.).
Footnotes
The authors declare no conflict of interest.
This article is a PNAS Direct Submission.
Data deposition: The RNA sequencing data reported in this paper have been deposited in the NCBI Sequence Read Archive, www.ncbi.nlm.nih.gov/sra/ (accession no. SRP052983).
This article contains supporting information online at www.pnas.org/lookup/suppl/doi:10.1073/pnas.1413896112/-/DCSupplemental.
References
- 1.Hutvágner G, Zamore PD. A microRNA in a multiple-turnover RNAi enzyme complex. Science. 2002;297(5589):2056–2060. doi: 10.1126/science.1073827. [DOI] [PubMed] [Google Scholar]
- 2.Bartel DP. MicroRNAs: Target recognition and regulatory functions. Cell. 2009;136(2):215–233. doi: 10.1016/j.cell.2009.01.002. [DOI] [PMC free article] [PubMed] [Google Scholar]
- 3.Sumazin P, et al. An extensive microRNA-mediated network of RNA-RNA interactions regulates established oncogenic pathways in glioblastoma. Cell. 2011;147(2):370–381. doi: 10.1016/j.cell.2011.09.041. [DOI] [PMC free article] [PubMed] [Google Scholar]
- 4.Karreth FA, et al. In vivo identification of tumor-suppressive PTEN ceRNAs in an oncogenic BRAF-induced mouse model of melanoma. Cell. 2011;147(2):382–395. doi: 10.1016/j.cell.2011.09.032. [DOI] [PMC free article] [PubMed] [Google Scholar]
- 5.Cesana M, et al. A long noncoding RNA controls muscle differentiation by functioning as a competing endogenous RNA. Cell. 2011;147(2):358–369. doi: 10.1016/j.cell.2011.09.028. [DOI] [PMC free article] [PubMed] [Google Scholar]
- 6.Hansen TB, et al. Natural RNA circles function as efficient microRNA sponges. Nature. 2013;495(7441):384–388. doi: 10.1038/nature11993. [DOI] [PubMed] [Google Scholar]
- 7.Tay Y, Rinn J, Pandolfi PP. The multilayered complexity of ceRNA crosstalk and competition. Nature. 2014;505(7483):344–352. doi: 10.1038/nature12986. [DOI] [PMC free article] [PubMed] [Google Scholar]
- 8.Ala U, et al. Integrated transcriptional and competitive endogenous RNA networks are cross-regulated in permissive molecular environments. Proc Natl Acad Sci USA. 2013;110(18):7154–7159. doi: 10.1073/pnas.1222509110. [DOI] [PMC free article] [PubMed] [Google Scholar]
- 9.Bosia C, Pagnani A, Zecchina R. Modelling competing endogenous RNA networks. PLoS ONE. 2013;8(6):e66609. doi: 10.1371/journal.pone.0066609. [DOI] [PMC free article] [PubMed] [Google Scholar]
- 10.Figliuzzi M, Marinari E, De Martino A. MicroRNAs as a selective channel of communication between competing RNAs: A steady-state theory. Biophys J. 2013;104(5):1203–1213. doi: 10.1016/j.bpj.2013.01.012. [DOI] [PMC free article] [PubMed] [Google Scholar]
- 11.Xie Z, Wroblewska L, Weiss R. RNAi synthetic logic circuits for sensing, information processing, and actuation. In: Meyers RA, editor. Encyclopedia of Molecular Cell Biology and Molecular Medicine. Wiley; Hoboken, NJ: 2014. pp. 1–23. [Google Scholar]
- 12.Siciliano V, et al. MiRNAs confer phenotypic robustness to gene networks by suppressing biological noise. Nat Commun. 2013;4:2364. doi: 10.1038/ncomms3364. [DOI] [PMC free article] [PubMed] [Google Scholar]
- 13.Bleris L, et al. Synthetic incoherent feedforward circuits show adaptation to the amount of their genetic template. Mol Syst Biol. 2011;7:519. doi: 10.1038/msb.2011.49. [DOI] [PMC free article] [PubMed] [Google Scholar]
- 14.Xie Z, Wroblewska L, Prochazka L, Weiss R, Benenson Y. Multi-input RNAi-based logic circuit for identification of specific cancer cells. Science. 2011;333(6047):1307–1311. doi: 10.1126/science.1205527. [DOI] [PubMed] [Google Scholar]
- 15.Mukherji S, et al. MicroRNAs can generate thresholds in target gene expression. Nat Genet. 2011;43(9):854–859. doi: 10.1038/ng.905. [DOI] [PMC free article] [PubMed] [Google Scholar]
- 16.Levine E, Zhang Z, Kuhlman T, Hwa T. Quantitative characteristics of gene regulation by small RNA. PLoS Biol. 2007;5(9):e229. doi: 10.1371/journal.pbio.0050229. [DOI] [PMC free article] [PubMed] [Google Scholar]
- 17.Landgraf P, et al. A mammalian microRNA expression atlas based on small RNA library sequencing. Cell. 2007;129(7):1401–1414. doi: 10.1016/j.cell.2007.04.040. [DOI] [PMC free article] [PubMed] [Google Scholar]
- 18.Kashyap N, Pham B, Xie Z, Bleris L. Transcripts for combined synthetic microRNA and gene delivery. Mol Biosyst. 2013;9(7):1919–1925. doi: 10.1039/c3mb70043g. [DOI] [PMC free article] [PubMed] [Google Scholar]
- 19.Chen Y, et al. MicroRNA-21 down-regulates the expression of tumor suppressor PDCD4 in human glioblastoma cell T98G. Cancer Lett. 2008;272(2):197–205. doi: 10.1016/j.canlet.2008.06.034. [DOI] [PubMed] [Google Scholar]
- 20.Kruger J, Rehmsmeier M. RNAhybrid: microRNA target prediction easy, fast and flexible. Nucleic Acids Res. 2006;34(web server issue):W451–W454. doi: 10.1093/nar/gkl243. [DOI] [PMC free article] [PubMed] [Google Scholar]
- 21.Denzler R, Agarwal V, Stefano J, Bartel DP, Stoffel M. Assessing the ceRNA hypothesis with quantitative measurements of miRNA and target abundance. Mol Cell. 2014;54(5):766–776. doi: 10.1016/j.molcel.2014.03.045. [DOI] [PMC free article] [PubMed] [Google Scholar]
- 22.Wee LM, Flores-Jasso CF, Salomon WE, Zamore PD. Argonaute divides its RNA guide into domains with distinct functions and RNA-binding properties. Cell. 2012;151(5):1055–1067. doi: 10.1016/j.cell.2012.10.036. [DOI] [PMC free article] [PubMed] [Google Scholar]
- 23.Jackson AL, Linsley PS. Recognizing and avoiding siRNA off-target effects for target identification and therapeutic application. Nat Rev Drug Discov. 2010;9(1):57–67. doi: 10.1038/nrd3010. [DOI] [PubMed] [Google Scholar]
- 24.Arvey A, Larsson E, Sander C, Leslie CS, Marks DS. Target mRNA abundance dilutes microRNA and siRNA activity. Mol Syst Biol. 2010;6:363. doi: 10.1038/msb.2010.24. [DOI] [PMC free article] [PubMed] [Google Scholar]
- 25.Ui-Tei K, Naito Y, Nishi K, Juni A, Saigo K. Thermodynamic stability and Watson-Crick base pairing in the seed duplex are major determinants of the efficiency of the siRNA-based off-target effect. Nucleic Acids Res. 2008;36(22):7100–7109. doi: 10.1093/nar/gkn902. [DOI] [PMC free article] [PubMed] [Google Scholar]
- 26.Garcia DM, et al. Weak seed-pairing stability and high target-site abundance decrease the proficiency of lsy-6 and other microRNAs. Nat Struct Mol Biol. 2011;18(10):1139–1146. doi: 10.1038/nsmb.2115. [DOI] [PMC free article] [PubMed] [Google Scholar]
- 27.Jens M, Rajewsky N. Competition between target sites of regulators shapes post-transcriptional gene regulation. Nat Rev Genet. 2015;16(2):113–126. doi: 10.1038/nrg3853. [DOI] [PubMed] [Google Scholar]
- 28.Ameres SL, Zamore PD. Diversifying microRNA sequence and function. Nat Rev Mol Cell Biol. 2013;14(8):475–488. doi: 10.1038/nrm3611. [DOI] [PubMed] [Google Scholar]
- 29.Seitz H. Redefining microRNA targets. Curr Biol. 2009;19(10):870–873. doi: 10.1016/j.cub.2009.03.059. [DOI] [PubMed] [Google Scholar]
- 30.Baccarini A, et al. Kinetic analysis reveals the fate of a microRNA following target regulation in mammalian cells. Curr Biol. 2011;21(5):369–376. doi: 10.1016/j.cub.2011.01.067. [DOI] [PMC free article] [PubMed] [Google Scholar]
- 31.Haley B, Zamore PD. Kinetic analysis of the RNAi enzyme complex. Nat Struct Mol Biol. 2004;11(7):599–606. doi: 10.1038/nsmb780. [DOI] [PubMed] [Google Scholar]
Associated Data
This section collects any data citations, data availability statements, or supplementary materials included in this article.