

Significance
Current vaccine development against persistent infections such as HIV and tuberculosis focuses on eliciting CD8 T cell immunity through the use of replication-incompetent or single-cycle vectors. Although inherently safe, these vectors deliver limited amounts of antigen. We investigate how antigen load affects the CD8 response by analyzing the viral load and the magnitude of the specific CD8 response after immunization with the live attenuated yellow fever vaccine (YFV-17D). Our results show that the magnitude of the CD8 response is proportional to the amount of antigen when virus load is below a threshold value and saturates above. This finding highlights the requirement that T cell-based vaccines deliver sufficient antigen to elicit a large CD8 response that may be needed for protection.
Keywords: vaccines, human CD8 T cells, viral load, effector T cells, immune memory
Abstract
CD8 T cells are a potent tool for eliminating intracellular pathogens and tumor cells. Thus, eliciting robust CD8 T-cell immunity is the basis for many vaccines under development. However, the relationship between antigen load and the magnitude of the CD8 T-cell response is not well-described in a human immune response. Here we address this issue by quantifying viral load and the CD8 T-cell response in a cohort of 80 individuals immunized with the live attenuated yellow fever vaccine (YFV-17D) by sampling peripheral blood at days 0, 1, 2, 3, 5, 7, 9, 11, 14, 30, and 90. When the virus load was below a threshold (peak virus load < 225 genomes per mL, or integrated virus load < 400 genome days per mL), the magnitude of the CD8 T-cell response correlated strongly with the virus load (R2 ∼ 0.63). As the virus load increased above this threshold, the magnitude of the CD8 T-cell responses saturated. Recent advances in CD8 T-cell–based vaccines have focused on replication-incompetent or single-cycle vectors. However, these approaches deliver relatively limited amounts of antigen after immunization. Our results highlight the requirement that T-cell–based vaccines should deliver sufficient antigen during the initial period of the immune response to elicit a large number of CD8 T cells that may be needed for protection.
CD8 T cells provide a powerful mechanism for elimination of intracellular pathogens and tumor cells. Accordingly, a major thrust of current vaccine research focuses on stimulating robust T-cell immunity for defense against infections such as HIV, malaria, tuberculosis, Ebola virus, herpes viruses, and hepatitis C virus (HCV) (1–8). Inducing effective CD8 T-cell immunity is also an important goal for cancer vaccines (9, 10). However, how antigen load affects the CD8 T-cell response has not been quantified in a detailed manner during a human immune response. In this study we address this question using the human live attenuated yellow fever vaccine (YFV-17D) vaccine.
The dynamics of CD8 T-cell responses to intracellular infection have been extensively studied in model systems. Infection typically stimulates a rapid burst of proliferation in antigen-specific CD8 T cells with division occurring as quickly as once in 4–6 h (11). This expansion results in a large population of effector CD8 T cells that aid in clearance of infected cells. Although most (90–95%) of the effector CD8 T cells die, a small fraction differentiate to form long-term memory CD8 T cells (12). Detailed quantitative measurements of the dynamics of virus and the CD8 T-cell response to the YFV-17D vaccine allow us to characterize these basic features of the CD8 T-cell responses in humans. Additionally, tracking the dynamics of both virus and CD8 T cells over time in a large cohort allows us to explore the relationship between amount of antigen and the magnitude of expansion and answer the following questions: Is there a threshold amount of virus required to generate a response? Does the magnitude of the response increase proportionally, or does it saturate with viral load? Although a number of studies have considered the complex relationship between numbers of specific CD8 T cells and virus loads during the chronic phase of HIV and HCV infections (3, 13–23), very few studies (24–27) have investigated these questions in the context of the generation of immune response following acute infections and vaccination.
We addressed these questions by measuring the dynamics of both virus and virus-specific CD8 T cells following immunization with the YFV-17D vaccine. The YFV-17D vaccine comprises a highly efficacious, live attenuated virus that causes an acute infection and stimulates a robust immune response conferring lifelong protection against the yellow fever virus (YFV) (28, 29). Because yellow fever is not endemic to the United States, immunization with YFV-17D induces a primary immune response (30, 31). Previous work with YFV-17D has identified CD8 T cells specific for some of the YFV epitopes and defined the stages of expansion, contraction, and memory maintenance (32–38). We now know that YFV stimulates a polyfunctional, broadly targeting, and long-lasting CD8 T-cell response. Of particular note, we have previously demonstrated that the magnitude of the total effector CD8 T-cell response against YFV can be measured using the Ki-67+ Bcl-2lo HLA-DR+ CD38+ phenotype of activated T cells seen early after vaccination (38). In the current study, we followed a large cohort of 80 individuals with intensive sampling at days 0, 1, 2, 3, 5, 7, 9, 11, 14, 30, and 90 postvaccination to quantify viral load in plasma (39). Additionally, we quantified the magnitude of the YFV-specific effector CD8 T-cell response at days 0, 3, 7, 14, 30, and 90 postvaccination using the Ki-67+Bcl-2lo phenotype. We find that different individuals have different virus loads following infection and generate CD8 T-cell responses of different sizes. This allows us to determine the relationship between virus load and magnitude of the CD8 T-cell response.
The majority of vaccines that are currently under development use replication-incompetent or single-cycle vectors such as Modified Vaccinia Ankara, adenovirus, and DNA. Although these approaches are inherently safe, they may express and deliver relatively limited amounts of antigen. Our results emphasize the requirement that T-cell–based vaccines deliver sufficient antigen to elicit a large CD8 T-cell response that may be needed for protection.
Results
Intensive Sampling Reveals Fine-Scale Dynamics of YFV-17D Viral Load and the CD8 T-Cell Response.
We explored the relationship between the YFV-17D viral load and CD8 T-cell response using a cohort of 80 vaccinees with intensive sampling of peripheral blood between days 0 and 90 postvaccination. In Fig. 1A, we show the kinetics of YFV-17D genomes in plasma as quantified by qPCR. Fig. 1C shows the kinetics for each individual sample separately. Viral genomes were detected after 2 days in most samples, then increased exponentially, and finally dropped below detection by day 11 in most vaccinees. Although individual variation in the peak viral load spanned multiple orders of magnitude (from <25 to 5.2 × 10⁴ genomes per mL), the time of the observed peak virus occurred in a narrow range between days 5 and 7 postvaccination.
Fig. 1.

Dynamics of viral load and CD8 T-cell response after vaccination with YFV-17D. (A) YFV-17D viral genomes measured by qRT-PCR and (B) YFV-specific effector CD8 T cells as measured by Ki-67+Bcl-2lo for each of 80 vaccinees. Blood samples were drawn on days 0, 1, 2, 3, 5, 7, 9, 11, 14, and 30. (Right) The distribution of peak magnitudes of virus and responding CD8 cells among the vaccinees. We see that there is approximately a four-log spread in the peak viral load and a two-log spread in the peak CD8+ T-cell response between different individuals. (C) Individual kinetics of the viral load (red lines, left axis) and CD8 effector cells (blue lines, right axis) for each vaccinee. In all cases, the CD8 response peaks after virus.
Previous work has shown that ∼2 weeks after immunization with either yellow fever or smallpox vaccines, a large population of activated (HLA-DR+CD38+Ki-67+Bcl-2lo) CD8 T cells appeared in circulation. Phenotypic and functional assays verified that cells defined by this phenotype represented newly elicited virus-specific effector CD8 T cells with properties such as high expression of perforin and granzyme B (38). Thus, the HLA-DR, CD38, Ki-67, and Bcl-2 markers (or two of these four markers) allow quantification of the primary effector CD8 T-cell response (37, 38).
In Fig. 1B, we plot percent of YFV-specific effector CD8 T cells bearing the Ki-67+Bcl-2lo phenotype (a population we hereafter refer to as “effectors”). This effector population encompassed all CD8 T cells responding to YFV-17D during the transient phase of antigen-driven expansion. In Fig. 1C, we plot the effector kinetics for each individual separately. For most individuals, the YFV effector responses first appeared above background at day 7, peaked between days 11 and 14, waned substantially by day 30, and declined to background levels by day 90. As seen in Fig. 1B, Right, there was almost 100-fold variation in the magnitude of the CD8 T-cell response in different individuals. The results obtained by tracking effector CD8 T cells were supplemented by the measurement of CD8 T cells specific for an HLA-A2 restricted epitope in the NS4B protein of the YFV in a subset of 25 individuals possessing HLA-A2 MHC (Fig. S1).
In Fig. 2A, we summarize the mean kinetics of virus, effector, and tetramer. Tetramer+ CD8 T cells had an observed peak at day 30 and fell to a relatively stable memory level by day 90 when the Ki-67+ population had returned to its background levels (see Fig. S1 for kinetics showing virus, effector, and tetramer for each individual separately). In Fig. 2 B–D, we use heat maps to show individual kinetics for virus (Fig. 2B), effector (Fig. 2C), and tetramer (Fig. 2D). Each row in each plot represents a single individual; from Fig. 2B, we can see that virus peaked at day 5 or day 7 in almost every individual. From Fig. 2C, we can see that the effector response peaks at day 11 or 14 in almost every individual. Individuals with peak virus at day 5 have a slightly higher peak virus load than those that peak at day 7 (Fig. S2A). Finally, in Fig. 2D we see that the tetramer response peaks later, typically at day 30. Because the ordering of the individuals (rows) is the same in Fig. 2 B and C, we can see that there is no strong connection between the slight variation in timing of the peak virus (day 5 in the top half and day 7 in the bottom half) and the slight variation in the timing of the peak effector (day 11 and 14 peaks are interspersed in the top and bottom halves). We also observed that despite all individuals being vaccinated with the same dose of attenuated YFV-17D, there was considerable heterogeneity in the antigen load and CD8 T-cell responses in different individuals (Fig. 1 A and B, Right).
Fig. 2.

Summary dynamics of viral load and CD8 T-cell response. (A) Mean kinetics of virus (red) and YFV-specific CD8 cells measured by Ki-67+Bcl-2lo (blue) and by the NS4B214 tetramer (green). Virus peaks first, followed by Ki-67+ CD8 T cells, and finally tetramer+ CD8 T cells. (B–D) Individual-level kinetics of virus, Ki-67+ responses, and tetramer+ responses shown as heat maps. Each row corresponds to kinetics in one of the 80 individuals. Individuals were ordered first by day at which virus peaked and then by magnitude of that peak. As can been seen in B, individuals in the top half of the plot had peak virus on day 5, and in the bottom half, most individuals had peak virus on day 7. The Ki-67 kinetics in C and tetramer kinetics in D show no link between timing of peak virus and the CD8 T-cell response (see also Fig. S2).
Changes in Gene Expression Following YFV-17D Are Associated with Viral Load.
In an earlier study, to gain a global outlook of the immune response in the first week of YFV-17D vaccination, we reported RNA microarray profiles of total peripheral blood mononuclear cells (PBMCs) (35). We used this published dataset to ask if the difference in viral burden across donors was associated with differences in global gene expression. Analysis of viral load and absolute gene expression values at days 3 and 7 postvaccination in the same donors revealed two distinct gene sets: one that correlated positively and another that correlated negatively with the viral load at the time of PBMC sampling (Fig. 3A and Supporting Information). Next, we performed gene set enrichment analysis (GSEA) (40) to identify functional modules within each of the above expression patterns by comparing them with transcription profiles of specific immune cell subsets from our ongoing work. This approach revealed that the PBMC profile that positively correlated with viral load contained genes that are highly expressed in YFV effector CD8 T cells (Fig. 3B). Conversely, genes that YFV effectors typically down-regulate were enriched in the set that negatively correlated with viral load (Fig. 3B). Further, analysis using previously published gene sets associated with polyclonal T-cell subsets in healthy adults showed that genes that positively correlated with viral load were also enriched in gene sets characteristic of the effector memory (TEM) CD4 or CD8 T cells, whereas genes that were negatively correlated were enriched in gene sets characteristic of naive and central memory (TCM) T cells (Fig. 3C). This shows that changes in gene expression are sensitive to the viral load and allow detection of the effector CD8 T-cell response before observing increased numbers by activation markers and tetramer staining.
Fig. 3.

Transcriptional profiling of PBMCs is sensitive and reveals enrichment of effector T-cell genes. (A) We performed transcriptional profiling of PBMCs obtained from vaccinees before and days 3 and 7 after vaccination. Genes whose absolute level of expression correlates positively (red) or negatively (blue) with viral load on the day of PBMC sampling are shown as a heat map. The viral load corresponding to each transcriptional profile is shown as a bar graph above the heat map. (B) The transcriptional profiles of YFV-specific effector CD8 T cells or prevaccination naive CD8 T cells were tested for enrichment among the genes that were associated with viral load from A. The GSEA plots are shown. (C) Expression profiles of various published immune cell subsets were tested for enrichment among the viral load associated genes. Normalized enrichment score for most significantly associated gene sets is shown.
The Magnitude of the CD8 T-Cell Response Correlates with Viral Load.
Fig. 1 A and B show the considerable heterogeneity in both viral load and CD8 T-cell response in different individuals. We use this heterogeneity to explore the relationship between viral load and the magnitude of the CD8 T-cell response. We began by dividing our samples between the subgroup with peak virus on day 5 and the subgroup with peak virus on day 7. In Fig. S2B, we plot the mean effector CD8 kinetics for these two groups together with their SEs. Because the SEs overlap for the two groups at all time points, we conclude that this slight difference in virus timing has no detectable effect on the effector kinetics.
Next we divided our samples into subgroups based on their peak virus load. The group exhibiting very low peak virus load consisted of 11 individuals with <100 genomes per mL, and the group with the higher peak virus load comprised 69 individuals with >100 genomes per mL. In Fig. 4A, we plot the mean effector CD8 kinetics (+SEs) for these two groups. Here we find a striking difference in the magnitude of the CD8 T-cell response between these two groups, with the group having a higher peak virus load generating a significantly larger CD8 response at days 11 and 14 than the low virus group.
Fig. 4.
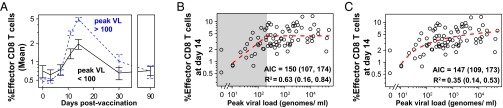
The magnitude of the YFV-effector CD8 T-cell correlates with viral burden. (A) The kinetics for the mean % Ki-67+Bcl-2lo CD8 T cells are dramatically different between vaccinees grouped by high (>100 genomes per mL, dashed blue line) or low (<100 genomes per mL, solid black line) viral load. The former shows significantly more responding T cells than the latter. Error bars show SEM. (B and C) The effector CD8 T-cell response (% Ki-67+Bcl-2lo of CD8 T cells) at day 14 correlates with the peak viral load. (B) We plot (dashed red line) the best fit of a piecewise-linear function (linear up to a threshold, constant above the threshold; Methods) relating the viral load and CD8 T-cell response. When viral load is below a threshold value of ∼225 genome/mL (shaded in gray), viral load strongly predicts the magnitude of the CD8 T-cell response (R2 = 0.68 with a 95% bootstrap confidence interval of 0.16–0.87); when viral load is above this value, the CD8 T-cell response saturates. (C) We show a similar result if we use a smooth saturating function in place of the piecewise-linear function. In both B and C we see that the magnitude of the CD8 response increases with viral load, rapidly at first and then saturating at high viral loads. Both piecewise and smooth saturating models fit equally well based on AIC values.
Extending this latter observation, we more formally analyzed how much of the variation in the peak CD8 response (day 14 effector response: Ki-67+, Bcl-2lo) could be explained by the viral load. We expected that the immune response would initially increase with peak virus load and saturate when the peak virus load was above some threshold. We constructed two functions to describe saturation: a piecewise linear function and a smooth saturating function (Methods). In Fig. 4 B and C, we plot the peak CD8 T-cell response versus the peak viral load for each individual together with our best fit (dashed line). In both cases we find that the peak CD8 T-cell response increases with increases in the peak viral load. The response initially increases rapidly with increases in virus load and subsequently saturates. Because the majority of the data are for high virus loads where the CD8 T-cell response saturates, overall, a modest amount of the variation in the CD8 T-cell response is explained by the virus load (e.g., R2 = 0.35 for the smooth saturating function). In the piecewise linear model, we focus on the regime where peak virus loads are below a threshold (<250 genomes per mL in Fig. 4B) and find in this regime that the peak virus load explained about 2/3 of the variation in the effector CD8 response (R2 = 0.63 with a 95% bootstrap confidence interval of 0.16–0.84). We note that both the piecewise and smooth saturating functions fit the data similarly well with overlapping AIC (Akaike information criterion) values. Fig. S3 shows that a similar result holds when we use the integrated virus load in the place of peak virus load.
The above analyses connecting viral load to the CD8 T-cell responses focused on the peak number of effector CD8 T cells. A more direct determinant of long-term protection is the magnitude of the memory CD8 T-cell population; however, we could only directly quantify the memory responses in the minority of individuals who had the HLA-A2 allele. In Fig. S4 we show that the effector response correlates with the magnitude of the memory response. Thus, the correlation between viral load and immune response should apply to the memory stage as well as the effector stage.
Discussion
Our measurement of YF-17D virus and CD8 T-cell responses from frequent longitudinal sampling in a large number of study subjects has generated a rich dataset in the context of a primary human immune response to an acute viral infection. The basic pattern of virus and immune kinetics validates our understanding of infection and immunity that has been obtained from animal model studies with specific CD8 T cells exhibiting expansion, contraction, and memory phases (11). We leveraged the interindividual variation in the magnitudes of virus load and CD8 T-cell responses to reveal their functional relationship: for peak virus load below a threshold level, the magnitude of the CD8 T-cell response shows a strong positive dependence on the viral load at low viral loads, and its magnitude saturates at high virus loads. For example, in Fig. 4C we see that a 10-fold increase in the peak virus load from 10 to 100 genomes per mL leads to an approximately threefold (i.e., 300%) increase in the peak CD8 T-cell response, but a similar 10-fold increase in peak virus load from 5 × 10³ to 5 × 10⁴ genomes per mL is associated with approximately 0.2-fold (i.e., 20%) further increase in CD8 response. This analysis highlights the importance of having sufficient antigen to get a large immune response, but once a threshold amount of antigen is attained, further increases may have diminishing returns.
Our observation that the magnitude of the CD8 T-cell response to YFV-17D saturates was made in a system where the majority of viremia occurred in a narrow window between 3 and 9 days postvaccination, thus restricting a major portion of the antigenic stimulus to a short duration in all individuals. Consequently, we get a very similar relationship between the magnitude of the CD8 T-cell response and either peak virus load or integrated viral load. However, in acute viral infections where the virus is present for a longer duration, prolonged antigenic stimulus is likely to result in an increased magnitude of the CD8 T-cell responses. In this case we might expect that the magnitude of the CD8 T-cell response will be proportional to the integral of stimulation (which saturates with virus load) over the duration of the acute infection. Indeed, in one of the rare cases where YFV-17D caused a severe (nonfatal) adverse reaction, a prolonged viremia occurring for more than 30 days after vaccination was seen, and it was coupled with large frequency (>50%) of activated CD8 T cells (41).
The relationship between the virus and CD8 T-cell responses during persistent infections is more complex and brings into play many factors including the magnitude of the viral load, the duration of infection, and T-cell exhaustion. However, many persistent viral infections such as CMV and EBV in humans lead to CD8 T-cell responses reaching a higher magnitude than most acute infections. Hansen et al. (42, 43) have recently reported that rhesus macaques vaccinated with persistent rhesus CMV expression vectors containing simian immunodeficiency virus (SIV) proteins elicit durable viral control after challenge with SIV. The studies suggested that the SIV control was linked to a large magnitude of CD8 T cells generated and maintained by the persistent vector at sites of viral entry (mucosa) and at other sites of potential viral dissemination. In comparison, YFV-17D is an acute viral infection that generates highly functional CD8 T cells that not only display rapid recall and antiviral cytokine production but also have the potential to home to mucosal tissues (37, 44). Thus, despite their differences, the common key features that determine the CD8-mediated protection in vaccines are their magnitude, tissue location, and function.
The saturation in the magnitude of the immune response with virus load results in a much smaller variation in the magnitude of the immune response (about 10- to 100-fold) compared with the 104-fold variation in the virus load in different individuals. This may be beneficial for a number of reasons. First, having a comparable variation in the number of specific CD8 T cells and virus would result in either very few specific CD8 T cells in individuals with a low virus load or almost all cells being YFV-specific in individuals with a high virus load. If a critical number of CD8 T cells are required for surveillance and control of pathogen, then saturation in the magnitude of the antigen-specific CD8 T-cell response may optimize the resource allocation in memory cells. Second, saturation may limit potential immunopathology which occurs when there is a confluence of high levels of pathogen together with large numbers of antigen-specific CD8 T cells.
Detailed comparison of the timing of peak viral load and CD8 T-cell responses revealed that the highest frequency of proliferating CD8 T cells always occurred later than viral clearance (Fig. 1C). This observation suggests that although clearly sensitive to viral load, CD8 T cells undergo several rounds of proliferation after antigen-induced activation. Similar “programmed” proliferation has previously been characterized in animal models (45–47), where both antigen-dependent and antigen-independent proliferation are known to play roles (48). Because our study is limited to analysis of peripheral blood, we cannot rule out the alternative possibility that viral clearance takes longer in tissues relative to peripheral blood and provides the stimulation necessary for CD8 T-cell proliferation.
This study raises a number of questions. Our analysis suggests that the viral load accounts for most of the variation in the CD8 T-cell response (R2 = 0.63, 95% CI 0.16–0.84) at relatively low viral loads. What are the roles of factors such as innate immunity and CD4 and B cells in regulating the magnitude of the CD8 response, and how might these be manipulated to optimize vaccination? Additional work will be required to tease apart the roles and interactions between these players; however, a significant current obstacle is the lack of markers to identify specific responses for these cell types. Another question is what causes the heterogeneity in viral load in different individuals and how might this be minimized to ensure all vaccines reach the threshold level of viral load. Our study also raises the possibility that signatures of a cellular immune response can be detected among gene expression profiles before they become apparent by specific assays such as flow cytometry. Early gene expression signatures have been used earlier to develop models predicting the subsequent CD8 T-cell response, and we suggest that including the effect of viral load will fine-tune the model further (35).
Our study has important implications for the use of replication-incompetent or single-cycle vectors in T-cell–based vaccines such as those being developed against HIV and Ebola using vectors such as canarypox or adenoviruses (7, 8, 49, 50). Although these approaches have the advantage of being inherently safe because there is no virus replication, this feature also limits the amount of antigen that is delivered to stimulate the immune response. Our analysis of the CD8 response following immunization with the YFV-17D vaccine highlights the importance of having sufficient antigen shortly after infection to generate a robust CD8 T-cell response. Indeed, the success of the YFV-17D vaccine may arise in part because it generates sufficient antigen in the vast majority of vaccinees. We suggest that T-cell–based vaccine vectors must be designed to generate sufficient quantities of antigen to induce large CD8 T-cell populations.
Methods
Study Subjects, Blood Samples, and Analysis of Viral Load and Activated CD8 T Cells.
All studies were approved by the Emory University institutional review board. Written informed consent was signed by study participants before enrollment. A single dose of 17D live-attenuated yellow fever vaccine strain (YFV-VAX; Sanofi-Pasteur) was administered s.c. to 80 young adults (18–40 y of age). This group of vaccinees had no evidence of serum anti-flavivirus antibodies before vaccination, and all seroconverted by day 14. Plasma isolated from blood samples was used to assay YFV-17D genomes using a TaqMan real-time PCR (Applied Biosystems). The magnitude of the YFV-specific response was measured in whole blood using activation markers or using tetramers recognizing CD8 T cells specific for the HLA-A2 restricted NS4B214 epitope. Additional details are provided in SI Methods.
Correlation and Model Fitting.
We used a piecewise-defined model and a smooth saturation model to relate the observed peak viral response to measures of the immune response.
The piecewise-linear model allowed for a threshold value (t) below which the response variable (immune response, y) responded in a linear fashion to explanatory variable (viral load, x) and above which y was unaffected by x:
We performed least-squares fits for the three parameters (a, c, t), and calculated the coefficient of determination (R2) for the linear region of the model (x<t) to summarize the sensitivity of the immune response to the viral load.
The smooth saturating model had functional form
Again, we performed least-squares fits for the three parameter (m, b, d), but here our R2 calculation applied to the entire domain of the model (all values of x).
Because both virus and immune response undergo exponential growth, all model fitting and analyses were performed on log-transformed data. Donors whose peak viral load was below the threshold of detection were excluded from the correlation analysis. AIC values were calculated directly from the residuals after performing the least-squares fits.
Bootstrap.
We placed confidence intervals around the coefficient of determination (R2) and AIC values using bootstrap resampling. In brief, for each bootstrap replicate, we created a new set of data by sampling with replacement from our original dataset. Then we fit our model to this new bootstrap dataset and calculated R2 and AIC. Repeated bootstrap samples provide an estimate of the sampling distributions, from which we report the 2.5% and 97.5% percentiles as a 95% confidence interval.
Supplementary Material
Acknowledgments
We thank the reviewers for helpful comments. This work was supported by NIH Grants U19AI057266 (to R. Ahmed), R01 AI110720 (to R. Antia), and K99 GM104158 (to P.L.F.J.).
Footnotes
The authors declare no conflict of interest.
This article contains supporting information online at www.pnas.org/lookup/suppl/doi:10.1073/pnas.1500475112/-/DCSupplemental.
References
- 1.Harrer T, et al. Strong cytotoxic T cell and weak neutralizing antibody responses in a subset of persons with stable nonprogressing HIV type 1 infection. AIDS Res Hum Retroviruses. 1996;12(7):585–592. doi: 10.1089/aid.1996.12.585. [DOI] [PubMed] [Google Scholar]
- 2.Pereyra F, et al. Genetic and immunologic heterogeneity among persons who control HIV infection in the absence of therapy. J Infect Dis. 2008;197(4):563–571. doi: 10.1086/526786. [DOI] [PubMed] [Google Scholar]
- 3.Kiepiela P, et al. CD8+ T-cell responses to different HIV proteins have discordant associations with viral load. Nat Med. 2007;13(1):46–53. doi: 10.1038/nm1520. [DOI] [PubMed] [Google Scholar]
- 4.Schmidt NW, et al. Memory CD8 T cell responses exceeding a large but definable threshold provide long-term immunity to malaria. Proc Natl Acad Sci USA. 2008;105(37):14017–14022. doi: 10.1073/pnas.0805452105. [DOI] [PMC free article] [PubMed] [Google Scholar]
- 5.Chen CY, et al. A critical role for CD8 T cells in a nonhuman primate model of tuberculosis. PLoS Pathog. 2009;5(4):e1000392. doi: 10.1371/journal.ppat.1000392. [DOI] [PMC free article] [PubMed] [Google Scholar]
- 6.Swadling L, Klenerman P, Barnes E. Ever closer to a prophylactic vaccine for HCV. Expert Opin Biol Ther. 2013;13(8):1109–1124. doi: 10.1517/14712598.2013.791277. [DOI] [PMC free article] [PubMed] [Google Scholar]
- 7.Stanley DA, et al. Chimpanzee adenovirus vaccine generates acute and durable protective immunity against ebolavirus challenge. Nat Med. 2014;20(10):1126–1129. doi: 10.1038/nm.3702. [DOI] [PubMed] [Google Scholar]
- 8.Sullivan NJ, et al. CD8+ cellular immunity mediates rAd5 vaccine protection against Ebola virus infection of nonhuman primates. Nat Med. 2011;17(9):1128–1131. doi: 10.1038/nm.2447. [DOI] [PubMed] [Google Scholar]
- 9.Drake CG, Lipson EJ, Brahmer JR. Breathing new life into immunotherapy: review of melanoma, lung and kidney cancer. Nat Rev Clin Oncol. 2014;11(1):24–37. doi: 10.1038/nrclinonc.2013.208. [DOI] [PMC free article] [PubMed] [Google Scholar]
- 10.Kamphorst AO, Ahmed R. Manipulating the PD-1 pathway to improve immunity. Curr Opin Immunol. 2013;25(3):381–388. doi: 10.1016/j.coi.2013.03.003. [DOI] [PMC free article] [PubMed] [Google Scholar]
- 11.Murali-Krishna K, et al. Counting antigen-specific CD8 T cells: A reevaluation of bystander activation during viral infection. Immunity. 1998;8(2):177–187. doi: 10.1016/s1074-7613(00)80470-7. [DOI] [PubMed] [Google Scholar]
- 12.Cui W, Kaech SM. Generation of effector CD8+ T cells and their conversion to memory T cells. Immunol Rev. 2010;236:151–166. doi: 10.1111/j.1600-065X.2010.00926.x. [DOI] [PMC free article] [PubMed] [Google Scholar]
- 13.Asquith B, Bangham CR. Quantifying HTLV-I dynamics. Immunol Cell Biol. 2007;85(4):280–286. doi: 10.1038/sj.icb.7100050. [DOI] [PubMed] [Google Scholar]
- 14.Betts MR, et al. Analysis of total human immunodeficiency virus (HIV)-specific CD4(+) and CD8(+) T-cell responses: Relationship to viral load in untreated HIV infection. J Virol. 2001;75(24):11983–11991. doi: 10.1128/JVI.75.24.11983-11991.2001. [DOI] [PMC free article] [PubMed] [Google Scholar]
- 15.Ciuffreda D, et al. Polyfunctional HCV-specific T-cell responses are associated with effective control of HCV replication. Eur J Immunol. 2008;38(10):2665–2677. doi: 10.1002/eji.200838336. [DOI] [PubMed] [Google Scholar]
- 16.Davenport MP, Ribeiro RM, Zhang L, Wilson DP, Perelson AS. Understanding the mechanisms and limitations of immune control of HIV. Immunol Rev. 2007;216:164–175. doi: 10.1111/j.1600-065X.2006.00485.x. [DOI] [PubMed] [Google Scholar]
- 17.Day CL, et al. Proliferative capacity of epitope-specific CD8 T-cell responses is inversely related to viral load in chronic human immunodeficiency virus type 1 infection. J Virol. 2007;81(1):434–438. doi: 10.1128/JVI.01754-06. [DOI] [PMC free article] [PubMed] [Google Scholar]
- 18.Elemans M, Seich Al Basatena NK, Asquith B. The efficiency of the human CD8+ T cell response: How should we quantify it, what determines it, and does it matter? PLOS Comput Biol. 2012;8(2):e1002381. doi: 10.1371/journal.pcbi.1002381. [DOI] [PMC free article] [PubMed] [Google Scholar]
- 19.Novitsky V, et al. Association between virus-specific T-cell responses and plasma viral load in human immunodeficiency virus type 1 subtype C infection. J Virol. 2003;77(2):882–890. doi: 10.1128/JVI.77.2.882-890.2003. [DOI] [PMC free article] [PubMed] [Google Scholar]
- 20.Nowak MA, Bangham CR. Population dynamics of immune responses to persistent viruses. Science. 1996;272(5258):74–79. doi: 10.1126/science.272.5258.74. [DOI] [PubMed] [Google Scholar]
- 21.Sester M, et al. Dominance of virus-specific CD8 T cells in human primary cytomegalovirus infection. J Am Soc Nephrol. 2002;13(10):2577–2584. doi: 10.1097/01.asn.0000030141.41726.52. [DOI] [PubMed] [Google Scholar]
- 22.Borrow P, Lewicki H, Hahn BH, Shaw GM, Oldstone MB. Virus-specific CD8+ cytotoxic T-lymphocyte activity associated with control of viremia in primary human immunodeficiency virus type 1 infection. J Virol. 1994;68(9):6103–6110. doi: 10.1128/jvi.68.9.6103-6110.1994. [DOI] [PMC free article] [PubMed] [Google Scholar]
- 23.Koup RA, et al. Temporal association of cellular immune responses with the initial control of viremia in primary human immunodeficiency virus type 1 syndrome. J Virol. 1994;68(7):4650–4655. doi: 10.1128/jvi.68.7.4650-4655.1994. [DOI] [PMC free article] [PubMed] [Google Scholar]
- 24.Matis LA, Glimcher LH, Paul WE, Schwartz RH. Magnitude of response of histocompatibility-restricted T-cell clones is a function of the product of the concentrations of antigen and Ia molecules. Proc Natl Acad Sci USA. 1983;80(19):6019–6023. doi: 10.1073/pnas.80.19.6019. [DOI] [PMC free article] [PubMed] [Google Scholar]
- 25.Pantaleo G, et al. Major expansion of CD8+ T cells with a predominant V beta usage during the primary immune response to HIV. Nature. 1994;370(6489):463–467. doi: 10.1038/370463a0. [DOI] [PubMed] [Google Scholar]
- 26.Davenport MP, Ribeiro RM, Perelson AS. Kinetics of virus-specific CD8+ T cells and the control of human immunodeficiency virus infection. J Virol. 2004;78(18):10096–10103. doi: 10.1128/JVI.78.18.10096-10103.2004. [DOI] [PMC free article] [PubMed] [Google Scholar]
- 27.Davenport MP, et al. High-potency human immunodeficiency virus vaccination leads to delayed and reduced CD8+ T-cell expansion but improved virus control. J Virol. 2005;79(15):10059–10062. doi: 10.1128/JVI.79.15.10059-10062.2005. [DOI] [PMC free article] [PubMed] [Google Scholar]
- 28.Poland JD, Calisher CH, Monath TP, Downs WG, Murphy K. Persistence of neutralizing antibody 30-35 years after immunization with 17D yellow fever vaccine. Bull World Health Organ. 1981;59(6):895–900. [PMC free article] [PubMed] [Google Scholar]
- 29. Monath TPG, Staples JE, Barrett ADT (2012) Yellow fever vaccine. Vaccines, eds Plotkin S, Orenstein W, Offit P (Elsevier Saunders, Philadelphia), 6th Ed, pp 870–968.
- 30.Barnett ED. Yellow fever: Epidemiology and prevention. Clin Infect Dis. 2007;44(6):850–856. doi: 10.1086/511869. [DOI] [PubMed] [Google Scholar]
- 31.Pulendran B, Oh JZ, Nakaya HI, Ravindran R, Kazmin DA. Immunity to viruses: Learning from successful human vaccines. Immunol Rev. 2013;255(1):243–255. doi: 10.1111/imr.12099. [DOI] [PMC free article] [PubMed] [Google Scholar]
- 32.Barba-Spaeth G, Longman RS, Albert ML, Rice CM. Live attenuated yellow fever 17D infects human DCs and allows for presentation of endogenous and recombinant T cell epitopes. J Exp Med. 2005;202(9):1179–1184. doi: 10.1084/jem.20051352. [DOI] [PMC free article] [PubMed] [Google Scholar]
- 33.Gaucher D, et al. Yellow fever vaccine induces integrated multilineage and polyfunctional immune responses. J Exp Med. 2008;205(13):3119–3131. doi: 10.1084/jem.20082292. [DOI] [PMC free article] [PubMed] [Google Scholar]
- 34.James EA, et al. Yellow fever vaccination elicits broad functional CD4+ T cell responses that recognize structural and nonstructural proteins. J Virol. 2013;87(23):12794–12804. doi: 10.1128/JVI.01160-13. [DOI] [PMC free article] [PubMed] [Google Scholar]
- 35.Querec TD, et al. Systems biology approach predicts immunogenicity of the yellow fever vaccine in humans. Nat Immunol. 2009;10(1):116–125. doi: 10.1038/ni.1688. [DOI] [PMC free article] [PubMed] [Google Scholar]
- 36.Vratskikh O, et al. Dissection of antibody specificities induced by yellow fever vaccination. PLoS Pathog. 2013;9(6):e1003458. doi: 10.1371/journal.ppat.1003458. [DOI] [PMC free article] [PubMed] [Google Scholar]
- 37.Akondy RS, et al. The yellow fever virus vaccine induces a broad and polyfunctional human memory CD8+ T cell response. J Immunol. 2009;183(12):7919–7930. doi: 10.4049/jimmunol.0803903. [DOI] [PMC free article] [PubMed] [Google Scholar]
- 38.Miller JD, et al. Human effector and memory CD8+ T cell responses to smallpox and yellow fever vaccines. Immunity. 2008;28(5):710–722. doi: 10.1016/j.immuni.2008.02.020. [DOI] [PubMed] [Google Scholar]
- 39.Edupuganti S, et al. YF-Ig Study Team A randomized, double-blind, controlled trial of the 17D yellow fever virus vaccine given in combination with immune globulin or placebo: Comparative viremia and immunogenicity. Am J Trop Med Hyg. 2013;88(1):172–177. doi: 10.4269/ajtmh.2012.12-0179. [DOI] [PMC free article] [PubMed] [Google Scholar]
- 40.Subramanian A, et al. Gene set enrichment analysis: A knowledge-based approach for interpreting genome-wide expression profiles. Proc Natl Acad Sci USA. 2005;102(43):15545–15550. doi: 10.1073/pnas.0506580102. [DOI] [PMC free article] [PubMed] [Google Scholar]
- 41.Pulendran B, et al. Case of yellow fever vaccine—Associated viscerotropic disease with prolonged viremia, robust adaptive immune responses, and polymorphisms in CCR5 and RANTES genes. J Infect Dis. 2008;198(4):500–507. doi: 10.1086/590187. [DOI] [PMC free article] [PubMed] [Google Scholar]
- 42.Hansen SG, et al. Profound early control of highly pathogenic SIV by an effector memory T-cell vaccine. Nature. 2011;473(7348):523–527. doi: 10.1038/nature10003. [DOI] [PMC free article] [PubMed] [Google Scholar]
- 43.Hansen SG, et al. Immune clearance of highly pathogenic SIV infection. Nature. 2013;502(7469):100–104. doi: 10.1038/nature12519. [DOI] [PMC free article] [PubMed] [Google Scholar]
- 44.Masopust D, et al. Dynamic T cell migration program provides resident memory within intestinal epithelium. J Exp Med. 2010;207(3):553–564. doi: 10.1084/jem.20090858. [DOI] [PMC free article] [PubMed] [Google Scholar]
- 45.Kaech SM, Ahmed R. Memory CD8+ T cell differentiation: Initial antigen encounter triggers a developmental program in naïve cells. Nat Immunol. 2001;2(5):415–422. doi: 10.1038/87720. [DOI] [PMC free article] [PubMed] [Google Scholar]
- 46.van Stipdonk MJ, Lemmens EE, Schoenberger SP. Naïve CTLs require a single brief period of antigenic stimulation for clonal expansion and differentiation. Nat Immunol. 2001;2(5):423–429. doi: 10.1038/87730. [DOI] [PubMed] [Google Scholar]
- 47.Mercado R, et al. Early programming of T cell populations responding to bacterial infection. J Immunol. 2000;165(12):6833–6839. doi: 10.4049/jimmunol.165.12.6833. [DOI] [PubMed] [Google Scholar]
- 48.Antia R, Bergstrom CT, Pilyugin SS, Kaech SM, Ahmed R. Models of CD8+ responses: 1. What is the antigen-independent proliferation program. J Theor Biol. 2003;221(4):585–598. doi: 10.1006/jtbi.2003.3208. [DOI] [PubMed] [Google Scholar]
- 49.Buchbinder SP, et al. Step Study Protocol Team Efficacy assessment of a cell-mediated immunity HIV-1 vaccine (the Step Study): A double-blind, randomised, placebo-controlled, test-of-concept trial. Lancet. 2008;372(9653):1881–1893. doi: 10.1016/S0140-6736(08)61591-3. [DOI] [PMC free article] [PubMed] [Google Scholar]
- 50.Rerks-Ngarm S, et al. MOPH-TAVEG Investigators Vaccination with ALVAC and AIDSVAX to prevent HIV-1 infection in Thailand. N Engl J Med. 2009;361(23):2209–2220. doi: 10.1056/NEJMoa0908492. [DOI] [PubMed] [Google Scholar]
Associated Data
This section collects any data citations, data availability statements, or supplementary materials included in this article.