

Significance
Antiretroviral therapy (ART) effectively suppresses HIV replication; however, treatment cannot be stopped, because latently infected CD4+ T cells will rekindle infection. As one estimate of the size of the pool of latently infected cells that must be purged for cure, we asked whether recrudescent infection is the result of reactivation from one or a larger number latently infected cells. We briefly stopped ART in fully suppressed patients to see how widespread new infections were in the lymphoid tissues (LTs) and how diverse rebounding/founder viruses were in peripheral blood. Recrudescent infection was detectable in multiple different LTs, and the population was genetically diverse, consistent with reactivation from a larger number of cells. These findings underscore the challenges facing strategies to eradicate HIV infection.
Keywords: HIV/AIDS, founder population, treatment interruption, viral recrudescence
Abstract
Antiretroviral therapy (ART) suppresses HIV replication in most individuals but cannot eradicate latently infected cells established before ART was initiated. Thus, infection rebounds when treatment is interrupted by reactivation of virus production from this reservoir. Currently, one or a few latently infected resting memory CD4 T cells are thought be the principal source of recrudescent infection, but this estimate is based on peripheral blood rather than lymphoid tissues (LTs), the principal sites of virus production and persistence before initiating ART. We, therefore, examined lymph node (LN) and gut-associated lymphoid tissue (GALT) biopsies from fully suppressed subjects, interrupted therapy, monitored plasma viral load (pVL), and repeated biopsies on 12 individuals as soon as pVL became detectable. Isolated HIV RNA-positive (vRNA+) cells were detected by in situ hybridization in LTs obtained before interruption in several patients. After interruption, multiple foci of vRNA+ cells were detected in 6 of 12 individuals as soon as pVL was measureable and in some subjects, in more than one anatomic site. Minimal estimates of the number of rebounding/founder (R/F) variants were determined by single-gene amplification and sequencing of viral RNA or DNA from peripheral blood mononuclear cells and plasma obtained at or just before viral recrudescence. Sequence analysis revealed a large number of R/F viruses representing recrudescent viremia from multiple sources. Together, these findings are consistent with the origins of recrudescent infection by reactivation from many latently infected cells at multiple sites. The inferred large pool of cells and sites to rekindle recrudescent infection highlights the challenges in eradicating HIV.
Antiretroviral therapy (ART) suppresses HIV-1 replication to undetectable levels in peripheral blood (PB) in most patients but cannot cure infection, because infection is rekindled by reactivation of virus production in latently infected memory CD4 T cells when ART is discontinued for any reason (1–5). Subsequent local expansion of infection and dissemination then reestablishes a robust systemic infection in the absence of suppressive ART.
This reconstruction of events in recrudescent infection in many ways recapitulates establishment of acute HIV-1 infection after sexual mucosal exposure by a single transmitter/founder virus (6), but the number of rebounding/founder (R/F) that emerges with treatment interruption has not been determined. The parallels with acute infection also suggest that the sources of rebounding virus in PB are the lymphoid tissues (LTs), which are the principal sites for virus production and persistence in HIV and simian immunodeficiency virus infection (7–12), but these LT reservoirs in recrudescent infection also have not been characterized.
To that end, we sampled inguinal lymph node (LN) and gut-associated lymphoid tissue (GALT) from HIV-infected subjects with longstanding viral suppression on ART, interrupted treatment, and then repeated LT sampling and reinstituted ART immediately after detection of PB viremia. We also derived minimal estimates of the number of R/F HIV variants in recrudescent viremia by single-genome amplification and phylogenetic analyses first described for viral transmission and acute infection (6). We show that recrudescent viremia is associated with multifocal infection in LTs and the generation of multiple R/F viruses in the PB. Thus, multifocal productive infection in LT and reactivation of virus production in many latently infected cells were sites and potential sources of rebound viremia in a significant proportion of the patients who we studied. These findings underscore the challenges in eradicating such a large reservoir to achieve a cure.
Results
Demographic Characteristics of the Cohort.
We enrolled 14 subjects into this University of Minnesota Institutional Review Board-approved protocol, and 12 subjects completed the study. Baseline characteristics of 14 study patients are shown in Table 1. All subjects were male with a median age of 44 y (26–61 y). Median durations of HIV infection and ART use were 14.6 y (3–25 y) and 10.1 y (1–19 y), respectively. All had been virally suppressed for at least 1 y before enrollment. One-half reported a history of an AIDS diagnosis, with a median CD4 nadir of 264 cells/µL (64–475 cells/µL). Two subjects reported an AIDS diagnosis because of non-Hodgkin lymphoma and a history of Pneumocystis jirovecii pneumonia, although their CD4 nadirs were >300 cells/µL.
Table 1.
Demographic characteristics of the cohort and data on treatment interruption
| Identification | Age (y) | Years HIV+* | ART (y) | CD4 nadir (cells/µL) | CD4 at entry (cells/µL) | Days to viral rebound | Peak viral load (copies/mL) | Total days off ART | Days to viral suppression after treatment resumption |
| 1064 | 61 | 25 | 17 | 89 | 307 | 15 | 6,663 | 20 | 14 |
| 1435 | 47 | 5.5 | 5.5 | 195 | 506 | 14 | 815 | 18 | 18 |
| 1670 | 37 | 18 | 11 | 390 | 672 | 14 | 7,895 | 19 | 47 |
| 1674 | 31 | 10 | 9.5 | 380 | 970 | 12 | 1,552 | 14 | 7 |
| 1675 | 26 | 5 | 1 | 343 | 294 | 19 | 1,833 | 24 | 7 |
| 1677 | 49 | 23 | 19 | 64 | 898 | 11 | 23,402 | 16 | 21 |
| 1775 | 49 | 12 | 12 | 475 | 857 | 29 | 60 | 29 | 8 |
| 1791† | 55 | 24 | 13 | 464 | 663 | NA | NA | 22 | NA |
| 1825 | 43 | 17 | 17 | 201 | 537 | 12 | 555 | 15 | 8 |
| 1837 | 46 | 11 | 10 | 109 | 492 | 9 | 308 | 10 | 40 |
| 1849 | 32 | 3.5 | 1.5 | 350 | 376 | 19 | 106 | 20 | 15 |
| 1853 | 47 | 23 | 15 | 200 | 420 | 14 | 857 | 20 | 20 |
| 1906 | 52 | 25 | 7 | 175 | 377 | 5 | 871 | 10 | 14 |
| 1928 | 43 | 3 | 3 | 270 | 492 | 16 | 1,820 | 22 | 6 |
| Mean (range) | 44.1 (26–61) | 14.6 (3–25) | 10.1 (1–19) | 264.6 (64–475) | 561 (294–970) | 14.4 (5–29) | 3,595 (60–23,402) | 18.5 (10–29) | 17.3 (6–47) |
NA, not applicable.
Years from first positive HIV test.
Subject did not become viremic.
The 14 subjects were on multiple ART regimens. Four subjects (1,670, 1,675, 1,775, and 1,791) were on efavirenz-containing regimens, which were replaced by atazanavir and ritonavir 1 mo before structured treatment interruption (STI) because of the long half-life of efavirenz to reduce the probability of development of resistance. Two subjects (1,825 and 1,906) were on raltegravir-based regimens, and the remaining subjects were on protease inhibitor-based regimens. All subjects had been on their regimen for at least 1 y before study enrollment.
STI Experimental Design.
We designed a short STI to assess LT sources of recrudescent viremia, in which we obtained baseline biopsies of LNs and GALT, interrupted treatment, and measured plasma viral load (pVL) at baseline and then on Monday, Wednesday, and Friday during treatment interruption. When virus became detectable (>75 copies/mL for the first five subjects and >48 copies/mL for the remainder of the subjects), subjects returned for repeat LT biopsies and were placed back on therapy. pVL was then measured weekly until undetectable and then every other week until two consecutive measures were undetectable. Study follow-up was then discontinued. The protocol specified that if subjects did not develop detectable pVL within 21 d of stopping ART, biopsies were repeated, and their original ART regimens were restarted. CD4 T-cell counts were obtained at all time points that pVL was measured.
After discontinuation of ART, the median time to detectable pVL was 14 d (range = 5–29 d) (Fig. 1 and Table 1). Two subjects did not develop viremia by day 21. ART was restarted on day 22 in one of the subjects (1,791). However, the other (1,775) subject opted to stay off of therapy until the development of viremia, which occurred at day 29. Biopsies were performed, and ART was reinitiated a mean of 5 d after the detection of viremia (range = 0–6 d). The delay of a few days to reinitiating ART reflects the time needed for bowel preparation for the colonoscopy and scheduling the LN biopsy. At the time that therapy was restarted, the median pVL was 1,552 copies/mL (range was <48–23,402 copies/mL), and the median time to undetectable pVL was also 14 d (range = 6–47 d).
Fig. 1.
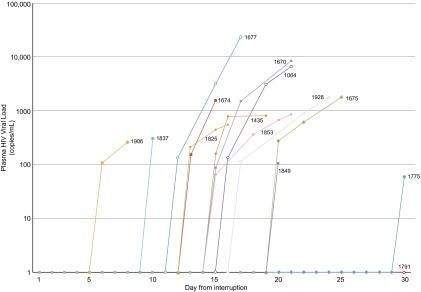
Time to detectable plasma viremia and peak before restarting ART. The pVL from study entry (before treatment interruption) to restarting ART is plotted against time for each subject. The difference in time between first detection and peak represents the time required for scheduling procedures and completing the colonoscopy preparation.
Three subjects had undetectable viremia within 7 d, and an additional eight subjects had undetectable viremia by 3 wk. pVL in the remaining two subjects was undetectable at days 40 and 47 after restarting ART. After viremia was undetectable, it remained undetectable in all subjects for two consecutive biweekly measures, at which time monitoring was discontinued. The TRUGENE commercial genotype/phenotype resistance assay was obtained on plasma from a time point immediately after viremia was detected, and in all cases, there were no new mutations detected that conferred resistance to any of the drugs used. Reactivation of viral replication was not associated with any clinical symptoms in any subject.
The median CD4 count at study entry was 561 cells/µL (range = 294–970 cells/µL), and at the time of viremia, it was 452 cells/µL (range = 200–1,113 cells/µL). The median CD4 count at the last visit (median of 41 d after treatment interruption; range = 19–90 d) was 564 cells/µL (range = 216–924 cells/µL). There was no significant change in CD4 T-cell count during the study (the P value for a linear CD4 trend over time was 0.18) (Fig. 2). Using an alternate analysis method, where we fit a model with linear and quadratic changes over time, we detected a transient decline in CD4 levels (P < 0.005) during the treatment interruption, but levels returned to baseline after resumption of ART. As we later comment, these rapid changes in CD4 T-cell levels in PB could well represent CD4 T-cell redistribution (13, 14) without a significant impact on population levels in the LTs, where they mainly reside (8, 15, 16).
Fig. 2.

Change in PB CD4 T-cell count during and after the interruption. PB CD4 T-cell count is plotted for each subject at baseline (while fully suppressed), at the time when viremia is first detected, at the peak (the day of biopsy), and again after the subject is fully suppressed. The black line indicates the mean for the group at each time point. There is no statistically significant change in CD4 T-cell count during the interruption or after pVL is again suppressed (the P value for a linear CD4 trend over time was 0.18).
Factors Affecting Time to Detection of Plasma HIV RNA.
We examined variables that might predict time to the development of viremia by assessing relationships between time to viremia, duration of HIV infection, baseline CD4 count, years on ART, CD4 nadir, and age. We found that the longer the duration of HIV infection (i.e., the longer time since the positive HIV test) and the shorter the duration of ART, the more quickly viremia developed after treatment interruption (P = 0.019 and P = 0.029, respectively). Similarly, lower reported CD4 nadir was associated with more rapid development of viremia (P = 0.016). Baseline CD4 count and age were not associated with time to viremia. Time to viral suppression after interruption and resumption of ART was not associated with age, duration of HIV infection, baseline CD4, years on ART, or CD4 nadir. We also examined changes in several inflammatory markers, including IL-6, d-Dimer, TNF, intestinal fatty acid binding protein (I-FABP), and soluble CD14 (sCD14), from baseline samples of plasma in seven subjects and frequency of Ki67+ cells in LN in all subjects. Pairwise associations using inflammatory marker data at the start of the treatment interruption and at the time of viremia revealed no significant association.
Detection of HIV RNA in LT.
Before treatment interruption, we were able to sample LN, ileum, and rectum biopsies from all subjects, and repeat biopsies were performed in 12 of 14 subjects at the time of recrudescence. Because of inherent limitations in the biopsy procedure (unable to find LN or inadequate bowel preparation), there was some variability in successfully sampling all three sites in all subjects at the time of recrudescent viremia. We were able to obtain LN, ileum, and rectum in 5 of 12 subjects, LN and rectum in 4 of 12 subjects, ileum and rectum in 2 of 12 subjects, and only rectum in 1 of 12 subjects.
Using 35S-labeled HIV-specific riboprobes and in situ hybridization (ISH) (17), we detected a single focus of HIV RNA-positive (vRNA+) cells at very low density in LN obtained from 3 of 12 subjects (1,677, 1,825, and 1,928) before treatment interruption (Table 2), a finding with an interpretation that we later discuss vis à vis the recently documented lower antiretroviral (ARV) levels in LNs (17). At baseline, all GALT samples (ileum and rectum) were negative. After treatment interruption (Table 2), vRNA+ cells were detected in LT obtained from 6 of 12 subjects (1,064, 1,675, 1,677, 1,825, 1,853, and 1,906) and from 4 of 6 subjects (1,064, 1,825, 1,853, and 1,906) in multiple anatomic sites (Fig. 3 and Table 2). Virus bound to the follicular dendritic network (FDCn) was also detected in three of six subjects (1,064, 1,675, and 1,853), and importantly, in subject 1,853, there was significant deposition of virus on the FDCn when the pVL was <1,000 copies/mL (Table 2). We later discuss the implied duration of infection along with the high density of vRNA+ cells in this subject relevant to unifocal vs. multifocal models of recrudescence (Fig. 5). At the time of biopsy, the pVL, the time to viral recrudescence after treatment interruption, and the time to biopsy after recrudescence did not differ between subjects with detectable vRNA+ cells and subjects in whom vRNA+ cells were not detected.
Table 2.
Frequency of detection of HIV by in situ hybridization in each anatomic compartment
| LN | Ileum | Rectum | |||||
| Identification and time point | vRNA+ cells* | FDC† | vRNA+ cells* | FDC† | vRNA+ cells* | FDC† | pVL |
| 1,064 | |||||||
| D0 | 0 | 0 | 0 | <75 | |||
| V | NTO | 2,870 | 33,300 | + | 6,662 | ||
| 1,435 | |||||||
| D0 | 0 | 0 | 0 | <48 | |||
| V | 0 | NTO | 0 | 815 | |||
| 1,670 | |||||||
| D0 | 0 | 0 | 0 | <75 | |||
| V | 0 | 0 | 0 | 7,895 | |||
| 1,674 | |||||||
| D0 | 0 | 0 | 0 | <75 | |||
| V | NTO | NTO | 0 | 1,552 | |||
| 1,675 | |||||||
| D0 | 0 | 0 | 0 | <75 | |||
| V | 2,680 | + | NTO | 0 | 1,833 | ||
| 1,677 | |||||||
| D0 | 79 | 0 | 0 | <75 | |||
| V | 67,900 | NTO | NTO | 23,042 | |||
| 1,775 | |||||||
| D0 | 0 | 0 | 0 | <48 | |||
| V | 0 | 0 | 0 | 60 | |||
| 1,791 | |||||||
| D0 | 0 | 0 | 0 | <48 | |||
| V | 0 | 0 | 0 | <48 | |||
| 1,825 | |||||||
| D0 | 626 | 0 | 0 | <48 | |||
| V | 1,370 | 0 | 2,100 | 555 | |||
| 1,853 | |||||||
| D0 | 0 | 0 | 0 | <48 | |||
| V | 106,000 | + | 25,000 | + | 0 | 857 | |
| 1,906 | |||||||
| D0 | 0 | 0 | 0 | <48 | |||
| V | 16,800 | 0 | 8,270 | 871 | |||
| 1,928 | |||||||
| D0 | 643 | 0 | 0 | <48 | |||
| V | 0 | 0 | 0 | 1,820 | |||
D0, day 0; FDC, follicular dendritic cell network accumulation of HIV; NTO, no tissue obtained; V, day HIV first detected in peripheral blood.
vRNA+ cells per 1 g tissue.
Significant accumulation of HIV virions on the FDC network.
Fig. 3.

HIV recrudescence from multiple anatomic sites on treatment interruption detected by ISH. A and B are of LN and ileum, respectively, obtained from subject 1,853, a 47-y-old male infected for 23 y and on ART for 15 y. pVL at the time of recrudescence was 857 copies/mL. When viewed in epipolarized light, the in situ hybridization signal for HIV RNA is a collection of green silver grains over cells or the FDCn (viral RNA in virions bound to the FDCn). (A) Arrow points to a dense cloud of virus particles attached to the FDCn. C and D are of ileum and rectum, respectively, from subject 1,064, a 61-y-old male infected for 25 y and on ART for 17 y. pVL at the time of the biopsy was 6,663 copies/mL. E and F are from LN and rectum, respectively, from subject 1,906, a 52-y-old male infected for 25 y and on ART for 7 y. pVL at the time of biopsy was 871 copies/mL.
Fig. 5.
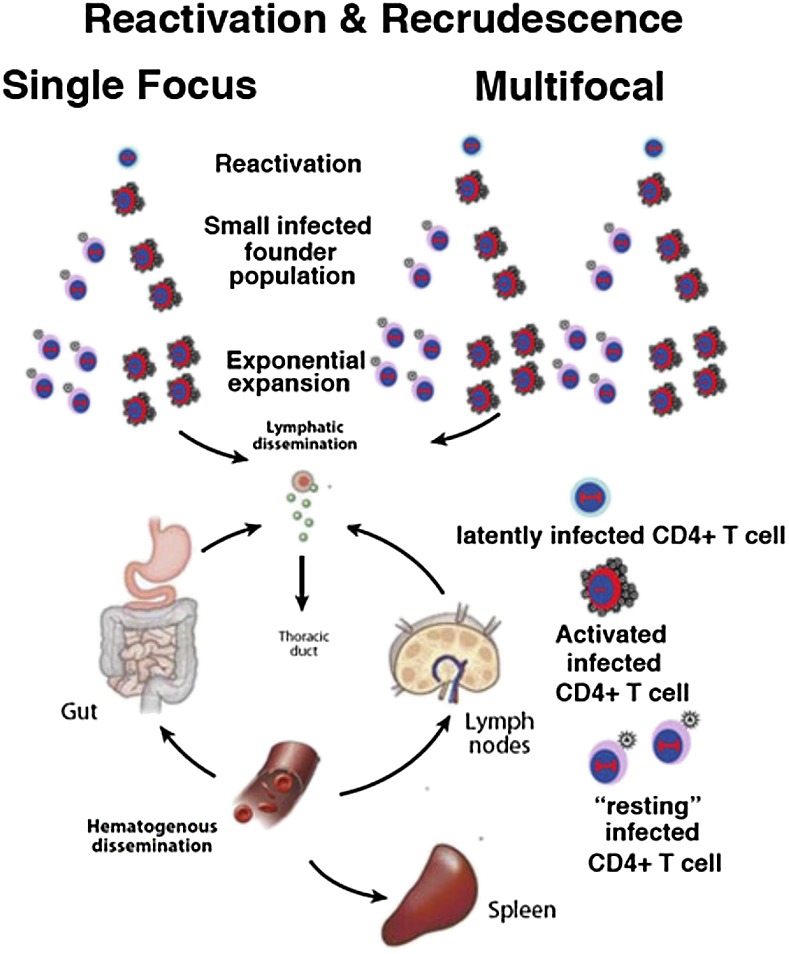
Model of the origins of recrudescent infection from one or many cells and sites. The model is based on events in early infection after sexual exposure (18) and the main types of infected cells in LT (8, 29, 30). When infected cells are detected after STI in LT biopsies, they theoretically could represent systemic infection seeded from a single focus or multiple foci, with levels of virus in the blood below the limits of detection. However, in the multifocal model, there is a greater likelihood of sampling a site from which infection initiated. In this case, there will be many infected cells in the focus and FDC deposits of virus, reflecting the greater duration of infection. The most important distinction, however, is virus genetic diversity, which will be greater in recrudescent infection from multiple cells and sites vs. monophyletic viruses from a single reactivating focus.
Sequence Analysis of R/F Virus.
We used single-genome amplification and direct sequencing of full-length env (gp160) to provide an unbiased assessment of the genetic diversity of R/F virus obtained from vRNA in plasma and peripheral blood mononuclear cells (PBMCs) and viral DNA (vDNA) from PBMCs. Blood plasma and PBMCs for sequencing were obtained from 2 d before detectable viremia to 2 d after rebound viremia. We obtained 311 single genome-amplified env sequences from 11 subjects with sufficient material for analysis. Phylogenetic analysis of all 11 subjects revealed individual clades for each patient, with no interpatient mixing of sequences (Fig. S1). Three subjects (1,928, 1,064, and 1,670) were excluded from intrapatient analyses because of insufficient sequencing data for intrapatient analyses. The remaining eight subjects had an average of 38 full env sequences combining vRNA and vDNA sequences (range = 10–65). In several subjects, individual lineages with sequences that were identical or nearly identical were observed, representing reactivation of virus production from a single latently infected cell or a clonally expanded population. However, the vast majority of sequences from all subjects represented unique viral lineages with extensive genetic diversity (Fig. 4). The mean intrapatient diversity was determined by pairwise analysis and ranged from 0.7% to 5.3%. The maximum intrapatient diversity was also determined by pairwise analysis and ranged from 2.2% to 9.0%.
Fig. 4.

Phylogenetic analysis of PBMCs and plasma viruses at recrudescence. Intrapatient phylogenetic analysis of eight patients revealed multiple variants initiating the reemergence of plasma viremia (blue). Additionally, PBMC-derived vRNA (orange) and vDNA (red) sequences revealed a highly divergent population likely contributing to recrudescent viremia. Patient identification and scale bar (nucleotide substitutions per site) are provided with each maximum likelihood tree along with the percentage of bootstrap support for each node with values greater than 80%.
Discussion
One widely held view of the origins of recrudescent infection when ARVs are discontinued is that infection begins by recapitulating the events in acute infection after a sexual transmission. Here, a small founder population of infected cells is established that then expands and seeds distal LT sites, where additional expansion establishes systemic infection (6, 18). For recrudescent infection, the initial event is reactivation of virus production in a latently infected CD4 T cell, with similar subsequent expansion and dissemination (Fig. 5).
This model is based on extensive studies of PB and therefore, not informed by direct analysis of viral reservoirs and sources of production in the LTs. Here, we report studies of the LTs during a short STI, in which we detected evidence in a significant proportion of subjects of multiple foci of vRNA+ cells in distinct LT sites and in the majority of subjects, highly genetically diverse viral populations in the PB. We interpret these findings as support for a multifocal model (Fig. 5) of recrudescent infection rekindled by reactivation in many more latently infected memory CD4+ T cells than has been appreciated in the past but consistent with recent estimates of latently infected cells with replication-competent proviruses in PB alone (19), the 20- to 60-fold more CD4+ T cells that reside in LT compared with PB (8, 15, 16), and direct early estimates by in situ PCR of ∼1010 covertly infected (vDNA+ vRNA−) helper CD4+ T cells in LT (7).
Evidence of multifocal LT infection does not per se distinguish between recrudescent infection originating in one, a few, or many sites, because hypothetically, a local infection could seed distal sites at levels of virus in PB below the limits of detection; thus, the multifocal infections at the time that viremia was detected could simply reflect virus production from this earlier undetected spread (Fig. 5). However, there are some features of the multifocal LT infection that are more consistent with infection originating at multiple sites. Specifically, subjects 1,825, 1,853, and 1,906 had evidence of extensive LT infection and FDC deposits, implying considerable duration of infection, but pVLs were very low, suggesting that infection in LTs preceded rather than followed recent dissemination to these sites.
The striking genetic diversity and complex phylogenetic trees, with identification of 5–25 R/F viruses in the majority of subjects, are, in our view, the most compelling evidence for the multifocal origins of recrudescent infection. One subject did have viral sequences composed of identical or nearly identical variants (1,674), which could represent either recrudescent viremia from a single viral source followed by viral expansion or a low-diversity lineage originating from multiple sources that have clonally expanded during therapy. The virus in these low-diversity clusters might have begun replicating before the other clones or had a fitness advantage to allow for an increase in the proportion. Alternatively, viral rebound was initiated from multiple sources that included clonally expanded virus that is genetically indistinguishable but outgrew other sources because of a larger initial infected population. Both explanations are possible but indistinguishable from this analysis. Similarly, Kearney et al. (20) assessed viral sequences in PB in five subjects before treatment, on therapy, and after treatment interruption and found that rebounding virus primarily consisted of a population of identical sequences. This result is consistent with a stable, nonevolving reservoir as the source of rebound viremia. However, the results are also consistent with recrudescent viremia from a single viral source leading to systemic dissemination or from multiple sources in LT that have clonally expanded before rebound. In this study, we were limited to postinterruption samples and in some cases, only PBMC samples for genetic analysis, but despite these limitations, the complex and divergent viral population found immediately after treatment interruption shows a very large underlying reservoir population capable of reestablishing viremia.
This LT study was limited in the sampling possible in human studies. To put this in perspective, we sampled 1 LN at each time point of ∼500 LNs in the average human and detected vRNA+ cells in one-half of the subjects in sections representing 3 × 10⁻⁴% of the LN tissue in a 75-kg individual. Similarly, for GALT samples, the area of the intestine in a normal adult human is ∼300 m2, whereas the area of a pinch biopsy is 3 × 10⁻⁶ m2. We analyzed a total of 28 pinch biopsies (i.e., 14 from ileum and 14 from rectum, which is 8.4 × 10⁻⁵ m2 tissue), which represents ∼2.8 × 10⁻⁵% of the total area of the intestine. Thus, the detection of vRNA+ cells at multiple sites in so many patients is all the more remarkable and consistent with reactivation at many sites when treatment was discontinued.
In the context of the limited sampling of LT, the detection of vRNA+ cells in LN biopsies of three subjects before discontinuing ARVs is also remarkable. In these in situ hybridization snapshots of infection, vRNA+ cells could be examples of transcriptional reactivation in latently infected cells or continuing viral replication in LT viewed as a system. By this we mean that, under suboptimal ARV drug levels in LN, there are, perhaps, a few cycles of virus production and rounds of infection at multiple sites in the LT system as a whole (unlike in vitro infections, where ongoing replication will be detectable within a confined system of infected cells and permissive target cells). The smaller proportion of subjects and the fewer vRNA+ cells in this cohort of well-suppressed subjects are also consistent with our prior analysis of a cohort of patients at 6 mo after initiating ARVs. In the work by Fletcher et al. (17), it was shown that the rates at which the FDC pool and infected cells decayed slowed in four of eight subjects, consistent with a low level of ongoing replication. Detecting a low frequency of vRNA+ cells in LT of long-term suppressed subjects is, thus, quite consistent with extrapolating this slowed rate at 6 mo to this time frame.
Our findings also highlight several additional points regarding HIV reservoirs. We found that time to viremia was more rapid in subjects with low CD4 nadir, consistent with evidence that CD4 depletion is a strong predictor of viral reservoir size (21), and subjects with longer duration of infection and a shorter period of exposure to suppressive ART, suggesting, as has been reported, that duration of viremia drives reservoir size (22–24). We also found that the longest time to rebound viremia (29 d) was observed in a subject who had been started on ART within 6 mo of acquiring infection, consistent with reports that early treatment limits reservoir size but does not prevent the recrudescence of viremia in the absence of ART (25).
Given the focus on developing therapies aimed at producing functional cure and the need to test the efficacy of such therapies by interruption of standard ART, it is important to note that our protocol was safe and well-tolerated by all participants. As expected, the majority of subjects developed detectable viremia during treatment interruption, but all achieved rapid viral suppression after reinitiation of ART and remained virally suppressed during follow-up. No resistance-conferring mutations were detected in any subjects on viral rebound. Importantly, we found no significant overall change in CD4 count associated with our short STI. We detected a transitory decline in CD4 levels shortly after treatment interruption, but counts then rebounded and returned to pre-STI levels over the remaining duration of the protocol. This rapid decline and rebound are consistent with previous observations on CD4 T-cell redistribution (13, 14) and the conclusion that very short therapy interruptions in subjects with preserved CD4 counts do not have the ongoing detrimental immunologic impact seen with longer treatment interruptions. The safety of brief STI is supported by several other studies (26–28) showing that brief STIs do not affect overall CD4 T-cell count and importantly, do not diminish immune function as determined by antigen recall responses.
In summary, we show that virus rebound on treatment interruption is evident at multiple sites with a highly complex and genetically diverse population of virions, consistent with reactivation from a large pool of latently infected cells. Efforts at eradication will need to target these multiple reservoirs if a cure strategy is to be successful.
Materials and Methods
Study Population.
Between July of 2009 and April of 2011, in total, 14 subjects were enrolled into this treatment interruption protocol. Subjects were required to be virally suppressed on uninterrupted ART for at least 12 mo, have a CD4 count >350 cells/µL, have no history of prior treatment interruptions, have no contraindications to study procedures, and have palpable inguinal LNs at screening. All subjects provided written informed consent, and the study was approved by the University of Minnesota Institutional Review Board.
Study Procedures.
At screening, PB was obtained to determine CD4 count and pVL, and physical examination was performed to ensure the presence of palpable inguinal LNs. One month before study initiation, ART was adjusted in patients taking a nonnucleoside reverse transcriptase inhibitor (NNRTI)-based regimen to a protease inhibitor-based regimen given the long half-life of NNRTIs and the risk of resistance in the setting of treatment interruption. Usual nucleoside/nucleotide reverse transcriptase inhibitors and raltegravir were continued.
At study initiation, subjects underwent bowel preparation using Go-Lytely. The next day, blood was obtained for pVL, CD4 count, complete blood count (CBC), comprehensive metabolic panel (CMP), and isolation of plasma and mononuclear cells. Colonoscopy with 14 snip biopsies of both the terminal ileum and rectum was performed followed by inguinal LN resection under local anesthesia. The subject was then instructed to stop ART. After ART discontinuation, pVL and CD4 were monitored three times weekly; pVL results were available within 24 h of blood draw. After pVL was detectable, repeat biopsies were scheduled, and the subject underwent bowel preparation the day prior. On the day of biopsies, blood was obtained for pVL, CD4, CBC, CMP, genotype/phenotype, and isolation of plasma and mononuclear cells for viral sequencing. Colonoscopy with biopsies and LN resection were then repeated, and the subject’s usual ART regimen was restarted. If subjects did not develop detectable virus within 21 d of ART discontinuation, CBC, CMP, and CD4 were obtained, biopsies were repeated, and ART was restarted on day 22. After reinitiation of therapy, pVL and CD4 count were obtained weekly until undetectable and then, every other week until two consecutive measures were undetectable. In a subset of subjects, plasma levels of IL-6, sCD14, and I-FABP were determined at study initiation.
Clinical and Study Laboratory Procedures.
HIV-1 viral load testing was performed at the Hennepin County Medical Center Clinical Virology Laboratory. Siemens assay platform with a limit of detection of 75 copies/mL was used for subjects 1,064, 1,670, 1,674, 1,675, and 1,677. The Roche platform, with a limit of detection of 48 copies/mL, was used for all other subjects. CD4 count, CBC, and CMP testing were performed at the University of Minnesota Fairview Clinical Laboratory. Siemens TRUGENE HIV-1 genotype/phenotype assay was used to detect ART resistance.
For isolation of plasma, PB was collected in acid citrate dextran tubes. Tubes were centrifuged at 400 × g for 10 min at room temperature. Plasma was removed and stored at −80 °C until shipment to the National Institutes of Health. For PB mononuclear cell isolation, blood collected in acid citrate dextran tubes was diluted 1:1 with PBS. A matched volume of Histoplaque-1077 was pipetted into an empty conical tube, and diluted blood was overlaid. The tube was then centrifuged at 400 × g for 30 min at room temperature without a brake. The buffy coat layer was then pipetted off and divided between two 50-mL conical tubes. Complete RPMI (CRPMI) was added to each tube to bring the total volume to 50 mL. Tubes were centrifuged at 400 × g for 10 min at room temperature. Liquid was pipetted off of the cellular pellet. Pellets were combined and resuspended in 25 mL CRPMI; then, they were centrifuged at 250 × g for 10 min to remove platelets. The pellet was resuspended in 20 mL CRPMI. A 10-μL aliquot was removed and added to 90 μL trypan blue for counting by hemocytometer. The cell suspension was centrifuged at 400 × g for 5 min at room temperature. The cell pellet was then resuspended in Freezing Media [90% (vol/vol) FBS:10% (vol/vol) DMSO] to achieve a concentration of 1 × 10⁷ cells/mL.
Commercially available ELISAs were used according to the manufacturers’ protocols for measuring sCD14 (R&D Systems), IL-6, and I-FABP (Cell Sciences).
In Situ Hybridization.
At the time of collection, samples of LN, ileum, and rectum were transferred directly to 4% (vol/vol) paraformaldehyde for 4–6 h, washed in 80% (wt/vol) ethanol, and embedded in paraffin. Five-micrometer sections were used for in situ hybridization. Five-micrometer-thick sections from the paraffin-embedded tissue were cut through the entire tissue block. We analyzed a total of 20 sections from each block using every fourth section so that we were measuring virus production in 20-μm intervals. After deparaffinization with xylene and rehydration through graded ethanols, tissue sections were treated with HCl, triethanolamine, digitonin, and 4 μg/mL Proteinase K as described (17). After acetylation with acetic anhydride and dehydration, they were hybridized at 45 °C overnight with a 35S-labeled riboprobe and 0.5 mM aurintricarboxylic acid in the hybridization mix. After extensive washes and ribonuclease treatment, tissue sections were dehydrated, coated in Ilford K5 emulsion diluted with glycerol and ammonium acetate, exposed at 4 °C for 7–14 d, developed, and fixed per the manufacturer’s instructions. They were stained with hematoxylin, dehydrated, and mounted with Permount. Photographic images using epifluorescence were taken with a digital camera, and the tif images were analyzed for the area of the sections and the area occupied by silver grains using Photoshop with Fovea Pro. Section weights were estimated from their 5-μm thickness and area and density of fixed tissues (9).
Single-Genome Amplification and Analysis.
The HIV-1 env gene was amplified from cell-associated vRNA or genomic DNA and from vRNA in blood plasma. Cell-associated viral RNA is a good surrogate for replicating virus and was used in conjunction with plasma viral RNA where samples were available. Single-genome amplification followed by the direct sequencing approach was used to eliminate Taq-induced errors and in vitro recombination as described (6). Viral RNA and genomic DNA were isolated from PBMCs using Phenol extraction, and vRNA was isolated from plasma using a QIAamp Viral RNA Kit (Qiagen). Viral RNA was reverse-transcribed into cDNA in a final volume of 100 µL, including 50 µL viral RNA, 5 µL dNTP mix (each at 10 mM), 1.25 µL antisense primer envB3out 5′-TTG CTA CTT GTG ATT GCT CCA TGT-3′ at 20 µM, 20 µL 5× first-strand buffer, 5 µL DTT at 100 mM, 5 µL RNaseOUT (Invitrogen), and 5 µL SuperScript III reverse transcriptase. RNA, primers, and dNTPs were heated at 65 °C for 5 min and then chilled on ice for 1 min; then, the entire reaction was incubated at 50 °C for 60 min followed by 55 °C for an additional 60 min. Finally, the reaction was heat-inactivated at 70 °C for 15 min and then treated with 1 µL RNase H each at 37 °C for 20 min. Then, cDNA or DNA templates were serially diluted until only a fraction (∼25%) of amplicons were PCR-positive with the following PCR conditions. PCR amplification was carried out using the Platinum Taq (Invitrogen) with 1× buffer, 2 mM MgCl2, 0.2 mM each dNTP, 0.2 μM each primer, and 0.025 units/µL Platinum Taq polymerase. The primers for the first-round PCR were envB5out 5′-TAG AGC CCT GGA AGC ATC CAG GAAG-3′ and envB3out 5′-TTG CTA CTT GTG ATT GCT CCA TGT-3′. The primers for the second-round PCR were envB5in 5′-CAC CTT AGG CAT CTC CTA TGG CAG GAA GAAG-3′ and envB3in 5′-GTC TCG AGA TAC TGC TCC CAC CC-3′. The cycler parameters were 94 °C for 2 min followed by 35 cycles of 94 °C for 15 s, 55 °C for 30 s, and 68 °C for 4 min and a final extension of 68 °C for 10 min. The product of the first-round PCR (1 µL) was subsequently used as a template in the second-round PCR under the same conditions but with a total of 45 cycles. All PCR-positive amplicons were directly sequenced using BigDye Terminator chemistry (Applied Biosystems). Any sequence with evidence of double peaks was excluded from additional analysis. Apolipoprotein B mRNA editing enzyme, catalytic polypeptide-like mutated sequences, as determined by HyperMut (www.hiv.lanl.gov), were retained in phylogenetic trees but excluded from diversity analyses. Env sequences were aligned with ClustalW, and phylogenetic trees were constructed using maximum likelihood methods with a general time reversible with γ-model implemented in MEGA-6 Mac. Diversity measurements were determined using pairwise comparisons. Accumulated changes within defined genetic clusters were characterized using Poisson fitter (www.hiv.lanl.gov). All 311 sequences were deposited in GenBank with accession numbers KM081846–KM082156.
Statistical Methods.
To test for a change in CD4 counts on initiating an STI, a mixed effects model was used to account for the longitudinal nature of these data, because most subjects had CD4 counts available every 2–3 d. The model used the logarithm of the CD4 count as a response variable, with time as the other response variable. Random intercepts were used to account for the within-subject correlation of measurements (models with random slopes were also considered but provided a worse fit given the increase in the number of parameters as judged by Akaike's information criterion). Restricted maximum likelihood was used to obtain parameter estimates, and the test for no change over time was conducted using a Wald test for the estimated slope over time. Linear and quadratic temporal trends were considered in these models, and a likelihood ratio test was used to test the fit of the model with quadratic effects over time to the null model with no effect for time.
To test for associations between clinical variables and time to viremia, a multiple linear regression model was fit that had the logarithm of the time to viremia as the response variable and all variables from Table 1 that were observed before initiating the treatment interruption (i.e., age, years positive, day 0 CD4 levels, years on treatment, and nadir CD4 count). Data from the one subject who did not return to being viremic were excluded from these models. Tests of the regression coefficients in these models were used to test for associations between variables given the effect of other variables in the model (i.e., we did not engage in any model-building exercise that may result in overfitting). To investigate the robustness of the findings, we also fit the same model but used a Cox proportional hazards model (which allows inclusion of the data from the subject who did not become viremic). Because of the small sample size, permutations were used to compute P values. This analysis also detected significant associations between years positive (P = 0.05) and nadir CD4 counts (P = 0.004), but the effect of years on treatment just missed significance (P = 0.07). These slightly different results are consistent with the lower power that one expects from a semiparametric model. All calculations were conducted using R, version 3.1.0 and the lme and survival packages for R.
Supplementary Material
Acknowledgments
This work was supported by NIH Grant P01AI074340 and in part with federal funds from the National Cancer Institute (NIH Contract HHSN261200800001E).
Footnotes
The authors declare no conflict of interest.
This article is a PNAS Direct Submission.
Data deposition: The sequences reported in this paper have been deposited in the GenBank database (accession nos. KM081846–KM082156).
This article contains supporting information online at www.pnas.org/lookup/suppl/doi:10.1073/pnas.1414926112/-/DCSupplemental.
References
- 1.Chun TW, et al. Quantification of latent tissue reservoirs and total body viral load in HIV-1 infection. Nature. 1997;387(6629):183–188. doi: 10.1038/387183a0. [DOI] [PubMed] [Google Scholar]
- 2.Finzi D, et al. Identification of a reservoir for HIV-1 in patients on highly active antiretroviral therapy. Science. 1997;278(5341):1295–1300. doi: 10.1126/science.278.5341.1295. [DOI] [PubMed] [Google Scholar]
- 3.Wong JK, et al. Recovery of replication-competent HIV despite prolonged suppression of plasma viremia. Science. 1997;278(5341):1291–1295. doi: 10.1126/science.278.5341.1291. [DOI] [PubMed] [Google Scholar]
- 4.Finzi D, et al. Latent infection of CD4+ T cells provides a mechanism for lifelong persistence of HIV-1, even in patients on effective combination therapy. Nat Med. 1999;5(5):512–517. doi: 10.1038/8394. [DOI] [PubMed] [Google Scholar]
- 5.Siliciano JD, et al. Long-term follow-up studies confirm the stability of the latent reservoir for HIV-1 in resting CD4+ T cells. Nat Med. 2003;9(6):727–728. doi: 10.1038/nm880. [DOI] [PubMed] [Google Scholar]
- 6.Keele BF, et al. Identification and characterization of transmitted and early founder virus envelopes in primary HIV-1 infection. Proc Natl Acad Sci USA. 2008;105(21):7552–7557. doi: 10.1073/pnas.0802203105. [DOI] [PMC free article] [PubMed] [Google Scholar]
- 7.Embretson J, et al. Massive covert infection of helper T lymphocytes and macrophages by HIV during the incubation period of AIDS. Nature. 1993;362(6418):359–362. doi: 10.1038/362359a0. [DOI] [PubMed] [Google Scholar]
- 8.Haase AT. Population biology of HIV-1 infection: Viral and CD4+ T cell demographics and dynamics in lymphatic tissues. Annu Rev Immunol. 1999;17:625–656. doi: 10.1146/annurev.immunol.17.1.625. [DOI] [PubMed] [Google Scholar]
- 9.Haase AT, et al. Quantitative image analysis of HIV-1 infection in lymphoid tissue. Science. 1996;274(5289):985–989. doi: 10.1126/science.274.5289.985. [DOI] [PubMed] [Google Scholar]
- 10.Schacker T, et al. Productive infection of T cells in lymphoid tissues during primary and early human immunodeficiency virus infection. J Infect Dis. 2001;183(4):555–562. doi: 10.1086/318524. [DOI] [PubMed] [Google Scholar]
- 11.Schacker T, et al. Rapid accumulation of human immunodeficiency virus (HIV) in lymphatic tissue reservoirs during acute and early HIV infection: Implications for timing of antiretroviral therapy. J Infect Dis. 2000;181(1):354–357. doi: 10.1086/315178. [DOI] [PubMed] [Google Scholar]
- 12.Reinhart TA, et al. Simian immunodeficiency virus burden in tissues and cellular compartments during clinical latency and AIDS. J Infect Dis. 1997;176(5):1198–1208. doi: 10.1086/514113. [DOI] [PubMed] [Google Scholar]
- 13.Bucy RP, et al. Initial increase in blood CD4(+) lymphocytes after HIV antiretroviral therapy reflects redistribution from lymphoid tissues. J Clin Invest. 1999;103(10):1391–1398. doi: 10.1172/JCI5863. [DOI] [PMC free article] [PubMed] [Google Scholar]
- 14.Pakker NG, et al. Biphasic kinetics of peripheral blood T cells after triple combination therapy in HIV-1 infection: A composite of redistribution and proliferation. Nat Med. 1998;4(2):208–214. doi: 10.1038/nm0298-208. [DOI] [PubMed] [Google Scholar]
- 15.Zhang ZQ, et al. Kinetics of CD4+ T cell repopulation of lymphoid tissues after treatment of HIV-1 infection. Proc Natl Acad Sci USA. 1998;95(3):1154–1159. doi: 10.1073/pnas.95.3.1154. [DOI] [PMC free article] [PubMed] [Google Scholar]
- 16.Savkovic B, et al. T-lymphocyte perturbation following large-scale apheresis and hematopoietic stem cell transplantation in HIV-infected individuals. Clin Immunol. 2012;144(2):159–171. doi: 10.1016/j.clim.2012.06.004. [DOI] [PubMed] [Google Scholar]
- 17.Fletcher CV, et al. Persistent HIV-1 replication is associated with lower antiretroviral drug concentrations in lymphatic tissues. Proc Natl Acad Sci USA. 2014;111(6):2307–2312. doi: 10.1073/pnas.1318249111. [DOI] [PMC free article] [PubMed] [Google Scholar]
- 18.Haase AT. Targeting early infection to prevent HIV-1 mucosal transmission. Nature. 2010;464(7286):217–223. doi: 10.1038/nature08757. [DOI] [PubMed] [Google Scholar]
- 19.Ho YC, et al. Replication-competent noninduced proviruses in the latent reservoir increase barrier to HIV-1 cure. Cell. 2013;155(3):540–551. doi: 10.1016/j.cell.2013.09.020. [DOI] [PMC free article] [PubMed] [Google Scholar]
- 20.Kearney MF, et al. Lack of detectable HIV-1 molecular evolution during suppressive antiretroviral therapy. PLoS Pathog. 2014;10(3):e1004010. doi: 10.1371/journal.ppat.1004010. [DOI] [PMC free article] [PubMed] [Google Scholar]
- 21.Boulassel MR, et al. CD4 T cell nadir independently predicts the magnitude of the HIV reservoir after prolonged suppressive antiretroviral therapy. J Clin Virol. 2012;53(1):29–32. doi: 10.1016/j.jcv.2011.09.018. [DOI] [PubMed] [Google Scholar]
- 22.Piketty C, et al. ANRS 116 SALTO Study Group A high HIV DNA level in PBMCs at antiretroviral treatment interruption predicts a shorter time to treatment resumption, independently of the CD4 nadir. J Med Virol. 2010;82(11):1819–1828. doi: 10.1002/jmv.21907. [DOI] [PubMed] [Google Scholar]
- 23.Jain V, et al. Antiretroviral therapy initiated within 6 months of HIV infection is associated with lower T-cell activation and smaller HIV reservoir size. J Infect Dis. 2013;208(8):1202–1211. doi: 10.1093/infdis/jit311. [DOI] [PMC free article] [PubMed] [Google Scholar]
- 24.Buzon MJ, et al. Long-term antiretroviral treatment initiated at primary HIV-1 infection affects the size, composition, and decay kinetics of the reservoir of HIV-1-infected CD4 T cells. J Virol. 2014;88(17):10056–10065. doi: 10.1128/JVI.01046-14. [DOI] [PMC free article] [PubMed] [Google Scholar]
- 25.Chun TW, et al. Rebound of plasma viremia following cessation of antiretroviral therapy despite profoundly low levels of HIV reservoir: Implications for eradication. AIDS. 2010;24(18):2803–2808. doi: 10.1097/QAD.0b013e328340a239. [DOI] [PMC free article] [PubMed] [Google Scholar]
- 26.Seminari E, De Silvestri A, Boschi A, Tinelli C. CD4+ guided antiretroviral treatment interruption in HIV infection: A meta-analysis. AIDS Rev. 2008;10(4):236–244. [PubMed] [Google Scholar]
- 27.Alexander TH, et al. Changes in CD4+ T-cell differentiation phenotype during structured treatment interruption in patients with chronic HIV-1 infection. J Acquir Immune Defic Syndr. 2003;34(5):475–481. doi: 10.1097/00126334-200312150-00005. [DOI] [PubMed] [Google Scholar]
- 28.Fillaux J, et al. Predictive factors of treatment interruption duration in a cohort of HIV-1 infected patients with CD4 count greater than 350 cells per mm3. Med Mal Infect. 2006;36(6):335–339. doi: 10.1016/j.medmal.2006.01.009. [DOI] [PubMed] [Google Scholar]
- 29.Zhang Z-Q, et al. Sexual transmission and propagation of simian and human immunodeficiency viruses in two distinguishable populations of CD4+ T cells. Science. 1999;286:1353–1357. doi: 10.1126/science.286.5443.1353. [DOI] [PubMed] [Google Scholar]
- 30.Li Q, et al. Peak SIV replication in resting memory CD4+ T cells depletes gut lamina propria CD4+ T cells. Nature. 2005;434(7037):1148–1152. doi: 10.1038/nature03513. [DOI] [PubMed] [Google Scholar]
Associated Data
This section collects any data citations, data availability statements, or supplementary materials included in this article.