

Abstract
Over the past 5 years, the fastest growing new area of physical activity research centered around the concept that the large amount of time people spend sitting inactive may have significant physiological consequences hazardous to human health, including risk for type 2 diabetes and poor metabolism of lipids and glucose. Meta-analysis (10 studies) suggest there is a 112% greater relative risk associated with a large duration of sedentary behavior for type 2 diabetes. Meta-analysis also indicates significantly greater odds for metabolic syndrome. We also summarize results for 7 studies using objective measures of total sedentary time and focusing on cardiometabolic risks in persons at high risk for type 2 diabetes or already diagnosed with type 2 diabetes. The underlying hypothesis introduced in 2004 by the inactivity physiology paradigm, has been that frequent and abundant contractile activity by certain types of skeletal muscle can have a potent influence on key physiological processes, even when the intensity is below that achieved through exercise. We explain some of the mechanisms for why the metabolism in slow-twitch oxidative skeletal muscle is key for understanding the healthy responses to low intensity physical activity (LIPA). Findings from objective measures from inclinometry indicated that the quartile range for weekly sedentary time is ~29 hours/week. The total daily time that people sit, stand, and accumulate non-exercise steps is independent of traditionally recommended moderate-vigorous physical activity (MVPA). The large amount of sedentary time associated with risk for disease can only be reduced significantly with safe and non-fatiguing LIPA, especially in the most at risk proportion of the population. Importantly, experimental studies are starting to indicate that it will be especially insightful to understand the acute dose-response effects of LIPA in order to understand why reducing sedentary time can improve lipid and glucose metabolism for the prevention and treatment of chronic disorders related to type 2 diabetes.
Introduction
Physical activity guidelines and recommendations for type 2 diabetes, impaired glucose tolerance, dyslipidemia, and general health gains have historically emphasized moderate-vigorous physical activity (MVPA), or activity greater than ~45% of VO2 max (1,2). There has been a rapid emergence of studies indicating that metabolic disease risks are also associated with sedentary behavior, which takes up the majority of the waking day when people are sedentary, displacing potentially large amounts of time people can be active throughout the whole day (3–10). In this review we will examine the associations between sedentary behavior and risk for type 2 diabetes, metabolic syndrome as well as specific cardiometabolic risk factors. Physiological studies have highlighted the importance of paying attention to all active and inactive behaviors over the entire waking day (4–8). This includes the need for carefully understanding how a very high duration of low-intensity physical activity bouts throughout the day (dozens of hours per week) can replace large amounts of sedentary time (5). Finally, we will describe the emerging evidence that acute metabolic responses in relatively fatigue-resistant slow twitch oxidative skeletal muscle may play a central role in combating the diseases associated with too much sitting (7). These acute responses are poised to contain the most potent mechanisms leading to solutions targeted at overcoming the hazards of sitting too much (4). This manuscript frequently draws out the contrast between high duration-high frequency lower intensity physical activity (LIPA) performed over many hours of the day as being a very different type of behavior to the much less abundant MVPA or aerobic exercise that is already so well described in the physical activity guidelines (2). Thus, when considering why sedentary time is unhealthy and what solutions will most logically correct the underlying problems directly, one needs to fully appreciate the vast differences between the traditional focus on physiological influences of exercise versus inactivity physiology.
Disease risks are associated with many hours per day of sitting idle, averaging ~10 hrs/day or 70 hrs each week. A goal of inactivity physiology is to develop the most effective, feasible, and safest mode of physical activity to reduce as many hours per week of sedentary time as is possible for disease prevention. This research is distinct from exercise physiology, which historically has focused on MVPA performed during only a small part of the week (~150 min/week). The prescription for exercise is not only too brief but also too intense to be used as replacement for the vast amount of sedentary time currently linked with disease. This new discipline of inactivity physiology is devoted to understanding the health consequences of modern lifestyles shaped by far too many hours of muscular inactivity (mostly during sitting) and the best solutions for changing those lifestyles for improving human physiology and disease prevention.
Associations between sedentary behaviors and type 2 diabetes
Relatively high amounts of sedentary time (daily/weekly sitting time) have been associated with significantly greater risk for type 2 diabetes and metabolic syndrome in two meta-analyses (Table 1). One meta-analysis examined 10 studies (6 prospective) including 505,045 participants (10) and found that there was a 112% greater pooled relative risk of diabetes associated with large vs. small amounts of TV time (typically differing by a few hours per day as shown in Table 1, column 4). To put these results in perspective, the meta-analysis providing support for the current U.S. federal physical activity guidelines was associated with a 1.4 fold greater pooled relative risk of diabetes for people who did not meet the guideline-defined types of activity, such as brisk walking (2). As is often the case in studies focused on the risks of sedentary behavior, the relationships between TV time and type 2 diabetes were independent of self-reported “physical activity” (meaning exercise-like behaviors). This is likely relevant to the objective evidence that sedentary time is unrelated to the time that people engage in the activity profile currently recommended in the U.S. federal guidelines (12). Authors also concluded from meta-analysis that sedentary time is associated with an increased risk of cardiovascular disease and all-cause mortality, while the strength of the association is most consistent for type 2 diabetes (10).
Table 1.
The associations of sedentary time with diabetes and metabolic syndrome.
| Type 2 Diabetes meta-analysis | Metabolic Syndrome meta-analysis | |||||
|---|---|---|---|---|---|---|
| Risk/Hazard Ratio | N | Yrs F/U | Low vs High TV | Reference | Odds Ratios (95% CI) | Reference |
| 2.87† (1.46, 5.65) | 37,918 | 10 | <0.14h vs >5.7h/d* | Hu (14)#Δ | 1.89† (1.42, 2.53) | Bertrais (21) |
| 1.70† (1.19, 2.42) | 68,497 | 6 | <0.14h vs >5.7h/d* | Hu (31) | 1.84† (1.41, 2.39) | Dunstan (22) |
| 2.34† (1.41, 3.90) | 8,299 | XC | <2h vs >2h/d* | Dunstan (18)# | 2.07† (1.23, 3.46) | Ford (23) |
| 1.86† (1.54, 2.24) | 45,668 | 10 | <1h vs >5h/day | Krishnan (15) #Δ | 2.20†‡ (1.10, 4.20) | Gao (24) |
| 2.18† (1.95, 2.43) | 60,903 | XC | <1h vs >3h/day | Tonstad (16)#Δ | 2.99†‡ (0.83, 10.84) | Li (25) |
| 1.63† (1.17, 2.27) | 23,855 | 7.8 | <1h vs >4h/day | Ford (17)# | 1.68† (1.34, 2.11) | Chang (26) |
| 2.75 (1.83, 4.13) | 4,512 | 4.3 | <2h vs ≥4h/day | Stamatakis (32) | 1.52 (1.01, 2.29) | Chen (27) |
| 1.85 (1.41, 2.43) | 12,608 | XC | <2.5h vs >3.6h/day | Wijndaele (33) | 1.72†‡ (1.26, 2.35) | Sisson (28) |
| 1.22 (0.87, 1.72) | 1,966 | XC | <2h vs >4h/day | Hawkes (34) | 1.87 (1.17, 2.99) | Trinh (29) |
| 4.00 (3.62, 4.42) | 240,819 | XC | <1h vs ≥7h/d | Matthews (35) | 3.10 (2.08, 4.62)A | Bankoski (30)#Δ |
|
| ||||||
| 2.12 (1.61, 2.78) | Pooled RR | 1.73 (1.55, 1.94) | Total | |||
The risk/odds ratios from meta-analyses for type 2 diabetes (10) and metabolic syndrome (3) were calculated for differences between the low and high categories of sedentary behavior as defined within each respective study, and adjusted for confounding variables such as age, smoking, and sex. N, number of study participants. Yrs F/U, years follow-up. XC, cross-sectional study.
h/d converted from h/week. Some of the specific ratios presented are after adjustment for BMI and/or MVPA.
value adjusted for physical activity (MVPA),
value adjusted for BMI,
study also examined adjustment for BMI (adjusted risk/hazard ratios not shown),
risk/hazard ratio were still statistically significant after adjusting for BMI (adjusted risk/hazard ratio not shown).
Sedentary time was expressed as the % of wear time, a parameter less influenced by errors from non-wear time. When sedentary time was expressed as the % of wear time and the odds ratio was adjusted for BMI and average acceleration counts/min when active, in addition to age, sex, ethnicity, education, alcohol, consumption, smoking, diabetes, and heart disease, then the OR=1.61 (0.97, 2.67) (30). The meta-analysis (3) used a parameter of sedentary time from Ref. 30 to calculate the total OR, expressed in hours/day and adjusted for BMI and average acceleration counts/min when active, in addition to age, sex, ethnicity, education, alcohol, consumption, smoking, diabetes, and heart disease (OR=1.16 (0.77, 1.74)). Replacing the average acceleration counts/min when active with minutes in moderate-vigorous activity did not alter the results (30).
TV watching is obviously just one of the more common reasons why people sit for long periods of time with inactive (non-contracting) muscles. But it is important to note that two recent studies concluded from self-reported total sitting time both in youth (13) and adults with type 2 diabetes (11), that more total sitting time across the lifespan appears to be associated with diabetes independent of BMI. It is also insightful to notice that these relationships with disease rates remained significant in some of the studies additionally modeling for BMI (14–16) but not in all situations (17,18). Thus, while it is certainly plausible that excess body fat may contribute in part to the reason why TV time or other sedentary behaviors are related to diabetes risk, these epidemiological data are also alluding to the need to consider additional and more distinct mechanisms beyond BMI and body fat. It is possible that this is in part because the physiological processes mediating the health effects of sedentary behavior operate primarily through more acute and transient metabolic processes (52–55; see Rapid and direct effects of time spent sitting versus performing low intensity physical activity). These metabolic processes are constantly reflecting altered states of contractile activity and are not on the same time scale wherein changes in body composition would occur. These effects include an immediate plasma glucose uptake during acute contractions of active skeletal muscle, improved insulin action and local factors in skeletal muscle linking lipid metabolism to metabolic control (see Direct effects of displacing skeletal muscle contractile activity with a large duration of sedentary time below for references and discussion).
The strength of associations between sedentary time with disease outcomes may improve as the methodologies for more precise measurement of sedentary time, and non-sedentary time (especially lower intensity physical activity) are developed. From our physiological perspective, it is surprising to us that sometimes the TV studies are criticized because people may sit down for long periods of time to watch TV after meals and often eat snacks or meals while watching TV (51). There certainly is a plausible rationale to hypothesize high amounts of sedentary time in conjunction with eating causes unhealthy postprandial responses. The “TV-watching-time” studies provide translational evidence needed to guide behavioral and physiological studies. We also encourage more contextual studies, especially when combined with a good understanding of skeletal muscle responses related to inactivity physiology. It could be helpful to put forward a guiding hypothesis that takes from Ansel Key’s classical hypothesis suggesting that atherosclerosis is caused by an endless succession of postprandial lipid disturbances (19). Thematically, it is helpful to consider inactivity physiology concepts to test the hypothesis that type 2 diabetes may be caused by an endless succession of acute episodes of sitting inactive, while continually evoking exaggerated hyperinsulinemic postprandial responses and tissue lipid disturbances caused by insufficient contractile activity.
Sedentary time and metabolic syndrome (Table 1)
Depending on the exact definition, approximately a quarter of the US adult population has metabolic syndrome. This typically includes abnormal plasma triglycerides and HDL as markers of impaired lipid metabolism, elevated plasma glucose, blood pressure, and waist circumference. Inflammation and thrombosis/hemostatic factors are also included in some of the studies about metabolic syndrome. Insulin resistance is thought to be an underlying culprit in much of this condition (20). A recent meta-analysis (Table 1) focused on sedentary behavior and identified 10 cross-sectional studies with a total of 21,393 participants. Sedentary time was self-reported in 9 of 10 studies (3). Comparing relatively low and high categories of sedentary time, the most sedentary categories had 73% greater odds for metabolic syndrome, even after some of these studies apparently adjusted for BMI and MVPA.
Studies using devices to objectively estimate sedentary time in people identified as either high risk for type 2 diabetes or recently diagnosed with disease (Table 2)
Table 2.
Objectively determined sedentary time and cardiometabolic risk in adults with type 2 diabetes or defined as high risk for disease.
| Reference | Sample | Design | Sedentary time measure | Cardiometabolic risk factors | Independent of MVPA? | Independent of BMI/waist? | Timing of sedentary measure & blood sample |
|---|---|---|---|---|---|---|---|
|
| |||||||
| Cooper (36) | T2D, N=528 | 6 mo. Prosp & X-Sec | AG GT1M | Insulin, HOMA-IR, HDL, WC | YES | YES | Not reported |
| RESULTS-Baseline SED time predicted insulin, HOMA-IR, HDL-C at 6 months. In cross-sectional analyses at baseline, higher SED time related to higher insulin, HOMA-IR, WC, and lower HDL. “Breaks” in SED time were not related to blood chemistry but inversely related to WC. | |||||||
|
| |||||||
| Cooper (37) | T2D, N=394 | X-Sec | HR+accel (Actiheart) | HbA1C, TG, HDL, SBP, WC, 1 CMR | YES | YES | Not reported |
| RESULTS-Direct relationship of SED time with 1CMR, waist, TG, HDL. | |||||||
|
| |||||||
| Winjdaele (39) | T2D offspring N=171 | 6 yr Prosp | AG 7164 & AG GT1M | Glucose, insulin, TG, HDL, WC, SBP, DBP | YES | YES | Not reported |
| RESULTS-Direct relationship between Δ in SED time and Δ in CMR and TG independent of baseline SED. | |||||||
|
| |||||||
| Henson (38) | T2D high risk, N=878 | X-Sec | AG GT3X | 2hr OGTT glucose, TG, HDL, BMI, WC | YES | YES | Not reported |
| RESULTS-Direct relationships for SED time with 2hr-glucose and TG. Inverse relationship with HDL-C. “Breaks” in SED time significantly related to BMI and WC. Total activity counts were related only to HDL-C after adjustment for SED time. | |||||||
|
| |||||||
| Henson (41) | T2D high risk, N=558 | X-Sec | AG GT3X | IL-6, CRP, leptin adiponectin | YES | YES | Not reported |
| RESULTS-Direct relationship with SED time and IL-6. “Breaks” in SED time were not independently related to any of the plasma endpoints. | |||||||
|
| |||||||
| Ekelund (40) | T2D high risk, N=258 | X-Sec | AG MT1 | Insulin, TG, HDL, 2 CMR, WC | N/A | YES | Not reported |
| RESULTS-Direct relationship of SED time with fasting insulin. Consistent with expectation that SED time is the inverse of total activity time, SED time was no longer significantly related to insulin when accounting for total activity cts. | |||||||
|
| |||||||
| Ekelund (50) | T2D high risk, N=192 | 1yr Prosp & X-Sec | AG MT1 | Insulin, HOMA-IR, WC | N/A | N/A | Not reported |
| RESULTS-SED time at baseline was not significantly related to insulin at 1 year follow up nor at baseline in cross-sectional analyses. | |||||||
SED-sedentary, Prosp.-prospective analysis, X-Sec Cross-sectional analysis, TG-triglycerides, WC-waist circumference, SBP-systolic blood pressure, DBP-diastolic blood pressure,
CMR-clustered metabolic risk (HbA1C, TG, inverse of HDL, WC, SBP),
CMR-clustered metabolic risk (fasting glucose & insulin, TG, inverse of HDL, SBP, DBP, WC), AG-actigraph, N/A-not available.
Two studies of which we are aware have focused on people newly diagnosed with type 2 diabetes. In a cross-sectional and prospective study of 528 people, sedentary time, as estimated from hip mounted accelerometry, was unfavorably related to fasting insulin, HOMA-IR, and HDL-C, both at baseline and after 6 months follow up (36). A similar cross-sectional analysis using a heart rate method (35) reported that sedentary time was unfavorably related to plasma TG and HDL concentrations, waist circumference, and a clustered metabolic risk score (HbA1C, TG, inverse of HDL, waist).
A number of other reports have shown that sedentary time is a behavioral risk factor for the severity of cardiometabolic risk in people at high risk for type 2 diabetes (e.g. adult offspring with a diagnosed parent). This includes elevated 2 hr glucose (38), TG (38,39), fasting insulin (40), IL-6 (41), clustered metabolic risk score (39), and lower HDL-C (38). Much like we described above for risk of type 2 diabetes and metabolic syndrome, the risk of too much sedentary time was independent of both the amount of accumulative MVPA and body composition indices (BMI, waist). For example, this was evident in the relationships between sedentary time and fasting insulin, 2 hr glucose, HOMA-IR, HDL, TG, and clustered metabolic risk score in people with type 2 diabetes (36,37) or at high risk for type 2 diabetes (38–41).
Insulin resistance relative to objectively determined sedentary time and total activity
Skeletal muscle insulin resistance is a key element in the development and progression of type 2 diabetes. A study of 801 apparently healthy participants, in which sedentary time was measured using accelerometry showed that sedentary time was inversely associated with insulin sensitivity, measured using a hyperinsulinemic-euglycemic clamp (43). There was about 4 hr difference between the groups with the most and the least sedentary time and ~40% range in insulin-stimulated glucose uptake (43). This relationship was independent of the amount of MVPA (43), as suggested previously for surrogate markers of insulin sensitivity (49). Consistent with the logical proposition that sedentary time is a risk because of not enough total activity, the relative balance between total inactivity (sedentary time) and total cumulative daily activity was key for insulin sensitivity. Sedentary time in this cohort was also directly associated with an insulin secretion index derived from an OGTT even after adjustment for clamp determined insulin sensitivity, and also with higher TG, and lower HDL-C independent of sustained MVPA but instead related to total daily activity (44).
The pattern or “breaks” in sedentary time
We are unaware of any reports that related breaks in sedentary time with rates of type 2 diabetes. However, there is an inverse relationship between breaks in sedentary time with waist circumference (36,38,45,46) and BMI (45). From existing evidence using accelerometry cut point methodologies to define transitions from sedentary to non-sedentary behavior, there is currently stronger support for total sedentary time than for the pattern of how sedentary time is accumulated in relation to disease risk. In the limited number of studies specifically examining both total sedentary time and breaks (adjusted for total sedentary time) in adults, total sedentary time was significantly related to metabolic syndrome (30), insulin (36,46), HOMA-IR (36,46), 2 hr glucose (38,47), TG concentration (38,45,46), HDL (36,38,46), CRP (46), and IL-6 (41). In these studies, breaks were related to 2 hr glucose (45), TG (45), CRP (46), and metabolic syndrome (30). After adjustment for waist circumference or BMI, the 2 hr glucose and TG relationships with sedentary breaks were no longer significant (30,45). However, the risk factors noted above remained significant for total sedentary time even when further adjusted for waist or BMI (36,38,41,47). Future studies will benefit as methodologies for postural detection improve using inclinometry (48). While the findings from Healy and colleagues (45) are plausible and support the possibility that “frequent muscular contraction throughout the day may be necessary to short-circuit unhealthy molecular signals causing metabolic disease” (5), the available evidence at present most strongly supports the central importance of paying attention to the large total duration of sedentary time in mediating risk for type 2 diabetes.
Rapid and direct effects of time spent sitting versus performing low intensity physical activity
Saunders et al. (8) provided a systematic review of the various types of human studies of either acute or short-term (1 week) responses to experimental models involving sedentary behaviors. They concluded that overall there were moderate to large unfavorable effects of high amounts of sedentary time on plasma triglyceride, glucose tolerance, and insulin sensitivity. However, their review highlights the need for studies to focus more specifically on sitting time. Bedrest studies have offered interesting insights but require cautious interpretation. Further, it is obviously no longer plausible to suggest that detraining effects after exercise offers any clear insight about sedentary time or low intensity activity. Unfortunately, we still notice confusion caused by incorrectly drawing conclusions about sitting or sedentary time when the methods did not isolate the effects of sedentary time per se, but intermingle it with detraining from recreational sports and bicycle commuting.
Studies comparing a single day of sitting to controlled amounts of low intensity activity are only starting to emerge and are insightful because the time is short enough to identify some of the more potent responses that are obviously independent of changes in body composition (52–55). Stephens et al. (53) observed a 39% reduction in insulin stimulated glucose uptake (tracer determined plasma glucose uptake per unit insulin) after a day of sitting compared to a trial with LIPA when energy intake was held constant by controlled feedings. The non-sedentary condition in that study involved a large duration of intermittent and low intensity physical activity to counterbalance sitting time throughout ~66% of the waking day. The activities were diverse and designed to mimic many of the typical activities of daily living, such as dishwashing, folding clothes, and putting away groceries with an estimated energy expenditure of ~44 kcal/hr greater in the active trial than the sedentary control trial, which was kept within a range between 1.1–2.7 METs. The relative intensity was particularly light for these young participants, with the estimated average energy expenditure at significantly less than ~20% of measured VO2 max. Thus, one contribution from that study was that although the intensity was below the range described as “health promoting” in the federal physical activity guidelines, insulin action was nevertheless significantly impacted. And somewhat to our surprise, this rather large 39% effect on insulin action was evident even though it was assessed the next morning after a night of rest and before getting out of bed. The second of these acute studies was performed in overweight/obese middle age adults (53). The acute and intermittent walking was performed at two intensities during the postprandial period so that the immediate effects on postprandial glucose and insulin could be assessed. Most importantly, there were ~20% differences for both the glucose and insulin responses in the sedentary vs. active condition, but the 2 active trials were similar. An insightful novel finding of that study was that despite a two-fold difference in walking speeds (2.0 mph versus 3.6–4.0 mph), the glucose and insulin responses throughout the postprandial period were essentially identical. These findings suggest that the benefit of this range of intermittent activity on glucose and insulin was independent of intensity. It remains to be seen if an even lower intensity activity that could be sustained for longer and integrated into a large part of the day to displace more sedentary time would be even more potent. As stated previously, a goal of the inactivity physiology field is to recommend safe, sustainable, and science-based behaviors to the public. Behaviors at the lower intensities, if proven effective, hold great promise because if the perceived exertion is low enough, it might provide a more achievable solution for the large percentage of the population that is currently unfit, obese, aging, and too sedentary, yet desperately needs to be active.
A major advantage of acute experimental studies vs. free living is that the non-sedentary behaviors people do in free-living conditions are highly variable, throughout the day in a multitude of patterns, and thus dose-response parameters can be extremely difficult to accurately describe. There is still a large margin of error from accelerometry methods in the low intensity range. The treadmill walking study described above highlights the need for more studies to focus on even lighter activity (53). None of the participants had any known existing disease conditions precluding MVPA, but some of them had enough trouble walking at ~4 mph in bouts lasting only 2 min each. And regardless of fitness, it would not be practical for many people to alter the workplace or other domains to replace many hours of sedentary time with moderate or vigorous activity at their workplace. Even in people who can exercise for an hour per day, Duvivier et al (54) reported that replacing sedentary time with a large amount of non-exercise physical activity was more effective than exercise in reducing plasma triglyceride, non-HDL cholesterol, postprandial insulin. In that intervention, the conclusion was the duration was more important than intensity because the caloric expenditure of exercise versus non-exercise activity was matched (54).
Solutions to the problem of sedentary time will soon become more apparent as more intervention studies work toward the goal of successfully reducing sedentary time to amounts consistent with meaningful disease prevention (i.e., ~20–30% reduction in total sedentary time, or >2–3 hrs/day). Because the proportion of the population that is most in need for sedentary behavior interventions has the greatest health concerns, it would be unrealistic and of little public health significance for research that does not pay close attention to non-fatiguing and very safe types of physical activity in the lower end of the physical activity continuum. Given these issues, one of the most high impact questions that is still almost totally unresolved is what behaviors will be most effective and practical.
There is a need for those seeking to understand whether or not sedentary behavior is an actual cause of diseases to be cautious when using datasets that were not designed with sedentary behavior per se in mind. Unanticipated confounding factors (that sometimes are not even assessed) can potentially have a large influence on the results coming from studies that mix together effects of sedentary time with other influences such as the maladaptations from detraining (stopping exercise). As a final cautionary note that hopefully can enhance future efforts in long term clinical trials, and maybe even in epidemiological studies, it is important to note that most if not all studies assessing sedentary time with objective measures do not report when the sedentary time assessment is performed in relation to the blood sampling for cardiometabolic risk factors (see last column of Table 2). For example, because TG (54), non-HDL cholesterol (54), and insulin sensitivity (53) can be robustly altered by just the amount of sedentary time in the immediate previous day(s), it would be important to sample blood at the end of a week of measuring sedentary time.
Direct and potent effects of acute contractile activity on glucose uptake
Understanding the acute influences of skeletal muscle responses is required for understanding how sedentary time impacts glucose metabolism during hyperinsulinemia. First, independent of insulin signaling, acute contractile activity induces local signals stimulating glucose uptake. Furthermore, two fascinating studies by Wasserman’s (56) and DeFronso’s (57) groups concluded that acute contractile activity provides not just an additive effect with insulin, but synergistic effects on plasma glucose disposal/utilization when combined with hyperinsulinemia. This was demonstrated with physiological doses of insulin during a euglycemic-hyperinsulinemic clamp. Based on arteriovenous measurements (57), there was a very large influence of contractile activity on glucose uptake into the working legs. While the exact proteins responsible require further study, the glucose abnormalities present in people who either have pre-diabetes or diabetes may be influenced by acute contractile activity. These studies (56,57) were performed at moderate intensity of 40–45% aerobic capacity. More work is needed at the lowest end of the physical activity continuum where most of the non-exercise physical activity occurs.
Molecular mechanisms potentially explaining why sitting too much is not the same as exercising too little
A remarkably fundamental concept that is useful for guiding inactivity physiology is simply that muscle cells are constantly sensing and responding to their environment, thus contractile activity and inactivity over the whole day counts. With regards to sedentary time, this means that muscle tissue is potentially responsive to the balance of total time spent either without contractile activity (sedentary) or in contractile activity, not just in the hour during formal exercise. And furthermore, as with any acute metabolic response, the most robust of these daily effects are probably relatively short-lived. Figure 1 illustrates results for 3 processes. Global gene profiling indicates diversity and potency of the responses potentially important for prevention of type 2 diabetes and related metabolic risks, including genes previously shown to modulate glucose metabolism (e.g., GLUT1, OGTase P110, SNAP-23, and Rad) and frequently associated processes such as inflammation and thrombosis (e.g. LPP1). One study identified over 100 genes with significantly altered expression during the transitions between periods of acute inactivity and activity (58). Notice that inactivity actually stimulated the rise in the expression of just as many genes as it did repress gene expression, invoking molecular processes turned on in response to sedentary behavior. And also of particular interest, there was a large cluster of genes that had a significant increase in expression during a period of prolonged inactivity for 12 hours, yet unexpectedly did not reverse back to normal within several hours after regaining contractile activity (Fig 1B). These findings have led to a better understanding of the regulation of several known and several novel candidates mediating causal mechanisms. For example, LPP1 is involved in inactivating a subfamily of lysophospholipids known to cause impaired glucose tolerance in obese mice (68). Follow-up studies (Fig 1D; 61) confirmed these responses and extended the findings to reveal that LPP1 is rapidly reduced in both rats and humans when skeletal muscle is inactive; yet this gene was apparently unresponsive to an hour per day of intense exercise.
Figure 1.

Rapid responses in skeletal muscle during altered contractile activity. A) Expression of genes suppressed by 12 hours of inactivity but restoration with 4 hours of exclusively very low-intensity physical activity (intermittent walking at 0.3 mph and standing). B) Expression of genes that are resistant to quickly being restored after prolonged inactivity (12 hours). There was also a smaller cluster of genes whose elevated gene expression during 12 hours of inactivity did return to active control levels after 4 hours of low-intensity physical activity (data not shown). A and B are adapted from reference 58. C) Suppression of muscle LPL activity by 12 hours of inactivity and complete restoration by 4 hours of low-intensity physical activity. Adapted from reference 59. D) Lipid phosphate phosphatase-1 (LPP1) gene expression in response to prolonged sitting and exercise in human skeletal muscle. Exercise did not impact LPP1 expression while the removal of daily standing/ambulation suppresses its expression thus providing evidence that the expression of some genes may be more responsive to the balance between muscle inactivity and high duration low intensity physical activity than more intense exercise. Adapted from reference 60.
Metabolism in slow-twitch oxidative skeletal muscle is the key for metabolic responses during low intensity physical activity
Animal studies have been particularly insightful for understanding the role of local contractile activity and muscle type on glucose and lipid metabolism. In conscious and unrestrained rats performing only light non-exercising activities, James et al (62) found that insulin-induced increases in total peripheral glucose disposal occurred predominantly in muscles containing a high proportion of slow oxidative fibers. The 3–6 fold difference between muscle types was associated with a 65% greater hexokinase activity in the red oxidative muscles compared to the more white glycolytic muscles.
Figure 2 illustrates one of the critical principles for understanding how muscle is recruited during lower vs. more vigorous types of physical activity. Skeletal muscle is a highly heterogeneous tissue and both the threshold for recruitment and the metabolic responses to contractile activity are very much dependent upon fiber type. A fundamental point is that slow oxidative muscle can be heavily engaged during low intensity efforts, while at the same time the fast glycolytic type of muscle may remain inactive. The dynamic rise and fall in the energy demands of contracting and inactive states is greater in skeletal muscle than any other cell type (7). Because of the well-appreciated concept of orderly recruitment of motor units, activation of muscle fibers generally follows an almost all-or-none/on-off type of dichotomy at the single fiber level (see Fig 4.2 in reference 7). Because of this, the energy demands of working fibers typically increase 50–100-fold greater in the working muscle mass, while other parts of the musculature can remain at resting levels (7). Thus, it is likely that some of the most oxidative and fatigue resistant muscle can play a dominant role in the energetics and fuel utilization during many hours per day of light activity, while the vast majority of the body’s muscle mass may remain relatively inactive.
Figure 2.

Activation of skeletal muscle recruitment over the physical activity continuum is fiber type dependent. Activity at the lower end of the physical activity continuum primarily activates slow oxidative muscle fibers that are fatigue resistant and rich in enzymes and other proteins favoring high rates of metabolism of glucose and lipids. In contrast, fast glycolytic muscle fibers are rarely recruited during low intensity physical activity. Both types of muscle are activated at maximal intensity, yet for only brief duration before extreme fatigue. There is an exponential risk of injury and fatigue as intensity is increased. Adapted from reference 7.
Related to these findings above, studies have also found that the slow oxidative soleus muscle of rats had a significantly greater plasma triglyceride uptake during contractile activity than other muscles (63). This could be explained by a significantly greater lipoprotein lipase (LPL) activity in the slow oxidative muscle possessing a relatively low threshold for activation (59,64; Fig 3). During periods of acute contractile inactivity (59,60,64) and during reduced spontaneous ambulatory activity associated with aging (65,66), LPL activity decreases significantly, but primarily in the slow oxidative muscles where its actions are normally most important (Fig 3). Given the central role of LPL on plasma triglyceride hydrolysis and multiple other changes in lipid metabolism, disturbances in skeletal muscle LPL have frequently been implicated in multiple metabolic risk factors. For one, there is evidence that low levels of LPL expression is a cause for lower than normal mitochondrial content in skeletal muscle of insulin resistant offspring whose parents have type 2 diabetes (67). LPL deficiencies also have been linked to lipoprotein parameters, inflammatory processes, and blood pressure. For example, strong evidence indicates that insulin resistance, pre-diabetes, and type 2 diabetes are frequently associated with alterations in the specific lipoprotein particle subclasses evident from advanced testing methodologies in addition to elevated plasma triglycerides and low HDL-C, and (69–72). Taken together, these insights may explain at least some of the links between sedentary behavior, local processes impinging upon the need for slow oxidative fibers to contract at a high duration for many hours each day, and the regulation of metabolic risk factors present in people at risk for type 2 diabetes.
Figure 3.
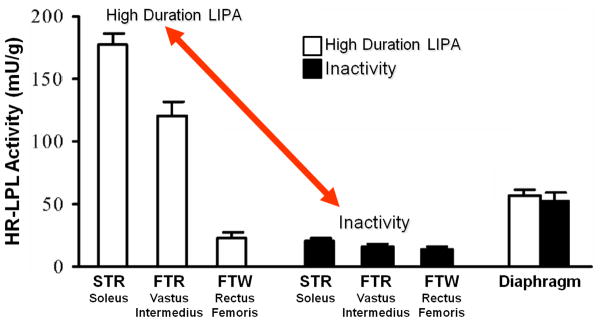
LPL activity in different muscle fiber types after 12 hours of inactivity compared with low-intensity activity. LPL activity was assessed in the slow twitch red (STR) soleus muscle, the fast twitch red (FTR) vastus intermedius, the fast twitch white (FTW) rectus femoris, and the diaphragm (which is a mixed skeletal muscle with continual activity and served as a control for systemic responses). Figure adapted from reference (59).
CONCLUSION
In conclusion, sitting at work and in leisure is ubiquitous in modern society. In fact, recent studies using inclinometers to quantify all of the non-sitting and total sedentary time (12) indicate that most people sit more than half of every day, or between 50% (1st quartile) to 75% (4th quartile) of the waking day (Fig 4A). Both experimental and epidemiological studies have recently been providing evidence that there may be unhealthy effects of large amounts of sedentary time (and inversely, small amounts of total non-exercise physical activity time, Fig 4A). Type 2 diabetes and metabolic syndrome risks are independent of the type of well-established MVPA recommended in the existing guidelines. This raises important implications about why sedentary behavior is implicated in disease, and also which type of interventions should be evaluated in providing the optimal solution, especially for people who cannot (or behaviorally will not) exercise much at higher intensities. Put simplistically (4–7), the effect of “too much sitting” (actually, contractile inactivity) is not the same as too little exercise (i.e., the narrowly defined type of activity recommended by the current guidelines). Figure 4B also illustrates that even in the individuals who exercised at twice the 150 min/week level in the recommendations, sitting time and the total daily non-exercise activity was not different from those who almost never exercised. Currently there is a pressing need to better understand the physiology and health outcomes specifically derived from replacing sedentary time with non-fatiguing types of light activity potentially achievable in more types of people, and thereby provide high impact at the population level. Activity at the lower end of the intensity continuum can potentially replace dozens of hours of sedentary time each week as illustrated in Figure 4. The best widespread public health solutions require physiologically effective changes mediated by behaviors that demand the lowest perceived exertion possible, frequently throughout the entire day, and habitually each day. Notice also that the existing evidence has consistently indicated that the most meaningful relationships were associated with large amounts of time, when comparing individuals with the most and least sedentary time. Quantitatively, we found there was a difference of ~29 hrs/week between the most and least sedentary quartiles (Figure 4A). Successfully replacing sedentary time by meaningful amounts requires increasing the total cumulative duration of physical activity by as much as possible throughout the whole day. As we have reviewed in this article and elsewhere (45,6,59), studies have concluded that there are potent molecular effects of maintaining a high daily duration of non-fatiguing contractile activity (59). Molecular processes governing plasma glucose utilization and other risk factors can show potent responses in slow oxidative skeletal muscles. Such data looks to be especially significant for mediating risk factors independent of weight changes. Taken together, when the goal is reducing sedentary time, there is much promise for new public health approaches taking aim at prevention of prediabetes and type 2 diabetes in the large segment of the population that has been resistant to exercise recommendations, are overweight/obese, and the elderly.
Figure 4.

Time spent in sedentary and non-sedentary activities. A) Quartiles of daily sedentary (sitting) time assessed with activPal inclinometer in addition to non-exercise behaviors (standing and incidental stepping). There was a 29 hour/week difference in the average sedentary time and total time in all physical activity between the average of the 1st and 4th quartiles of 92 women 40–75 yrs (Zderic, unpublished observations). Thus from a public health standpoint, there is potential for large reductions in type 2 diabetes by targeting safe and feasible strategies to move the most sedentary people into the range of the least sedentary (i.e. most time of total non-sedentary activity). Sedentary behavioral differences on par with this large magnitude of time have revealed strong associations with type 2 diabetes (and metabolic syndrome) risk (see Table 1), as well as the underlying clinical biomarkers precipitating disease (e.g. hyperinsulinemia and plasma triglycerides) in persons at high risk for diabetes or already diagnosed with disease. B) Comparison of the amount of total daily sitting, standing, and stepping in 3 groups of women with large differences in the amount of time spent exercising. Notice that exercisers were not less sedentary over the whole day, even for individuals exercising up to a duration of ~300 min/week. Values are expressed as means with SEM bars. Figure 4B adapted from reference (12).
Acknowledgments
Work described by the authors was supported by the following grants: NIH HL57367, HL52490, HL70482, and NSBRI 00119611.
References
- 1.Colberg SR, Sigal RJ, Fernhall B, Regensteiner JG, Blissmer BJ, Rubin RR, Chasan-Taber L, Albright AL, Braun B American College of Sports Medicine; American Diabetes Association. Exercise and type 2 diabetes: the American College of Sports Medicine and the American Diabetes Association: joint position statement. Diabetes Care. 2010;33(12):e147–67. doi: 10.2337/dc10-9990. [DOI] [PMC free article] [PubMed] [Google Scholar]
- 2.2008 Physical Activity Guidelines for Americans. US Department of Health and Human Services; 2008. www.health.gov/paguidelines/ [Google Scholar]
- 3.Edwardson CL, Gorely T, Davies MJ, Gray LJ, Khunti K, Wilmot EG, Yates T, Biddle SJ. Association of sedentary behaviour with metabolic syndrome: a meta-analysis. PLoS One. 2012;7(4) doi: 10.1371/journal.pone.0034916. [DOI] [PMC free article] [PubMed] [Google Scholar]
- 4.Hamilton MT, Hamilton DG, Zderic TW. Exercise physiology versus inactivity physiology: an essential concept for understanding lipoprotein lipase regulation. Exerc Sport Sci Rev. 2004;32(4):161–6. doi: 10.1097/00003677-200410000-00007. [DOI] [PMC free article] [PubMed] [Google Scholar]
- 5.Hamilton MT, Hamilton DG, Zderic TW. Role of low energy expenditure and sitting in obesity, metabolic syndrome, type 2 diabetes, and cardiovascular disease. Diabetes. 2007;56(11):2655–67. doi: 10.2337/db07-0882. [DOI] [PubMed] [Google Scholar]
- 6.Hamilton MT, Healy GN, Dunstan DW, Zderic TW, Owen N. Too little exercise and too much sitting: inactivity physiology and the need for new recommendations on sedentary behavior. Current Cardiovascular Risk Reports. 2008;2:292–298. doi: 10.1007/s12170-008-0054-8. [DOI] [PMC free article] [PubMed] [Google Scholar]
- 7.Hamilton MT, Owen N. Sedentary Behavior and Inactivity Physiology. In: Bouchard C, Blair SN, Haskell WL, editors. Physical Activity and Health. 2. 2011. pp. 53–68. Human Kinetics. [Google Scholar]
- 8.Saunders TJ, Larouche R, Colley RC, Tremblay MS. Acute sedentary behaviour and markers of cardiometabolic risk: a systematic review of intervention studies. J Nutr Metab. 2012;2012:712435. doi: 10.1155/2012/712435. [DOI] [PMC free article] [PubMed] [Google Scholar]
- 9.Thorp AA, Owen N, Neuhaus M, Dunstan DW. Sedentary behaviors and subsequent health outcomes in adults: a systematic review of longitudinal studies. 1996–2011. Am J Prev Med. 2011;41(2):207–15. doi: 10.1016/j.amepre.2011.05.004. [DOI] [PubMed] [Google Scholar]
- 10.Wilmot EG, Edwardson CL, Achana FA, Davies MJ, Gorely T, Gray LJ, Khunti K, Yates T, Biddle SJ. Sedentary time in adults and the association with diabetes, cardiovascular disease and death: systematic review and meta-analysis. Diabetologia. 2012;55(11):2895–905. doi: 10.1007/s00125-012-2677-z. [DOI] [PubMed] [Google Scholar]
- 11.George ES, Rosenkranz RR, Kolt GS. Chronic disease and sitting time in middle-aged Australian males: findings from the 45 and Up Study. Int J Behav Nutr Phys Act. 2013 Feb 8;10:20. doi: 10.1186/1479-5868-10-20. [DOI] [PMC free article] [PubMed] [Google Scholar]
- 12.Craft LL, Zderic TW, Gapstur SM, Vaniterson EH, Thomas DM, Siddique J, Hamilton MT. Evidence that women meeting physical activity guidelines do not sit less: an observational inclinometry study. Int J Behav Nutr Phys Act. 2012 Oct 4;9:122. doi: 10.1186/1479-5868-9-122. [DOI] [PMC free article] [PubMed] [Google Scholar]
- 13.Kriska A, Delahanty L, Edelstein S, Amodei N, Chadwick J, Copeland K, Galvin B, El ghormli L, Haymond M, Kelsey M, Lassiter C, Mayer-Davis E, Milaszewski K, Syme A. Sedentary behavior and physical activity in youth with recent onset of type 2 diabetes. Pediatrics. 2013;131(3):e850–6. doi: 10.1542/peds.2012-0620. [DOI] [PMC free article] [PubMed] [Google Scholar]
- 14.Hu FB, Leitzmann MF, Stampfer MJ, Colditz GA, Willett WC, Rimm EB. Physical activity and television watching in relation to risk for type 2 diabetes mellitus in men. Arch Intern Med. 2001;161(12):1542–8. doi: 10.1001/archinte.161.12.1542. [DOI] [PubMed] [Google Scholar]
- 15.Krishnan S, Rosenberg L, Palmer JR. Physical activity and television watching in relation to risk of type 2 diabetes: the Black Women’s Health Study. Am J Epidemiol. 2009;169(4):428–34. doi: 10.1093/aje/kwn344. [DOI] [PMC free article] [PubMed] [Google Scholar]
- 16.Tonstad S, Butler T, Yan R, Fraser GE. Type of vegetarian diet, body weight, and prevalence of type 2 diabetes. Diabetes Care. 2009;32(5):791–6. doi: 10.2337/dc08-1886. [DOI] [PMC free article] [PubMed] [Google Scholar]
- 17.Ford ES, Schulze MB, Kröger J, Pischon T, Bergmann MM, Boeing H. Television watching and incident diabetes: Findings from the European Prospective Investigation into Cancer and Nutrition-Potsdam Study. J Diabetes. 2010;2(1):23–7. doi: 10.1111/j.1753-0407.2009.00047.x. [DOI] [PubMed] [Google Scholar]
- 18.Dunstan DW, Salmon J, Owen N, Armstrong T, Zimmet PZ, Welborn TA, Cameron AJ, Dwyer T, Jolley D, Shaw JE AusDiab Steering Committee. Physical activity and television viewing in relation to risk of undiagnosed abnormal glucose metabolism in adults. Diabetes Care. 2004;27(11):2603–9. doi: 10.2337/diacare.27.11.2603. [DOI] [PubMed] [Google Scholar]
- 19.Keys A. Coronary heart disease--the global picture. Atherosclerosis. 1975;22(2):149–92. doi: 10.1016/0021-9150(75)90001-5. [DOI] [PubMed] [Google Scholar]
- 20.Jornayvaz FR, Samuel VT, Shulman GI. The role of muscle insulin resistance in the pathogenesis of atherogenic dyslipidemia and nonalcoholic fatty liver disease associated with the metabolic syndrome. Annu Rev Nutr. 2010;30:273–90. doi: 10.1146/annurev.nutr.012809.104726. [DOI] [PMC free article] [PubMed] [Google Scholar]
- 21.Bertrais S, Beyeme-Ondoua JP, Czernichow S, Galan P, Hercberg S, Oppert JM. Sedentary behaviors, physical activity, and metabolic syndrome in middle-aged French subjects. Obes Res. 2005;13(5):936–44. doi: 10.1038/oby.2005.108. [DOI] [PubMed] [Google Scholar]
- 22.Dunstan DW, Salmon J, Owen N, Armstrong T, Zimmet PZ, Welborn TA, Cameron AJ, Dwyer T, Jolley D, Shaw JE AusDiab Steering Committee. Associations of TV viewing and physical activity with the metabolic syndrome in Australian adults. Diabetologia. 2005;48(11):2254–61. doi: 10.1007/s00125-005-1963-4. [DOI] [PubMed] [Google Scholar]
- 23.Ford ES, Kohl HW, 3rd, Mokdad AH, Ajani UA. Sedentary behavior, physical activity, and the metabolic syndrome among U.S. adults. Obes Res. 2005;13(3):608–14. doi: 10.1038/oby.2005.65. [DOI] [PubMed] [Google Scholar]
- 24.Gao X, Nelson ME, Tucker KL. Television viewing is associated with prevalence of metabolic syndrome in Hispanic elders. Diabetes Care. 2007;30(3):694–700. doi: 10.2337/dc06-1835. [DOI] [PubMed] [Google Scholar]
- 25.Li CL, Lin JD, Lee SJ, Tseng RF. Associations between the metabolic syndrome and its components, watching television and physical activity. Public Health. 2007;121(2):83–91. doi: 10.1016/j.puhe.2006.08.004. [DOI] [PubMed] [Google Scholar]
- 26.Chang PC, Li TC, Wu MT, Liu CS, Li CI, Chen CC, Lin WY, Yang SY, Lin CC. Association between television viewing and the risk of metabolic syndrome in a community-based population. BMC Public Health. 2008 Jun 3;8:193. doi: 10.1186/1471-2458-8-193. [DOI] [PMC free article] [PubMed] [Google Scholar]
- 27.Chen X, Pang Z, Li K. Dietary fat, sedentary behaviors and the prevalence of the metabolic syndrome among Qingdao adults. Nutr Metab Cardiovasc Dis. 2009;19(1):27–34. doi: 10.1016/j.numecd.2008.01.010. [DOI] [PubMed] [Google Scholar]
- 28.Sisson SB, Camhi SM, Church TS, Martin CK, Tudor-Locke C, Bouchard C, Earnest CP, Smith SR, Newton RL, Jr, Rankinen T, Katzmarzyk PT. Leisure time sedentary behavior, occupational/domestic physical activity, and metabolic syndrome in U.S. men and women. Metab Syndr Relat Disord. 2009;7(6):529–36. doi: 10.1089/met.2009.0023. [DOI] [PMC free article] [PubMed] [Google Scholar]
- 29.Trinh OT, Nguyen ND, Phongsavon P, Dibley MJ, Bauman AE. Metabolic risk profiles and associated risk factors among Vietnamese adults in Ho Chi Minh City. Metab Syndr Relat Disord. 2010;8(1):69–78. doi: 10.1089/met.2009.0018. [DOI] [PubMed] [Google Scholar]
- 30.Bankoski A, Harris TB, McClain JJ, Brychta RJ, Caserotti P, Chen KY, Berrigan D, Troiano RP, Koster A. Sedentary activity associated with metabolic syndrome independent of physical activity. Diabetes Care. 2011;34(2):497–503. doi: 10.2337/dc10-0987. [DOI] [PMC free article] [PubMed] [Google Scholar]
- 31.Hu FB, Li TY, Colditz GA, Willett WC, Manson JE. Television watching and other sedentary behaviors in relation to risk of obesity and type 2 diabetes mellitus in women. JAMA. 2003;289(14):1785–91. doi: 10.1001/jama.289.14.1785. [DOI] [PubMed] [Google Scholar]
- 32.Stamatakis E, Hamer M, Dunstan DW. Screen-based entertainment time, all-cause mortality, and cardiovascular events: population-based study with ongoing mortality and hospital events follow-up. J Am Coll Cardiol. 2011;57(3):292–9. doi: 10.1016/j.jacc.2010.05.065. [DOI] [PubMed] [Google Scholar]
- 33.Wijndaele K, Brage S, Besson H, Khaw KT, Sharp SJ, Luben R, Bhaniani A, Wareham NJ, Ekelund U. Television viewing and incident cardiovascular disease: prospective associations and mediation analysis in the EPIC Norfolk Study. PLoS One. 2011;6(5):e20058. doi: 10.1371/journal.pone.0020058. [DOI] [PMC free article] [PubMed] [Google Scholar]
- 34.Hawkes AL, Lynch BM, Owen N, Aitken JF. Lifestyle factors associated concurrently and prospectively with co-morbid cardiovascular disease in a population-based cohort of colorectal cancer survivors. Eur J Cancer. 2011;47(2):267–76. doi: 10.1016/j.ejca.2010.10.002. [DOI] [PubMed] [Google Scholar]
- 35.Matthews CE, George SM, Moore SC, Bowles HR, Blair A, Park Y, Troiano RP, Hollenbeck A, Schatzkin A. Amount of time spent in sedentary behaviors and cause-specific mortality in US adults. Am J Clin Nutr. 2012;95(2):437–45. doi: 10.3945/ajcn.111.019620. [DOI] [PMC free article] [PubMed] [Google Scholar]
- 36.Cooper AR, Sebire S, Montgomery AA, Peters TJ, Sharp DJ, Jackson N, Fitzsimons K, Dayan CM, Andrews RC. Sedentary time, breaks in sedentary time and metabolic variables in people with newly diagnosed type 2 diabetes. Diabetologia. 2012;55(3):589–99. doi: 10.1007/s00125-011-2408-x. [DOI] [PubMed] [Google Scholar]
- 37.Cooper AJ, Brage S, Ekelund U, Wareham NJ, Griffin SJ, Simmons RK. Association between objectively assessed sedentary time and physical activity with metabolic risk factors among people with recently diagnosed type 2 diabetes. Diabetologia. 2014;57(1):73–82. doi: 10.1007/s00125-013-3069-8. [DOI] [PMC free article] [PubMed] [Google Scholar]
- 38.Henson J, Yates T, Biddle SJ, Edwardson CL, Khunti K, Wilmot EG, Gray LJ, Gorely T, Nimmo MA, Davies MJ. Associations of objectively measured sedentary behaviour and physical activity with markers of cardiometabolic health. Diabetologia. 2013;56(5):1012–20. doi: 10.1007/s00125-013-2845-9. [DOI] [PubMed] [Google Scholar]
- 39.Wijndaele K, Orrow G, Ekelund U, Sharp SJ, Brage S, Griffin SJ, Simmons RK. Increasing objectively measured sedentary time increases clustered cardiometabolic risk: a 6 year analysis of the ProActive study. Diabetologia. 2014;57(2):305–12. doi: 10.1007/s00125-013-3102-y. [DOI] [PMC free article] [PubMed] [Google Scholar]
- 40.Ekelund U, Griffin SJ, Wareham NJ. Physical activity and metabolic risk in individuals with a family history of type 2 diabetes. Diabetes Care. 2007;30(2):337–42. doi: 10.2337/dc06-1883. [DOI] [PubMed] [Google Scholar]
- 41.Henson J, Yates T, Edwardson CL, Khunti K, Talbot D, Gray LJ, Leigh TM, Carter P, Davies MJ. Sedentary time and markers of chronic low-grade inflammation in a high risk population. PLoS One. 2013;8(10):e78350. doi: 10.1371/journal.pone.0078350. [DOI] [PMC free article] [PubMed] [Google Scholar]
- 42.Spittaels H, Van Cauwenberghe E, Verbestel V, De Meester F, Van Dyck D, Verloigne M, Haerens L, Deforche B, Cardon G, De Bourdeaudhuij I. Objectively measured sedentary time and physical activity time across the lifespan: a cross-sectional study in four age groups. Int J Behav Nutr Phys Act. 2012 Dec 18;9:149. doi: 10.1186/1479-5868-9-149. [DOI] [PMC free article] [PubMed] [Google Scholar]
- 43.Balkau B, Mhamdi L, Oppert JM, Nolan J, Golay A, Porcellati F, Laakso M, Ferrannini E EGIR-RISC Study Group. Physical activity and insulin sensitivity: the RISC study. Diabetes. 2008;57(10):2613–8. doi: 10.2337/db07-1605. [DOI] [PMC free article] [PubMed] [Google Scholar]
- 44.Lahjibi E, Heude B, Dekker JM, Højlund K, Laville M, Nolan J, Oppert JM, Balkau B RISC Study Group. Impact of objectively measured sedentary behaviour on changes in insulin resistance and secretion over 3 years in the RISC study: interaction with weight gain. Diabetes Metab. 2013;39(3):217–25. doi: 10.1016/j.diabet.2012.12.006. [DOI] [PubMed] [Google Scholar]
- 45.Healy GN, Dunstan DW, Salmon J, Cerin E, Shaw JE, Zimmet PZ, Owen N. Breaks in sedentary time: beneficial associations with metabolic risk. Diabetes Care. 2008;31(4):661–6. doi: 10.2337/dc07-2046. [DOI] [PubMed] [Google Scholar]
- 46.Healy GN, Matthews CE, Dunstan DW, Winkler EA, Owen N. Sedentary time and cardio-metabolic biomarkers in US adults: NHANES 2003–06. Eur Heart J. 2011;32(5):590–7. doi: 10.1093/eurheartj/ehq451. [DOI] [PMC free article] [PubMed] [Google Scholar]
- 47.Healy GN, Dunstan DW, Salmon J, Cerin E, Shaw JE, Zimmet PZ, Owen N. Objectively measured light-intensity physical activity is independently associated with 2-hr plasma glucose. Diabetes Care. 2007;30(6):1384–9. doi: 10.2337/dc07-0114. [DOI] [PubMed] [Google Scholar]
- 48.Chastin SF, Granat MH. Methods for objective measure, quantification and analysis of sedentary behaviour and inactivity. Gait Posture. 2010;31(1):82–6. doi: 10.1016/j.gaitpost.2009.09.002. [DOI] [PubMed] [Google Scholar]
- 49.Helmerhorst HJ, Wijndaele K, Brage S, Wareham NJ, Ekelund U. Objectively measured sedentary time may predict insulin resistance independent of moderate- and vigorous-intensity physical activity. Diabetes. 2009;58(8):1776–9. doi: 10.2337/db08-1773. [DOI] [PMC free article] [PubMed] [Google Scholar]
- 50.Ekelund U, Brage S, Griffin SJ, Wareham NJ ProActive UK Research Group. Objectively measured moderate- and vigorous-intensity physical activity but not sedentary time predicts insulin resistance in high-risk individuals. Diabetes Care. 2009;32(6):1081–6. doi: 10.2337/dc08-1895. [DOI] [PMC free article] [PubMed] [Google Scholar]
- 51.van Uffelen JG, Wong J, Chau JY, van der Ploeg HP, Riphagen I, Gilson ND, Burton NW, Healy GN, Thorp AA, Clark BK, Gardiner PA, Dunstan DW, Bauman A, Owen N, Brown WJ. Occupational sitting and health risks: a systematic review. Am J Prev Med. 2010;39(4):379–88. doi: 10.1016/j.amepre.2010.05.024. [DOI] [PubMed] [Google Scholar]
- 52.Dunstan DW, Kingwell BA, Larsen R, Healy GN, Cerin E, Hamilton MT, Shaw JE, Bertovic DA, Zimmet PZ, Salmon J, Owen N. Breaking up prolonged sitting reduces postprandial glucose and insulin responses. Diabetes Care. 2012;35(5):976–83. doi: 10.2337/dc11-1931. [DOI] [PMC free article] [PubMed] [Google Scholar]
- 53.Stephens BR, Granados K, Zderic TW, Hamilton MT, Braun B. Effects of 1 day of inactivity on insulin action in healthy men and women: interaction with energy intake. Metabolism. 2011;60(7):941–9. doi: 10.1016/j.metabol.2010.08.014. [DOI] [PubMed] [Google Scholar]
- 54.Duvivier BM, Schaper NC, Bremers MA, van Crombrugge G, Menheere PP, Kars M, Savelberg HH. Minimal intensity physical activity (standing and walking) of longer duration improves insulin action and plasma lipids more than shorter periods of moderate to vigorous exercise (cycling) in sedentary subjects when energy expenditure is comparable. PLoS One. 2013;8(2):e55542. doi: 10.1371/journal.pone.0055542. [DOI] [PMC free article] [PubMed] [Google Scholar]
- 55.Manohar C, Levine JA, Nandy DK, Saad A, Dalla Man C, McCrady-Spitzer SK, Basu R, Cobelli C, Carter RE, Basu A, Kudva YC. The effect of walking on postprandial glycemic excursion in patients with type 1 diabetes and healthy people. Diabetes Care. 2012;35(12):2493–9. doi: 10.2337/dc11-2381. [DOI] [PMC free article] [PubMed] [Google Scholar]
- 56.Wasserman DH, Geer RJ, Rice DE, Bracy D, Flakoll PJ, Brown LL, Hill JO, Abumrad NN. Interaction of exercise and insulin action in humans. Am J Physiol. 1991;260(1 Pt 1):E37–45. doi: 10.1152/ajpendo.1991.260.1.E37. [DOI] [PubMed] [Google Scholar]
- 57.DeFronzo RA, Ferrannini E, Sato Y, Felig P, Wahren J. Synergistic interaction between exercise and insulin on peripheral glucose uptake. J Clin Invest. 1981;68(6):1468–74. doi: 10.1172/JCI110399. [DOI] [PMC free article] [PubMed] [Google Scholar]
- 58.Bey L, Akunuri N, Zhao P, Hoffman EP, Hamilton DG, Hamilton MT. Patterns of global gene expression in rat skeletal muscle during unloading and low-intensity ambulatory activity. Physiol Genomics. 2003;13(2):157–67. doi: 10.1152/physiolgenomics.00001.2002. [DOI] [PubMed] [Google Scholar]
- 59.Bey L, Hamilton MT. Suppression of skeletal muscle lipoprotein lipase activity during physical inactivity: a molecular reason to maintain daily low-intensity activity. J Physiol. 2003;551(Pt 2):673–82. doi: 10.1113/jphysiol.2003.045591. [DOI] [PMC free article] [PubMed] [Google Scholar]
- 60.Zderic TW, Hamilton MT. Physical inactivity amplifies the sensitivity of skeletal muscle to the lipid-induced downregulation of lipoprotein lipase activity. J Appl Physiol. 2006;100(1):249–57. doi: 10.1152/japplphysiol.00925.2005. [DOI] [PubMed] [Google Scholar]
- 61.Zderic TW, Hamilton MT. Identification of hemostatic genes expressed in human and rat leg muscles and a novel gene (LPP1/PAP2A) suppressed during prolonged physical inactivity (sitting) Lipids Health Dis. 2012;12;11:137. doi: 10.1186/1476-511X-11-137. [DOI] [PMC free article] [PubMed] [Google Scholar]
- 62.James DE, Jenkins AB, Kraegen EW. Heterogeneity of insulin action in individual muscles in vivo: euglycemic clamp studies in rats. Am J Physiol. 1985;248(5 Pt 1):E567–74. doi: 10.1152/ajpendo.1985.248.5.E567. [DOI] [PubMed] [Google Scholar]
- 63.Mackie BG, Dudley GA, Kaciuba-Uscilko H, Terjung RL. Uptake of chylomicron triglycerides by contracting skeletal muscle in rats. J Appl Physiol Respir Environ Exerc Physiol. 1980;49(5):851–5. doi: 10.1152/jappl.1980.49.5.851. [DOI] [PubMed] [Google Scholar]
- 64.Hamilton MT, Etienne J, McClure WC, Pavey BS, Holloway AK. Role of local contractile activity and muscle fiber type on LPL regulation during exercise. Am J Physiol. 1998;275(38):E1016–E1022. doi: 10.1152/ajpendo.1998.275.6.E1016. [DOI] [PubMed] [Google Scholar]
- 65.Bey L, Areiqat E, Sano A, Hamilton MT. Reduced lipoprotein lipase activity in postural skeletal muscle during aging. J Appl Physiol. 2001;91:687–692. doi: 10.1152/jappl.2001.91.2.687. [DOI] [PubMed] [Google Scholar]
- 66.Hamilton MT, Areiqat E, Hamilton DG, Bey L. Plasma triglyceride metabolism in humans and rats during aging and physical inactivity. International Journal of Sports Nutrition and Exercise Metabolism. 2001;11:95–102. doi: 10.1123/ijsnem.11.s1.s97. [DOI] [PubMed] [Google Scholar]
- 67.Morino K, Petersen KF, Sono S, Choi CS, Samuel VT, Lin A, Gallo A, Zhao H, Kashiwagi A, Goldberg IJ, Wang H, Eckel RH, Maegawa H, Shulman GI. Regulation of mitochondrial biogenesis by lipoprotein lipase in muscle of insulin-resistant offspring of parents with type 2 diabetes. Diabetes. 2012;61(4):877–87. doi: 10.2337/db11-1391. [DOI] [PMC free article] [PubMed] [Google Scholar]
- 68.Rancoule C, Attané C, Grès S, Fournel A, Dusaulcy R, Bertrand C, Vinel C, Tréguer K, Prentki M, Valet P, Saulnier-Blache JS. Lysophosphatidic acid impairs glucose homeostasis and inhibits insulin secretion in high-fat diet obese mice. Diabetologia. 2013;56(6):1394–402. doi: 10.1007/s00125-013-2891-3. [DOI] [PubMed] [Google Scholar]
- 69.Festa A1, Williams K, Hanley AJ, Otvos JD, Goff DC, Wagenknecht LE, Haffner SM. Nuclear magnetic resonance lipoprotein abnormalities in prediabetic subjects in the Insulin Resistance Atherosclerosis Study. Circulation. 2005;28;111(25):3465–72. doi: 10.1161/CIRCULATIONAHA.104.512079. [DOI] [PubMed] [Google Scholar]
- 70.Garvey WT1, Kwon S, Zheng D, Shaughnessy S, Wallace P, Hutto A, Pugh K, Jenkins AJ, Klein RL, Liao Y. Effects of insulin resistance and type 2 diabetes on lipoprotein subclass particle size and concentration determined by nuclear magnetic resonance. Diabetes. 2003;52(2):453–62. doi: 10.2337/diabetes.52.2.453. [DOI] [PubMed] [Google Scholar]
- 71.Jiao S, Kameda K, Matsuzawa Y, Kubo M, Nonaka K, Tarui S. Influence of endogenous hyperinsulinism on high density lipoprotein2 level in type 2 (non-insulin-dependent) diabetes mellitus and impaired glucose tolerance. Atherosclerosis. 1986;60(3):279–86. doi: 10.1016/0021-9150(86)90175-9. [DOI] [PubMed] [Google Scholar]
- 72.Lorenzo C1, Hartnett S, Hanley AJ, Rewers MJ, Wagenknecht LE, Karter AJ, Haffner SM. Impaired fasting glucose and impaired glucose tolerance have distinct lipoprotein and apolipoprotein changes: the insulin resistance atherosclerosis study. J Clin Endocrinol Metab. 2013;98(4):1622–30. doi: 10.1210/jc.2012-3185. [DOI] [PMC free article] [PubMed] [Google Scholar]