Abstract
The movement of macromolecules in cells is assumed to occur either through active transport or by diffusion. However the determination of the diffusion coefficients in cells using fluctuation methods or FRAP frequently give diffusion coefficient that are orders of magnitude smaller than the diffusion coefficients measured for the same macromolecule in solution. It is assumed that the cell internal viscosity is partially responsible for this decrease in the apparent diffusion. When the apparent diffusion is too slow to be due to cytoplasm viscosity, it is assumed that weak binding of the macromolecules to immobile or quasi immobile structures is taking place. In this paper we derive equations for fitting of the RICS (Raster-scan Image Correlations Spectroscopy) data in cells to a model that includes transient binding to immobile structures and we show that under some conditions, the spatio-temporal correlation provided by the RICS approach can distinguish the process of diffusion and weak binding. We apply the method to determine the diffusion in the cytoplasm and binding of Focal Adhesion Kinase-EGFP to adhesions in MEF cells.
Introduction
Fluorescence microscopy has emerged as one of the basic techniques to study cellular processes. Traditionally, fluorescence microscopy was conceived to visualize cells and cellular components. Many of the papers using florescence microscopy however, aim at the description of the time evolution of events occurring in cells. One common technique to obtain dynamic information is that of time lapse microscopy. In this technique, a stack of images is obtained at certain regular intervals and the image stack is then played as a movie. Using this powerful technique it is possible to follow the evolution of cellular processes such as cell division, vesicle transport and other important biological events. Nevertheless, molecular processes that involve interaction between few macromolecules in the cell are difficult to “image” since the resolution of optical microscopy is limited by the wavelength of light. Recent advances in microscopy using stimulated emission and single molecule imaging have partially removed this limitation1–5. However, these new technologies are far from achieving the spatial resolution needed to distinguish and resolve single molecules or molecular complexes. Since many cellular processes involve the interactions of a small number of macromolecules and they occur in volumes smaller than the spatial resolution we must recur to indirect methods to obtain information about these processes inside the cell. In the field of single molecule studies, the most commonly used fluorescence technique that can determine formation of molecular complexes and of associated conformational transitions is FRET (Foster Resonance Energy Transfer)6–16. This technique is very sensitive and particularly informative at the level of single molecules, well isolated from other fluorescent molecules. However, in a cell the specific conditions of very high signal-to-noise necessary for the application of single molecule FRET are difficult to realize. Furthermore, when the process under investigation becomes complicated, the simple FRET approach is insufficient to provide enough information. For example, in a cell the diffusion of a protein in the cytoplasm or in the nucleus can be an important contribution to the overall process being investigated. In this case, the FRET signal is not adequate since FRET per se does not provide information about translational diffusion. Other techniques must be used to extract the desired information. In this article we discuss the RICS technology (Raster Scanning Image Correlation Spectroscopy), its principles and how to analyze the RICS signal to extract information about two important processes in cells, namely diffusion and binding of molecules to specific fixed locations.
The RICS method was originally described in 2005 by Digman et al17, 18 and other papers discussing the RICS approach have appeared ever since19–21. However in the context of distinguishing diffusion from binding a comparison between fluctuation techniques based on single point FCS and the RICS technique, which are based on spatio-temporal correlations, is lacking. Here we focus on spatio-temporal correlations and how they can help in separating diffusion from binding. We introduce and discuss some basic models that we then use to fit the RICS function. We also present a comparison with experimental data and we discuss under which conditions diffusion can be distinguished from binding. In this work we use a cell model in which we have easily identifiable adhesions that are known to bind the FAK protein (Focal Adhesion Kinase) as well as regions free of adhesions where presumably the protein could diffuse relatively freely. In a previous paper we reported that single point FCS, as well as RICS, shows that the protein Paxillin performs diffusive motion in the cytoplasm far from the adhesion but that in the regions with adhesions the apparent diffusion of Paxillin slows down20. We interpreted this reduction of mobility as due to the binding of Paxillin at the adhesion. To prove our point in our previous paper we performed line scanning experiments to show that a model based on binding-unbinding kinetics was giving a better fit to the autocorrelation functions at the adhesions than the equation based on diffusion. However, at that time we had not presented the form of the RICS function for the processes of binding and unbinding (only the formula for line scanning was discussed). Since distinguishing diffusion from binding is a subject of general interest to biologists and biophysicists working in protein interactions in cells, here we developed additional fitting functions which are needed to describe the process of binding equilibria to fixed locations in the RICS context. We show with simulated data the conditions under which diffusion and binding can be recognized. Finally we present some experimental results in which the protein FAK (Focal Adhesion Kinase) diffuses in the cytoplasm but binds reversibly to specific locations (at the adhesions).
The RICS approach
The basic idea behind the RICS approach is that the movement of molecules causes fluctuations in the fluorescence intensity at a given pixel in the image18. If the intensity at one pixel is measured for a very brief period of time and the intensity at a neighbor pixel is measured immediately after, then if a fluorescent molecule moves to this neighboring pixel, there will be a correlation in the intensity fluctuations at these two pixels with a certain time delay, generally very brief. This spatial correlation will occur in a scale that depends on the rate of diffusion, the size of the pixel and could involve several neighboring pixels. Instead, if the intensity at a given pixel fluctuates slowly due to fluorescent molecules that bind to a specific location, and staying in that location for a long (compared to diffusion) time, the spatial correlation of the fluctuation will have a different distribution compared to the case of diffusion since the fluctuation will not transfer to neighboring pixels. Although in the original presentation of the RICS approach we discussed the differences between diffusion and binding, the derivation of the equation needed to fit the RICS function due to molecules undergoing binding-unbinding events was not given.
In the RICS approach, data are collected using a confocal (or two photon) laser scanning microscope. A sample is raster scanned with a pixel dwell time which is generally on the order of few microseconds and the pixel size is set to be smaller (about a factor of 3 to 5) than the waist of the PSF (Point Spread Function). Each line of the scan has duration in the millisecond range and the entire frame is acquired in times on the order of 1s. For RICS it is necessary to repeat the frame acquisition a number of times, generally about 50 to 100 frames. This stack of images is then processed first to subtract the immobile features of the image and then the 2D correlation operation is applied to each of the images of the stack and the average 2D spatial correlation is calculated. This constitutes the RICS data. The 2D RICS data is displayed and analyzed using a fit of the 2D RICS surface to specific models. We show here that under some conditions the shape of the RICS function is different in the case in which we have pure diffusion (2D or 3D) from the case in which we have rapid diffusion to fixed locations of binding. It could appear that fast diffusion and binding is equivalent to slow diffusion since the mean square displacement (MSD) in both cases could be identical. However, if the binding time is longer than the time a molecule takes to transit across the PSF and binding occurs at specific locations, then this process of diffusion and binding gives a different RICS function with respect to pure diffusion. This is an important difference among the two processes which is revealed by the spatio-temporal correlations provided by the RICS approach. On the microscopic scale, fast diffusion followed by frequent stops is of course different than just slow continuous diffusion. Since RICS has the intrinsic ability to show spatio-temporal correlations and to measure fast processes (due to the fast dwell time) and slow processes (due to the long line time), the effect of diffusion (smearing of the PSF) and binding (blinking of the PSF) are distinguishable under some conditions which depend on the time of diffusion and binding in relation to the pixel dwell time and line time. We note that in principle, it is always possible to change these times (dwell and line times) to bring the process that causes the fluctuation in the observable time scale.
Calculation of the RICS surface
The data needed for RICS consists of a stack of several frames (50 to 100) of a raster scan image acquired in rapid succession. The RICS operation consists of calculating the following 2D correlation function:
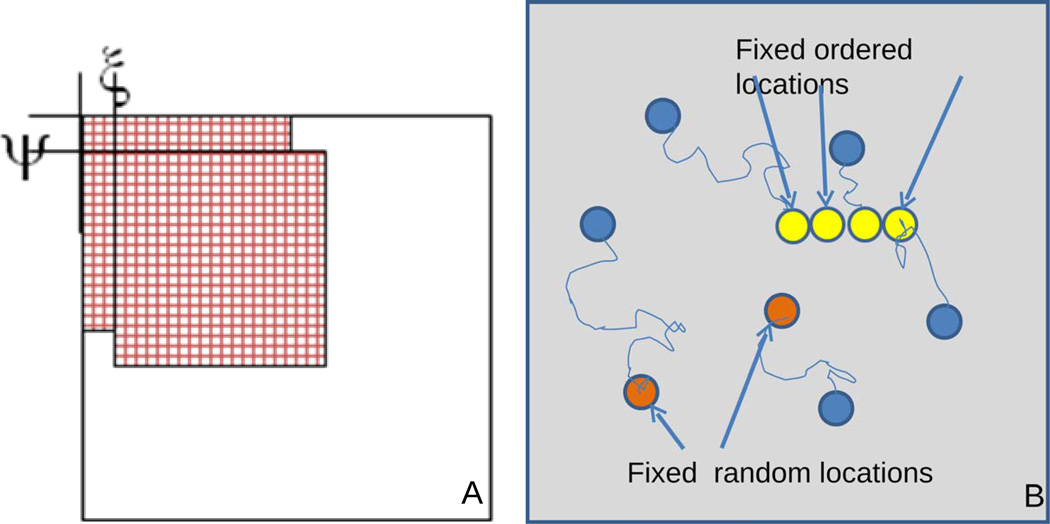
Where I(x,y) is a matrix representing one image of the stack, ξ,ψ are increments in the x and y direction, respectively and the brackets <&> represent averaging over all coordinates of one image. This is also called to RICS autocorrelation function to distinguish from the RICS cross-correlation function which is obtained when the images are from two different channels of the microscope22 (reference to the paper, under review, attached). The autocorrelation operation is schematically shown in Figure 1A.
Figure 1.
A) Schematic representation of the multiplying-shifting operation used in the 2-dimensional correlation function calculation. B) In the random-locations model, particles diffuse and stop at specific locations (red circles). In the ordered-locations model, particles diffuse and then stop ad specific structures in the cell (yellow circles).
The x-axis always corresponds to the fast scanning axis of the image in our derivations. The RICS autocorrelation is efficiently computed using 2D Fast Fourier Transform methods (2dFFT)17. The subtraction of the immobile component and the effect of slow cell movements or bleaching were previously described and will not be repeated here17, 19.
RICS equations for diffusion
The RICS correlation function in its simpler form can be written as the product of three terms. One term corresponds to the effect of diffusion and how the intensity at one pixel propagates to the next neighbor pixel. This term is similar to the normal time dependent term in fluctuation spectroscopy but it accounts for the difference in time between the horizontal line and the vertical line in the raster scan data acquisition method.
| (1) |
In this equation D is the diffusion coefficient in units of µm2/s, τp and τl are the pixel dwell time and the line time in s, respectively and w0 is the waist (1/e2) of the PSF in microns in the radial and wz axial directions. γ is a factor that account for the profile of illumination (0.35 for 3D Gaussian and 0.076 for Gaussian Lorentzian, respectively) and N is the number of molecules in the excitation volume. The second term of the RICS autocorrelation function reflects the apparent broadening of the PSF due to the diffusion of molecules. In the absence of diffusion, this term is just the spatial correlation of the PSF in the radial direction, which we describe with a Gaussian. When diffusion is present, the standard deviation of this Gaussian term becomes time dependent as shown below:
| (2) |
In this expression δr is the pixel size, in microns. In the presence of blinking or any other process (conformational transition) that changes the fluorescence intensity of the diffusing molecule, there is an additional third term in the “time” dependent part of the autocorrelation function given by the following expression:
| (3) |
where A is a constant that depends on the fraction of molecules blinking and on the difference in fluorescence intensity between the two states (which is 1 for pure blinking). The characteristic time τ contains both the time the fluorescence is on and off. In the literature, this term is frequently referred to as the “triplet” or “blinking” term. In the above derivation the same molecule is blinking and diffusing. The overall correlation function is given by the product of the 3 terms above.
| (4) |
RICS equations for binding
For a molecule undergoing binding-unbinding to a fixed location, the fluorescence will “blink” at that location if the diffusion time is much shorter than the permanence time of the molecule at the binding site (Figure 1B). In this case, the RICS autocorrelation function takes the simple form shown below:
| (5) |
The constant A depends on the inverse of the number of binding sites and on the “contrast” between the site to be occupied or not (which is 1 for simple binding-unbinding events). The time constant τ depends on both on and off binding times. If in a sample there are independent molecules diffusing and molecules undergoing binding-unbinding equilibria to fixed locations, the overall correlation function is the linear combination of the correlation functions due to each type of molecules weighted by the square of the relative fluorescence intensity contribution.
Simulations
In this section we perform simulations of particles diffusing in a plane and/or undergoing binding-unbinding equilibria to show the differences in the shape of the RICS function for these two basic molecular processes. The purpose of the simulation is to test the validity of the equations used to fit the RICS functions and to assess the sensitivity of the RICS method in distinguishing diffusion from binding. The model used in the simulation is that of molecules performing a random walk and then suddenly stopping at random intervals for a certain time and then resuming the diffusive motion. In one variant of this model the locations of binding are randomly distributed and, statistically, binding never occurs at the same location. Another possibility is that binding only occurs at fixed locations in the cell, for example the cell adhesions or the cytoskeleton. In this case we could have additional spatial correlations that can be extracted from the RICS measurement.
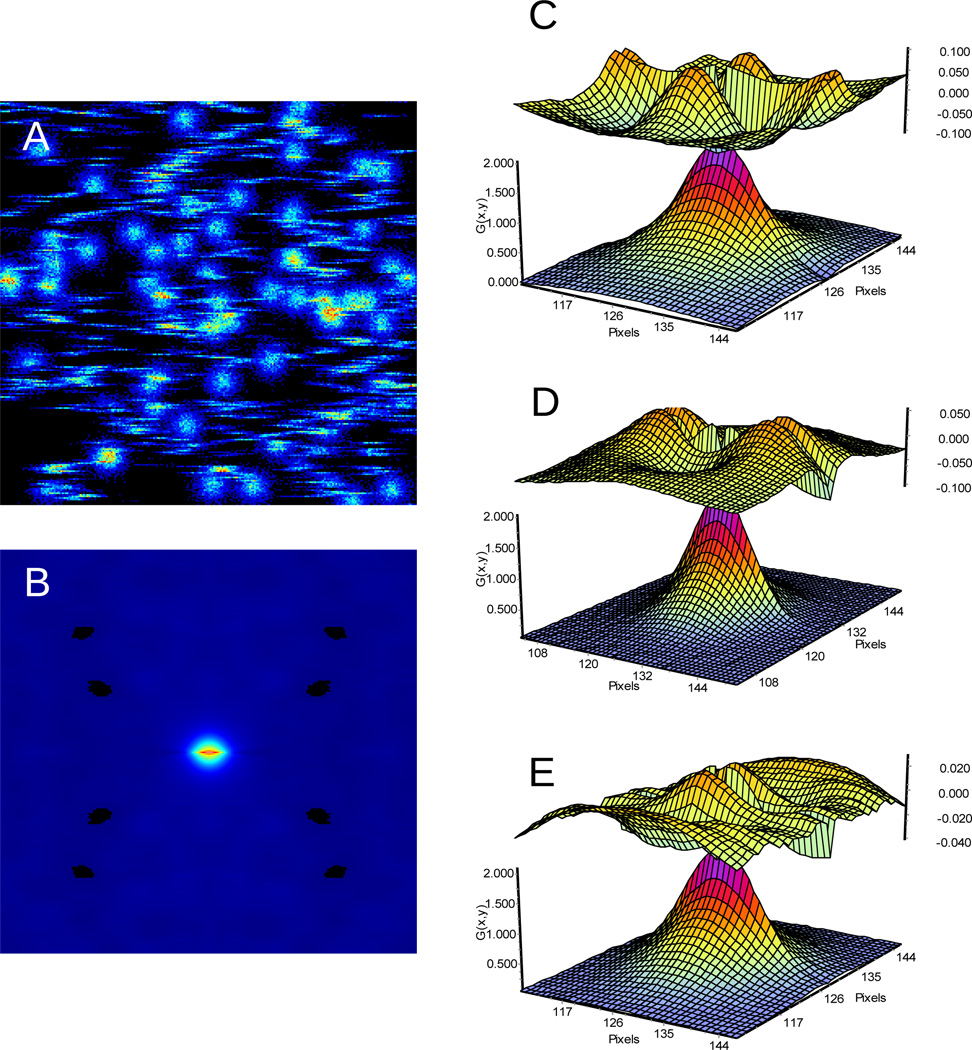
In figure 2A we show one frame of the image obtained when molecules are diffusing fast (compared with the line time) and then suddenly stop at random locations for a long time (relative to the line time). In this case the image is made of streaks, the diffusing molecules and of points (of the size of the PSF) which represent the molecules when they are immobile at the binding sites. Since the positions of the streaks and of the immobile molecules are uncorrelated, the overall RICS (spatio-temporal) correlation is given by the sum of the RICS autocorrelation due to streaks and the RICS of the PSF due to the immobile molecules.
Figure 2.
A) One frame showing the streaks due to the fast diffusing molecules and the round shapes due to the transiently immobile molecules. B) RICS autocorrelation function. C), D) and E are the fit (lower surface) and the residues (upper surface) using the diffusion, binding and diffusion + binding models (respectively). The binding + diffusion model gives the best fit.
Figure 2B shows the RICS function for this simulation. Data were analyzed using a model for pure diffusion (equation 4), pure binding (equation 5, no blinking) or both (linear combination of equation 4 and 5). The fits are shown in Figures 2C–E for the three models. Each figure shows the RICS function and the residues of the fit. The results of the fits are summarized in Table I, where also the two models of binding to random sites or binding to fixed sites are compared and the reduced χ2 of the fits is reported. In every case, the fit using the linear combination of binding and diffusion gives the best fit. If we only compare pure binding with pure diffusion, the binding model gives better χ2.
Table 1.
| Binding to random sitesa | G(0) | D(um2/s) | A | Tau (s) | χ2 |
|---|---|---|---|---|---|
| Using Diffusion | 1.92 | 4.9 | 5.36 | ||
| Using binding | 1.46 | 0.0773 | 1.79 | ||
| Diffusion and binding | 0.84 | 10.1 | 0.93 | 0.1581 | 0.29 |
| Binding to fixed locationsb | G(0) | D(um2/s) | A | Tau (s) | χ2 |
|---|---|---|---|---|---|
| Using Diffusion | 0.55 | 8.5 | 6.64 | ||
| Using binding | 0.47 | 0.0285 | 3.61 | ||
| Diffusion and binding | 0.25 | 7.73 | 0.30 | 0.0283 | 1.01 |
The simulated values for diffusion was 10 µm2/s and for the binding time was 0.16s
The simulated values for diffusion was 10 µm2/s and for binding was 0.028s
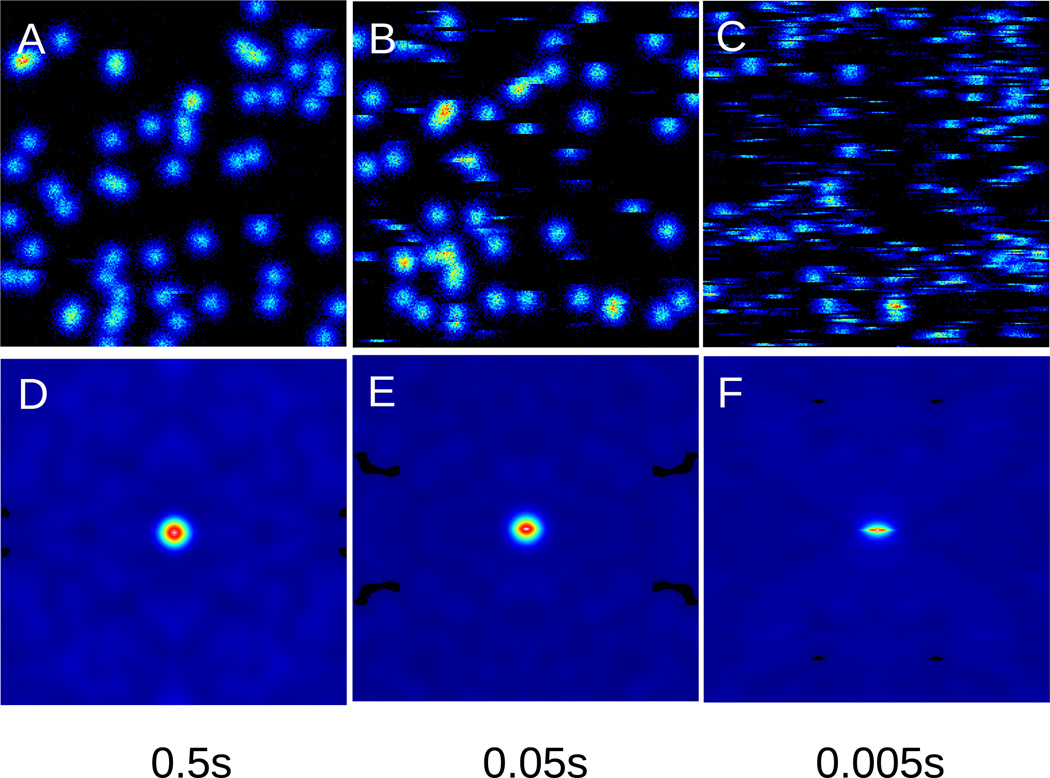
In figure 2A some of the round stopped particles appear to be “broken”. This is due to the binding or unbinding of the particle while the particle is being scanned. When this “breaking of the PSF” becomes more frequent, the overall RICS autocorrelation function becomes narrower in the y direction with respect to the x direction. For this reason the RICS function for a particle undergoing binding equilibria is different from the RICS function of an immobile particle. This effect is accounted for in equation (5) which contains the exponential decrease of the shape of the PSF differentially in the x and y directions. Figures 3 A–C show frames of the simulation of particles with different binding time, decreasing from A to C. As the binding time decreases, the RICS correlation functions in Figure 3D to F become narrower in the y direction.
Figure 3.
Frames A), B) C) and RICS function D), E), F) obtained using the binding model showing the effect of the narrowing of the RICS function as the binding time decreases from 0.5s to 0.005s, respectively.
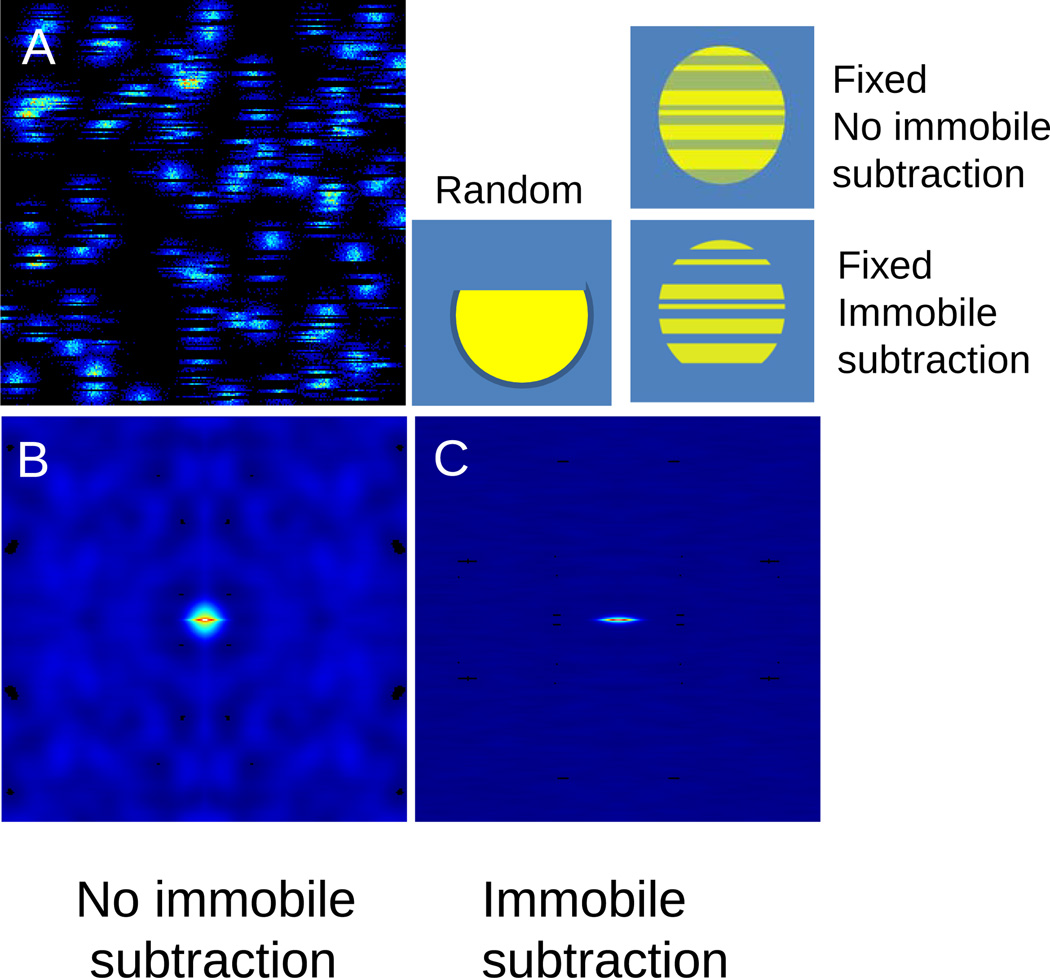
Although the particles are immobile when bound, these particles cannot be eliminated by the method of background subtraction as described in Digman et al since the particles remains in a random location for less than a frame. Therefore the application of the immobile subtraction algorithm will not change the shape of the RICS function. Of course, when the binding time is very long with respect to the frame time the immobile subtraction algorithm will eliminate the contribution to fluctuations of all the immobile particles residing at a site for several frames. An interesting effect occurs when the particles bind to fixed locations (rather than to random locations). In this case, at one location the shape of the particle will appear to be equal to the size of the PSF (not broken) with bands on it, as shown in Figure 4. When the average particle is subtracted, only the bands remain giving a particular shape of the RICS function (Figure 4C). In this case the RICS function will be different after application of the immobile subtraction algorithm as shown in figure 4.
Figure 4.
Effect of the immobile subtraction algorithm. A) Molecules are diffusing and binding to fixed locations. B) The RICS function is the sum of the diffusion and the binding. When the molecules are bound they give a contribution to the RICS function which is due to the shape of the PSF. C) Since the location of binding are fixed, this contribution can be subtracted using the immobile subtraction algorithm.
Therefore if the RICS autocorrelation function changes shape depending on the application or not of the immobile subtraction algorithm or it changes shape depending on the length of the moving average filter, this is evidence of binding to fixed location. The occurrence of this phenomenon was pointed out in a recent paper (Digman et al, manuscript under review, attached). We will use the differences in the shape if the RICS function when the data are analyzed using background subtraction to asses if binding occurs at fixed or random locations.
We performed simulations in which we systematically changed the binding time and the number of particles in the simulations. In each case we calculated the RICS autocorrelation function and fitted the data using the different models (diffusion, binding to random locations and to fixed locations). Table 2 shows the values of the A and τ parameters in equation 5 used to fit the simulated data as a function of the number of particles and the time of binding (sum of “on “and “off” times). The value of A is dependent on the inverse of the number of binding sites and τ is linearly correlated with the total “on” and “off” time, as expected (Table 2) only if the molecules when performing diffusion have been dimmed so that the pure effect of binding can be shown with clarity.
Table 2.
| A) While diffusing or binding the particle has the same brightness. | ||||||
|---|---|---|---|---|---|---|
| Nominal time | A (mobile) |
Tau (s) | χ2 | A (fixed) |
Tau(s) | χ2 |
| 0.5 | 1.545 | 0.106213 | 2.87 | 0.50194 | 0.054112 | 3.14 |
| 0.05 | 1.47931 | 0.072177 | 1.63 | 0.48385 | 0.025532 | 2.46 |
| 0.005 | 1.379 | 0.042390 | 6.56 | 0.27174 | 0.006111 | 7.91 |
| B) While diffusing the particle is 10 times dimmer than when binding. | ||||||
|---|---|---|---|---|---|---|
| Nominal time | A (mobile) |
Tau (s) | χ2 | A (fixed) |
Tau(s) | χ2 |
| 0.5 | 3.142 | 1.20 | 0.47 | 1.363 | 0.244 | 0.18 |
| 0.05 | 3.217 | 0.109 | 0.55 | 1.404 | 0.0603 | 0.50 |
| 0.005 | 2.317 | 0.027 | 3.60 | 1.300 | 0.0055 | 0.80 |
| C) The parameter A is proportional to the inverse of the number of binding sites. | ||
|---|---|---|
| N of sites | A | Tau (s) |
| 25 | 2.92 | 0.0052 |
| 50 | 1.41 | 0.0052 |
| 100 | 0.736 | 0.0052 |
| 200 | 0.370 | 0.0052 |
From the simulation we can see that when the “on-off” time becomes longer with respect to the line time, we cannot determine the binding time. Of course, if we increase the line time we can always bring the time scale of the binding event into the observation time of the line. However, this can become inconvenient. In the case of very long binding time, we can recur to the well-established tICS technique in which the correlation between frames are used to determine the binding time23. A problem with very long binding times is that the statistics could be poor since few events are observed and also that the binding process starts to superimpose with the characteristic time of other processes such as bleaching and cell movements which generally are in the several seconds time scale. However, we will like to emphasize that it is the very fast time scale that is difficult to explore with other methods and that the RICS technique as presented here is ideal to detect binding equilibria from microseconds to several hundred milliseconds.
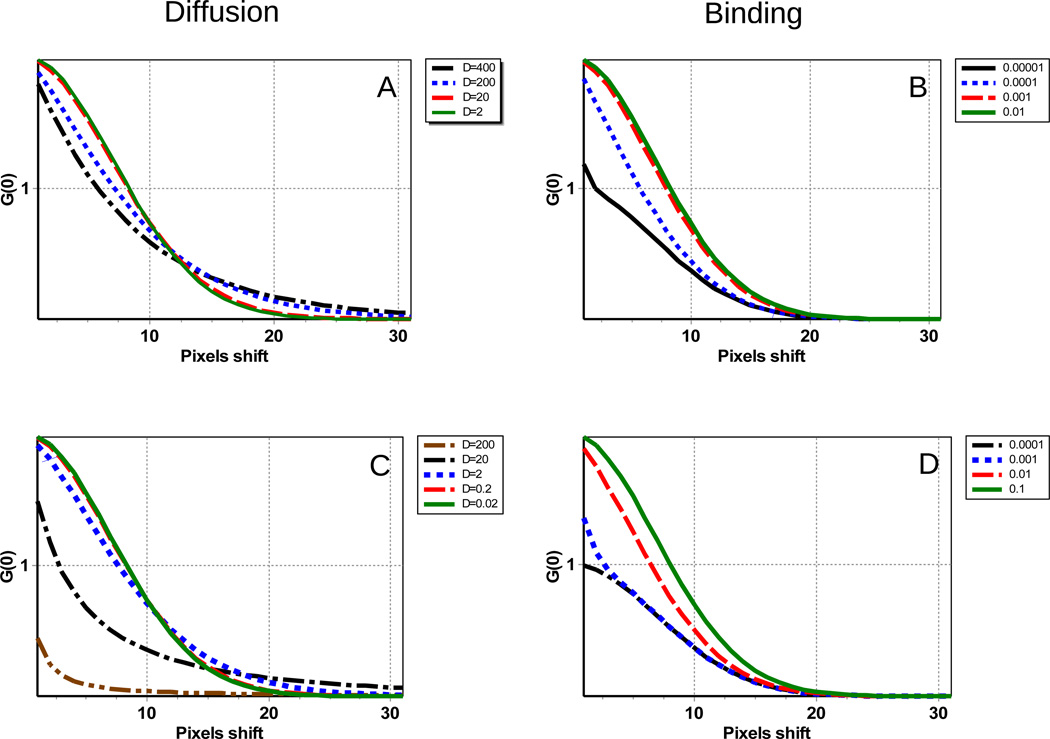
The simulations show that the overall shape for the RICS function in the case of binding equilibria is made of two parts. One part is due to the PSF shape, it is roundish (symmetric in the x–y plane) and the size of this component is independent on the binding rate. This part arises because there is correlation between the pixels within the PSF as a specific site is occupied or not. The second part is instead oblong, but contrary to the shape of the RICS function due to diffusion which can have sizes larger than the PSF in the x direction, it is always confined to the size of the PSF. It has an exponential shape in both the x and the y directions with a characteristic length given by the binding time. To illustrate this principle, we show in Figure 5 the horizontal and vertical lines of the RICS autocorrelation function. In the case of pure diffusion, the lines (both horizontal and vertical) have a tail that extends beyond the limit of the PSF. This tail becomes larger when the diffusion is fast. In the case of pure binding, the RICS autocorrelation is always smaller or equal to the size of the PSF. When the process of binding-unbinding is fast, the RICS function becomes narrower. Therefore, it is the analysis of the tail of the RICS function that will separate diffusion from binding. Instead the part of the RICS function at smaller shifts always becomes narrower as the diffusion increases or the time of binding-unbinding decreases.
Figure 5.
A) and B) Horizontal and C) and D) vertical sections of the RICS surface for different values of the diffusion coefficient and binding time. A) The diffusion coefficient varied from D=400 to 2µm2/s). B) The binding time varied from 0.00001 to 0.01s. C) The diffusion coefficient varied from D=200 to 0.02µm2/s). D) The binding time varied from 0.0001 to 0.1s
In the case of binding to fixed locations, if we subtract the “immobile fraction”, i.e., the part that is in common to all frames, we effectively subtract the Gaussian symmetric part of the RICS function due to the PSF, leaving only the exponential part in the x–y directions. This effect can be used to distinguish between the two modalities of binding.
Materials and Methods
Cell culture and protein transfection
Mouse Embryonic Fibroblasts (MEF) were cultured at 37C in a 5% CO2 humidified incubator. After trypsinization, cells were subcultured and transferred from a 35 mm tissue culture flask to a 25 mm, 6 well Falcon tissue culture (Becton-Dickinson, Bedford, MA). Cells were then grown to 50–80% confluency, transfected with 1 g of DNA (0.5 g of DNA/protein for co-transfections) and 5 g of lipofectamine 2000 from Invitrogen (Carlsbad, CA). FAK (Focal Adhesion Kinase) cDNA was ligated to EGFP at the C-terminal end as previously described. After 24 h of transfection cells were plated using High Glucose DMEM media (Pierce-Hyclone, Logan, UT supplemented with 10% FBS and PEN/STREP) on MatTek (Ashland, MA) imaging dishes previously coated with 3 g of fibronectin from Sigma-Aldrich (Louis, MO) one hour prior to imaging.
Microscopy
We used an Olympus FV1000 microscope with a 60× 1.2 NA water objective (Olympus, Tokyo, Japan). The scan speed was set at 12.5µs/pixel. The scan area was 256×256 pixels and about 100 frames were collected for each sample. The corresponding line time was 4.325 ms and the frame time was 1.15 s. The electronic zoom of the microscope was set to 16.3, which corresponds to a region of 12.5 µm square. For the EGFP excitation, we used the 488 nm line of the argon ion laser. The power of the 488 nm laser was set between 0.5 and 1% according to the power slider in the FV1000 microscope. This power corresponds to less than 10µW as measured at the objective. Data were collected in the pseudo photon counting mode of the Olympus FV1000 microscope. The filter for the green emission channel had a nominal bandwidth of 505–540 nm.
RICS analysis
We used the SimFCS program (Laboratory for Fluorescence Dynamics) for the RICS analysis. For the RICS analysis data were collected in the 256×256 frame format. The immobile fraction removal as described by Digman et al.17 was used for all data analysis unless specifically stated. For each simulation or experiment, the RICS function is calculated as the average of all images of the stack. For each point of the RICS function we can also calculate the standard deviation of this stack. This value was used as the “error” of each point to calculate the reduced chi-square reported in the Tables. For all simulations the pixel size was 50nm (the image size is 12.5 µm) and the waist of the PSF was 0.5 µm. The pixel time was 16.25 µs and the line time was 4.16 ms.
Results
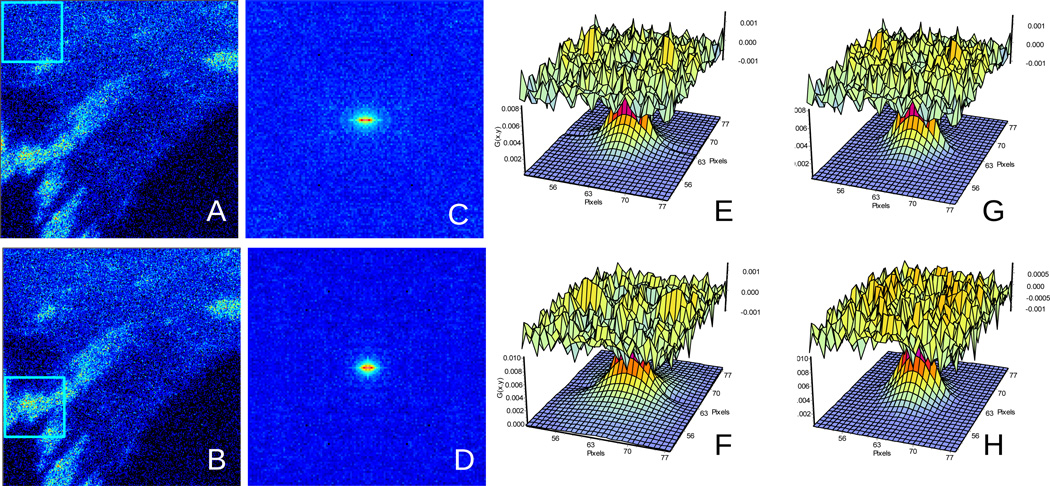
In this section we analyze data obtained for the protein FAK-EGFP in MEF transfected cells. Figure 6 Cell1 shows the average image of the cell and the RICS function calculated using a moving average of 10 frames (MAV10), which selects the fast events in two parts of the cell. In one part of the cell, the analysis is performed mainly in the cytoplasm (free of adhesions) as shown by the red square selected region.
Figure 6.
RICS analysis of a MEF cell1 expressing FAK-EGFP. This cell has regions with few adhesions (A) and regions with many adhesions (B). The corresponding RICS function (C) and (D) and the fits according to the diffusion model (E) and (F) and binding model (G) and (H) are reported in table 3.
We perform the analysis of the RICS surface using equation (4) and Equation (5). In the regions of the cytoplasm free of adhesions, equation 4 fits better the RICS surface as shown by the lower value of the χ2 (when the same RICS surface is analyzed by the binding equation (Table 3). Instead, in the region of the cell where adhesions are more abundant, Equation 5 fits better the RICS data (Table 3). In particular we observed that for the MAV10 analysis, the fit using the binding model gives slightly better chi-square at the adhesions (1.46) than the diffusion (1.87) but in the cytoplasm both models are equivalent. For the MAV40 analysis, the diffusion model gives a better chi-square (3.80) than the binding (3.93) in the cytoplasm. At the adhesions, the binding model gives a better chi-square (3.96) than the diffusion model (5.43).
Table 3.
| Diffusion model | Binding model | |||||
|---|---|---|---|---|---|---|
| Region MAV10a | G(0) | D (µm2/s) | χ2 | A | tau (s) | χ2 |
| Cell 1 Cytoplasm | 0.0065 | 4.59 | 1.65 | 0.00483 | 0.0163 | 1.64 |
| Cell 1 Adhesions | 0.0059 | 1.90 | 1.87 | 0.00560 | 0.0207 | 1.48 |
| Cell 2 All | 0.0036 | 2.79 | 4.82 | 0.00287 | 0.0162 | 4.81 |
| Diffusion model | Binding model | |||||
|---|---|---|---|---|---|---|
| Region MAV40b | G(0) | D (µm2/s) | χ2 | A | tau (s) | χ2 |
| Cell 1 Cytoplasm | 0.0082 | 5.14 | 3.80 | 0.00614 | 0.0142 | 3.93 |
| Cell 1 Adhesions | 0.0101 | 1.53 | 5.43 | 0.00884 | 0.0220 | 3.96 |
| Cell 2 All | 0.0017 | 3.07 | 7.73 | 0.00145 | 0.0287 | 5.59 |
MAV10 indicates that data were analyzed using a moving average of 10 frames (about 10s)
MAV40 indicates that data were analyzed using a moving average of 40 frames (about 40s)
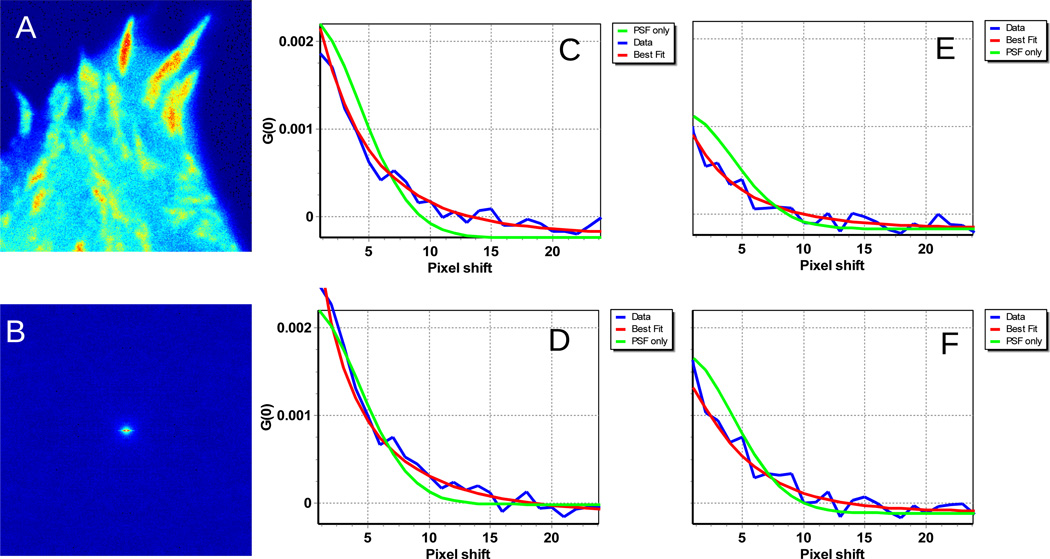
We note here that the two models used for the fit represent the extreme cases of pure diffusion or pure binding to random independent locations. In reality, both processes happen simultaneously. Of course, we could do a fit using the linear combination of the two models as we did for the simulations. However, in the case of the real measurements, the S/N is relatively poor and a fitting using many parameters, which is needed if we want to have both diffusion and binding, will give parameters affected by a large error. We also analyzed another cell (Figure 7-cell 2), which is covered with adhesions. We used a different length of the moving average algorithm to remove the fast moving adhesions. When the moving average is 10 frames (about 10s) we emphasize the fast processes. In this case, the diffusion and binding model give similar values of the reduced chi-square (Table 3, cell2). We reanalyzed the same data set using a longer length for the moving average (40 s in this case). The fit of the overall image using the binding model when using the analysis of 40MAV gives a better chi-square (5.59) than the diffusion model (7.73).
Figure 7.
A) MEF cell2 expressing FAK-EGFP. Cell 2 has high concentration of adhesions everywhere. B) The RICS function has the characteristics shape of “binding”. C) and E) correspond to the horizontal and vertical fits using the binding + diffusion model after immobile subtraction using 10 frames for the moving average. ”. D) and F) correspond to the horizontal and vertical fits using the binding + diffusion model after immobile subtraction using 40 frames for the moving average.
This indicates that for this cell there are slow processes at the adhesions and that binding occurs at fixed locations (the adhesions). In general we found that the regions with adhesions always fit better using the binding equations and the regions without adhesions always fit better with the diffusion model.
Discussion
The simulations show that the form of the RICS autocorrelation function for diffusion and for binding is different. The major difference can be noticed in the tail at large pixel shift of the RICS surface. In principle, we should be able to distinguish diffusion from binding by the shape of the RICS autocorrelation function. In practice, we are limited by the S/N and the assignment of the RICS function either to diffusion or binding is not straightforward in the presence of large noise.
The RICS autocorrelation function measured for FAK shows different behavior when data are analyzed in regions of the cell where there are few adhesions and in regions where there are many adhesions. In all cases investigated the fit using the diffusion model better describes the RICS surface far from the adhesions while in the adhesion regions the binding model better describe the data. Among the two models for binding, i.e., binding to few fixed locations or binding to random locations, we found that the later model better describes the data. In fact, the observed change of the RICS autocorrelation function as the length of the moving average immobile subtraction algorithm is increased points out that binding occurs to randomly located sites.
In regard to the binding time, since changing the length of the moving average, i.e., selecting the slow processes changes the shape of the RICS autocorrelation, there are slow processes in the 10s (or longer) time scale related to binding-unbinding. In a previous paper we have identified the disassembling of relatively large portions of the focal adhesion as the process responsible for this slow dynamics21, 22. The question remains if we can also observe the binding events. The deformation of the RICS autocorrelation function in the regions of the adhesion toward a shape more compatible with the binding process is evidence of fast binding-unbinding equilibria. According to our simulations, assuming that the diffusion of the free protein in the cytoplasm is about 20 µm2/s and that the “apparent” measured diffusion is about 2 um2/s, the weak binding events should occur in the 10–50 ms range. We propose that only few of the binding events are productive, perhaps due to the binding with a proper partner or requiring some conformational transition to stabilize the protein at the adhesion.
An important conclusion of this work is that spatio-temporal correlations can provide detailed information about molecular processes in cells. However, to exploit this information we need to have sufficient S/N ratio. In our experiments with the FAK protein we were able to detect both diffusion and binding. However the quantification of these two processes is problematic. In principle the S/N ratio could be improved by integrating the signal for a longer time. However, it is the apparent sliding of the adhesions and their dynamics that limits the observation of one site to relatively short total integration times. In our cells, the turnover time of the adhesions was about 2–3 minutes.
Conclusions
The effect of binding to immobile locations on the RICS autocorrelation function has been studied using simulated data. The effect is quite dramatic under some favorable circumstances. The simulation allowed us to establish some characteristics changes of the RICS function and to recognize the existence of the binding. We have observed some of the characteristic features of binding in the RICS function obtained in MEF cells expressing the FAK protein. This protein is found in the cytoplasm and at the adhesions. Both fast binding and slow dissociations where detected which were also spatially distinct.
Acknowledgements
Work supported in part by U54 GM064346 Cell Migration Consortium (MD and EG), NIH-P41 P41-RRO3155 (EG) and P50-GM076516 (EG). We thank Jenny Sasaki for cultivating and for transfection of the MEF cells.
REFERENCES
- 1.Betzig E, et al. Imaging intracellular fluorescent proteins at nanometer resolution. Science. 2006;313:1642–1645. doi: 10.1126/science.1127344. [DOI] [PubMed] [Google Scholar]
- 2.Gustafsson MG. Super-resolution light microscopy goes live. Nat Methods. 2008;5:385–387. doi: 10.1038/nmeth0508-385. [DOI] [PubMed] [Google Scholar]
- 3.Shroff H, Galbraith CG, Galbraith JA, Betzig E. Live-cell photoactivated localization microscopy of nanoscale adhesion dynamics. Nat Methods. 2008;5:417–423. doi: 10.1038/nmeth.1202. [DOI] [PMC free article] [PubMed] [Google Scholar]
- 4.Willig KI, Rizzoli SO, Westphal V, Jahn R, Hell SW. STED microscopy reveals that synaptotagmin remains clustered after synaptic vesicle exocytosis. Nature. 2006;440:935–939. doi: 10.1038/nature04592. [DOI] [PubMed] [Google Scholar]
- 5.Rust MJ, Bates M, Zhuang X. Sub-diffraction-limit imaging by stochastic optical reconstruction microscopy (STORM) Nat Methods. 2006;3:793–795. doi: 10.1038/nmeth929. [DOI] [PMC free article] [PubMed] [Google Scholar]
- 6.Ballestrem C, Geiger B. Application of microscope-based FRET to study molecular interactions in focal adhesions of live cells. Methods Mol Biol. 2005;294:321–334. doi: 10.1385/1-59259-860-9:321. [DOI] [PubMed] [Google Scholar]
- 7.Chen H, Puhl HL, 3rd, Koushik SV, Vogel SS, Ikeda SR. Measurement of FRET efficiency and ratio of donor to acceptor concentration in living cells. Biophys J. 2006;91:L39–L41. doi: 10.1529/biophysj.106.088773. [DOI] [PMC free article] [PubMed] [Google Scholar]
- 8.Chen Y, Mills JD, Periasamy A. Protein localization in living cells and tissues using FRET and FLIM. Differentiation. 2003;71:528–541. doi: 10.1111/j.1432-0436.2003.07109007.x. [DOI] [PubMed] [Google Scholar]
- 9.Chen Y, Periasamy A. Localization of protein-protein interactions in live cells using confocal and spectral imaging FRET microscopy. Indian J Exp Biol. 2007;45:48–57. [PubMed] [Google Scholar]
- 10.Clayton AH, Klonis N, Cody SH, Nice EC. Dual-channel photobleaching FRET microscopy for improved resolution of protein association states in living cells. Eur Biophys J. 2005;34:82–90. doi: 10.1007/s00249-004-0427-y. [DOI] [PubMed] [Google Scholar]
- 11.Gautier I, et al. Homo-FRET microscopy in living cells to measure monomer-dimer transition of GFP-tagged proteins. Biophys J. 2001;80:3000–3008. doi: 10.1016/S0006-3495(01)76265-0. [DOI] [PMC free article] [PubMed] [Google Scholar]
- 12.Gertler A, Biener E, Ramanujan KV, Djiane J, Herman B. Fluorescence resonance energy transfer (FRET) microscopy in living cells as a novel tool for the study of cytokine action. J Dairy Res. 2005;72(Spec No):14–19. doi: 10.1017/s0022029905001123. [DOI] [PubMed] [Google Scholar]
- 13.Meyer BH, et al. FRET imaging reveals that functional neurokinin-1 receptors are monomeric and reside in membrane microdomains of live cells. Proc Natl Acad Sci U S A. 2006;103:2138–2143. doi: 10.1073/pnas.0507686103. [DOI] [PMC free article] [PubMed] [Google Scholar]
- 14.Takanishi CL, Bykova EA, Cheng W, Zheng J. GFP-based FRET analysis in live cells. Brain Res. 2006;1091:132–139. doi: 10.1016/j.brainres.2006.01.119. [DOI] [PubMed] [Google Scholar]
- 15.Tramier M, et al. Homo-FRET versus hetero-FRET to probe homodimers in living cells. Methods Enzymol. 2003;360:580–597. doi: 10.1016/s0076-6879(03)60129-1. [DOI] [PubMed] [Google Scholar]
- 16.Zal T, Gascoigne NR. Photobleaching-corrected FRET efficiency imaging of live cells. Biophys J. 2004;86:3923–3939. doi: 10.1529/biophysj.103.022087. [DOI] [PMC free article] [PubMed] [Google Scholar]
- 17.Digman MA, et al. Measuring fast dynamics in solutions and cells with a laser scanning microscope. Biophys J. 2005;89:1317–1327. doi: 10.1529/biophysj.105.062836. [DOI] [PMC free article] [PubMed] [Google Scholar]
- 18.Digman MA, et al. Fluctuation correlation spectroscopy with a laser-scanning microscope: exploiting the hidden time structure. Biophys J. 2005;88:L33–L36. doi: 10.1529/biophysj.105.061788. [DOI] [PMC free article] [PubMed] [Google Scholar]
- 19.Brown CM, et al. Raster image correlation spectroscopy (RICS) for measuring fast protein dynamics and concentrations with a commercial laser scanning confocal microscope. J Microsc. 2008;229:78–91. doi: 10.1111/j.1365-2818.2007.01871.x. [DOI] [PMC free article] [PubMed] [Google Scholar]
- 20.Digman MA, Brown‡† Claire M, Horwitz‡ Alan R, Mantulin* William W, Gratton* Enrico. Paxillin binding dynamics across adhesions measured by correlation spectroscopy. Biophysical Journal. 2007 doi: 10.1529/biophysj.107.104984. Under review. [DOI] [PMC free article] [PubMed] [Google Scholar]
- 21.Digman MA, Brown CM, Horwitz AR, Mantulin WW, Gratton E. Paxillin dynamics measured during adhesion assembly and disassembly by correlation spectroscopy. Biophys J. 2008;94:2819–2831. doi: 10.1529/biophysj.107.104984. [DOI] [PMC free article] [PubMed] [Google Scholar]
- 22.Digman MA, Wiseman Paul, Horwitz Alan R, Gratton Enrico. Nature Methods (in review) 2008 [Google Scholar]
- 23.Wiseman PW, et al. Spatial mapping of integrin interactions and dynamics during cell migration by image correlation microscopy. J Cell Sci. 2004;117:5521–5534. doi: 10.1242/jcs.01416. [DOI] [PubMed] [Google Scholar]


