Abstract
The surfaces of iron oxide nanoparticles are capable of catalytically generating reactive oxygen species (ROS) through the Fenton and Haber-Weiss reactions. Fenton chemistry has been shown to be temperature dependent with an increase in activity up to 40 °C and then a decrease above this temperature as the hydrogen peroxide degrades into oxygen and water which limits the reaction. When exposed to an alternating magnetic field (AMF), iron oxide nanoparticles absorb the energy from the magnetic field and convert it into heat. In this study, we observed an increase in the degradation of methylene blue when a suspension of magnetite nanoparticles (Fe3O4) was exposed to an AMF indicating there was an increase in the ROS generation in response to the AMF. The increase in ROS generation compared to the Arrhenius prediction was both time and concentration dependent; in which we observed a decrease in ROS enhancement with increased time of exposure and concentration. We postulate that the decrease is due to agglomeration in the presence of the field. As the nanoparticles agglomerate, there is a decrease in surface area per mass limiting the reaction rate.
Keywords: magnetic nanoparticles, free radical generation, Fenton catalyst, methylene blue
1. Introduction
Magnetic nanoparticles are of great interest for a wide range of applications due to their unique physical properties.1, 2 These applications include catalysis, biomedical imaging, anemia supplement, drug delivery, thermal therapy, and environmental remediation.3-9 One physical property that has presented itself as a double-edged sword is the generation of free radicals attributed to Fenton and Haber-Weiss chemistries. In the case of biomedical applications, the generation of free radicals leads to oxidative stress which is believed to be one of the key underlying mechanisms of concentration dependent cytotoxicity.10-16 At the same time, iron oxide nanoparticles are combined with hydrogen peroxide and successfully used as advanced oxidation processes for the removal organic contaminates from wastewater.17 In both cases, iron oxide nanoparticles act as a homogeneous and heterogeneous catalyst for the degradation of hydrogen peroxide into free radicals. The catalytic mechanism is based on the environment. Under neutral conditions, Voinov et al. have demonstrated through spin-trapping EPR that γ-Fe2O3 nanoparticles produce hydroxyl radicals primarily on the surface rather than dissolution of free ions.18 At lower pH, such as the microenvironment of a lysosome, iron ions can be released from the nanoparticle surface resulting in a greater extent of homogeneous catalysis.19
When exposed to an alternating magnetic field (AMF), magnetic nanoparticles absorb the energy from the magnetic field and convert it into heat through primarily through Brownian relaxation (physical rotation of the particles) and Neel relaxation (rotation of the magnetic moment).20 This heat generation has been extensively studied as magnetic fluid thermal therapy for the treatment of cancer.21, 22 Until recently, intracellular hyperthermia has been considered improbable due to heat transport calculations by Rabin that demonstrated theoretically the heat generated from a single nanoparticle or cluster of nanoparticles would be negligible to the cell.23 However, work by Creixell et al. has demonstrated that internalized targeted nanoparticles can induce cellular death when exposed to an alternating magnetic field without a measurable temperature rise.24 In follow-up work, the surface temperature of the nanoparticles was shown to instantly increase and to drive a temperature responsive polymer beyond its lower critical solution temperature of 35 °C without an immediate increase in solution temperature.25 Thereby, they demonstrated that the localized heating from the nanoparticle surface is capable of altering surrounding chemistry and possibly a mechanism of the previously reported toxicity. The exact mechanism of toxicity is still under debate, however the evidence of a local heating effect provides interesting scenarios where the energy dissipated by the nanoparticles can be utilized to only alter the near surrounding volume.
The kinetic behavior of the advanced oxidation process involving magnetic nanoparticles to mineralize pollutants has been extensively studied.26-29 Temperature is one of the driving factors of the Fenton-like reaction up to about 40 °C.30 Above this temperature, hydrogen peroxide begins to degrade into oxygen and water limiting the reaction. To date, no one has studied the effect of AMF exposure on the generation of free radicals from iron oxide nanoparticles.
The main objective of this study is to determine the influence of AMF exposure on the degradation of methylene blue by magnetite nanoparticles (Fe3O4) and hydrogen peroxide. Three iron oxide concentrations were selected based on their ability to heat the surrounding media. The low concentration of iron oxide nanoparticles did not heat the solution above the radiant heat from the inductive source coil; whereas the high concentration actively heated the solution. The kinetic behavior was first determined using temperature controlled water baths. This data was used to extrapolate an Arrhenius relationship which provided theoretical values based on the temperature achieved during AMF exposure. The reported enhancement was defined as the ratio of the experimental degradation observed compared to the theoretical value.
2. Materials and methods
2.1 Materials
Iron (III) chloride hexahydrate (FeCl3·6H2O); iron (II) chloride tetrahydrate (FeCl2·4H2O); hydrogen peroxide (H2O2); and methylene blue (MB) were obtained from Sigma Aldrich (St Louis, MO). Ammonium hydroxide (NH4OH) was obtained from EMD Chemicals (Gibbstown, NJ). All materials were used as received.
2.2 Iron oxide nanoparticle synthesis
A one-pot co-precipitation method was used to prepare the iron oxide nanoparticles as similarly reported previously.31 Briefly, aqueous solutions of FeCl3·6H2O and FeCl2.4H2O were combined in a 2:1 molar ratio in a sealed three-neck flask under vigorous stirring and an inert N2 environment. Once 85 °C was reached, a 1.5 M solution of NH4OH was injected into the vessel and the reaction was carried out for 1 hour. The nanoparticles were initially decanted via magnetic decantation to remove majority of the impurities. After, they were resuspended in water and transferred to a dialysis bag for 48 hours of dialysis. Following the washing steps, the particles were stored in suspension.
2.3 Nanoparticle characterization
Dynamic Light Scattering (DLS)
DLS measurements were obtained using a Malvern Zetasizer, Nano ZS90 instrument. Nanoparticles were diluted in DI water to a concentration of 200 μg/mL and dispersed using ultrasonication.
Alternating Magnetic Field heating
The AMF heating profile was observed using a custom made Taylor Winfield magnetic induction source and temperature was measured with a Luxtron FOT Lab Kit. Nanoparticles were diluted in DI water to a concentration of 5 mg/mL. One ml of solution was placed in a 2 ml centrifuge tube and placed in the center of the coil. The solution was heated in a field of approximately 60 kA/m in strength at 292 kHz frequency for 5 minutes.
2.4 Methylene blue degradation
The methylene blue degradation experiments were performed in 2 ml microcentrifuge tubes in either temperature controlled water baths or exposed to an AMF. One ml samples were prepared by diluting stock concentrations of methylene blue to 5 μg/ml and iron oxide nanoparticles to 37.5, 75, and 150 μg/ml. The samples were placed in the water bath for 10 min to equilibrate to the set temperature. The degradation was initiated by spiking the samples with 25 μl of 30% H2O2 to a working concentration of 245 mM. After given time intervals the samples were centrifuged for 30 s using a Phenix Quickspin Centrifuge, magnetically decanted, and measured using UV-visible spectroscopy (maximum absorbance at 665 nm) with a Varian Cary. To account for nanoparticle scattering from the nanoparticles that remain in suspension, samples containing only nanoparticles were measured and subtracted out from the sample absorbance.
Samples exposed to the AMF were prepared as described above. They were placed in water baths which corresponded to the expected steady state temperature as a result of field exposure. The samples were exposed to a field of approximately 51.0 kA/m in strength at 292 kHz frequency while temperature was measured with a Luxtron FOT Lab Kit.
2.5 Statistical analysis
Statistical analysis of the enhancement factor was determined using a one sample t-test where the hypothetical mean was set to 1. To indicate significant enhancement a single, double, or triple asterisk corresponding to P < 0.05, 0.01, and 0.001 respectively were included in the figure.
3. Results and Discussion
3.1 Nanoparticle characterization
The hydrodynamic size of the particles was determined with DLS and reported as Z-average. Iron oxide nanoparticles were 107 nm with a PDI of 0.176 when dispersed in water. Previous work with TEM has determined the core nanoparticles to be on the order of 10 nm. As these are uncoated nanoparticles with no stabilizing group, agglomerates are likely contributing the in the increase in hydrodynamic size compared to the crystal size observed in TEM.
The heating characteristics of the nanoparticle systems in an AMF were examined, and the heating profiles can be seen below in Figure 1. The specific absorption ratio (SAR) was calculated:
Figure 1.
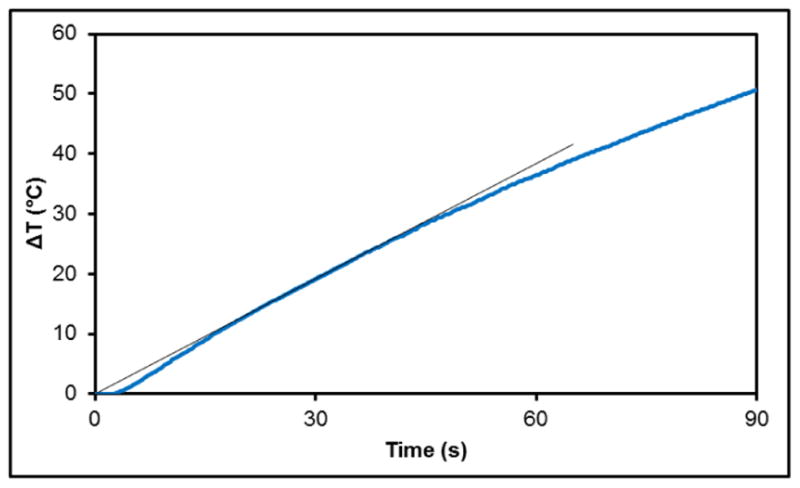
ΔT heating profile uncoated iron oxide a nanoparticle where starting temperature was room temperature. The tangent line indicated the slope used in the SAR calculations.
| Equation 1 |
where Ci is the heat capacity, mi is the individual mass of the components heated (in this case water and iron oxide nanoparticles), m is the mass of the component generating heat (iron oxide), and ΔT/Δt is the initial slope of the heating profile (the 25 and 35 second time points were used to calculate the slope). Calculations were based on specific heat capacities of 0.65 and 4.18 J/g*K for iron oxide and water respectively. The SAR value was determined to be 535.5 ± 25.8 W/g at an AMF of approximately 60 kA/m in strength at 292 kHz frequency.
3.2 Methylene blue degradation
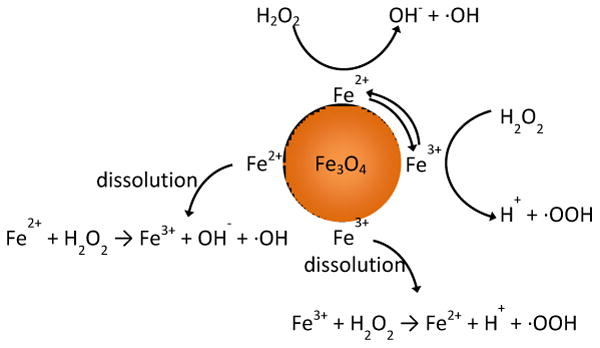
The rate of radical generation was determined by analyzing the rate of methylene blue degradation. In a Fenton-like system, as illustrated in scheme 2, iron ions react with hydrogen peroxide to generate highly reactive hydroxyl and superoxide radicals. These radicals attack bonds on methylene blue fracturing the molecule into colorless intermediates. Possible splitting sites include the C-S+=C and the C-N=C of the central ring or hydroxylation of the aromatic side rings.32, 33 It was determined that the degradation of methylene blue was catalyst driven, as there were negligible effects of hydrogen peroxide alone or adsorption onto the nanoparticle surface on measured absorbance.
Scheme 2. Diagram of potential Fenton/Haber Weiss reactions initiated by iron oxide nanoparticles.
The kinetic data was initially fit to a pseudo-first-order and second-order models as explored previously in literature.34, 35 Relating concentration as a function of relative absorbance, we had the following rate models:
| Equation 2 |
| Equation 3 |
Where k1 and k2 are the first and second order rate constants, and At is the measured absorbance at a given time normalized to the initial absorbance, Ao. Integrating equations 2 and 3 results in the following:
| Equation 4 |
| Equation 5 |
The methylene blue degradation data was fit using the above equations to determine the respective rate constants using a linear regression. The pseudo-first-order model was rejected because the y-intercept never approached 0 for any of the concentrations or temperatures tested. The second-order model, seen in Figure 2, fit the methylene blue degradation as observed previously.35 The linear correlation coefficients (R2) were in the neighborhood of 0.95 again confirming the accuracy of the linear model.
Figure 2.
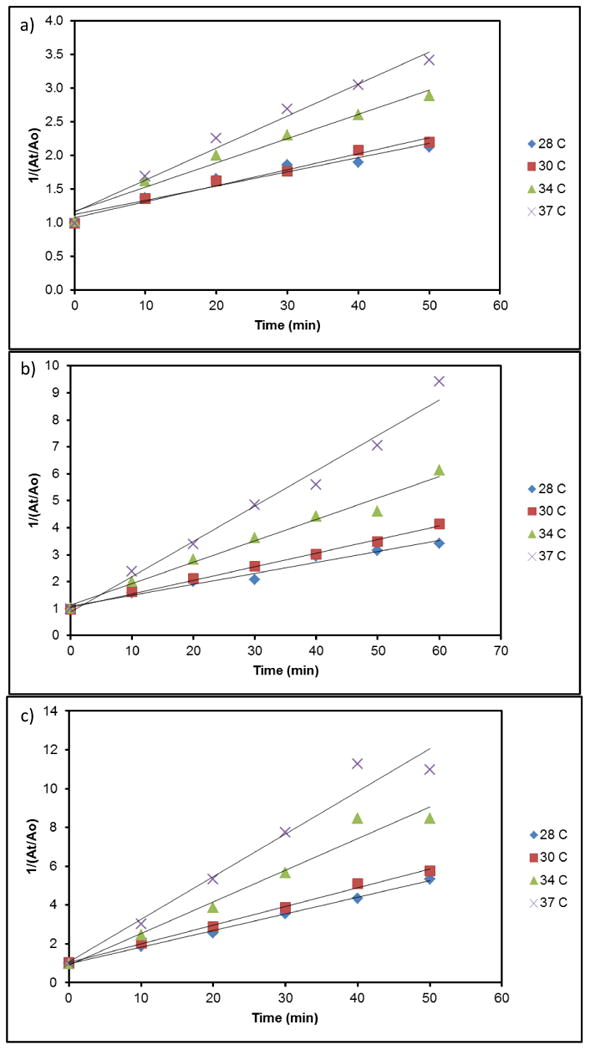
Second-order kinetic plots of methylene blue degradation at 37.5 μg/ml (a), 75 μg/ml (b), and 150 μg/ml (c) iron oxide concentration.
By studying methylene blue degradation at various temperatures, an Arrhenius type relationship was determined. Based on the slopes observed in figure 2 the reaction was temperature dependent where there was an increase in reaction with increased temperature as expected by Fenton-like chemistry. Using the Arrhenius equation:
| Equation 6 |
where A is the pre-exponential factor, Ea is the activation energy, R is the ideal gas constant, and T is the reaction temperature. Converting equation 6 into a linear relationship between ln(k) and 1/T, the previously determined reaction rates were plotted into figure 3. The derived activation energy and pre-exponential factor are listed in table 2 for the given concentration of iron oxide studied.
Figure 3.
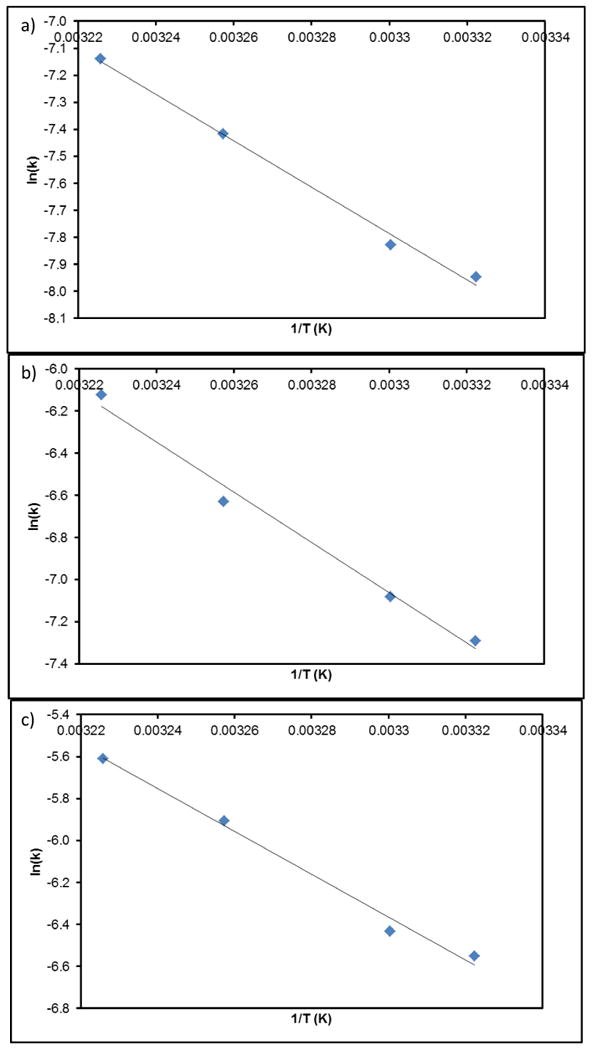
Arrhenius plots derived from second order kinetic model from methylene blue degradation at 37.5 μg/ml (a), 75 μg/ml (b), and 150 μg/ml (c) iron oxide concentration.
Deriving an Arrhenius relationship was essential to provide a comparative basis for the AMF studies. The three iron oxide concentrations studied were selected based on their ability to heat the surrounding media. When the AMF source is activated, the copper coil heats instantaneous and begins to radiate heat to the sample. At the AMF field amplitude used, a solution of methylene blue would heat to 32-32.5 °C. At 37.5 μg/ml iron oxide concentration, the measured solution temperature never exceeded this range with 15 minutes of heating. This implies that the amount of heat generated from the nanoparticle surface is insufficient to significantly heat the surrounding volume of water. At 75 μg/ml iron oxide, the measured solution temperature was 33.5-34 °C, and at 150 μg/ml, the measured temperature was 36-36.5 °C resulting in a 1.5 and 4 °C temperature rise respectively. At these concentrations the heat generated from the nanoparticle surface actively heated the solution temperature. From the measured steady state temperature of each sample, a theoretical concentration was calculated using the Arrhenius relationship. This value was compared to the experimentally measured absorbance through the following enhancement factor (EF) equation:
| Equation 7 |
Where (At/Ao)exp is the experimental concentration and (At/Ao)theo is the theoretical concentration of methylene blue. The enhancement factor results are displayed in figure 4. The lowest concentration, 37.5 μg/ml, displayed very significant ROS enhancement over the three time periods studied. At 5 minutes of exposure, 75 μg/ml was significant, but the enhancement decreased to no measurable enhancement by 15 minutes. The highest concentration never displayed a significant enhancement.
Figure 4.
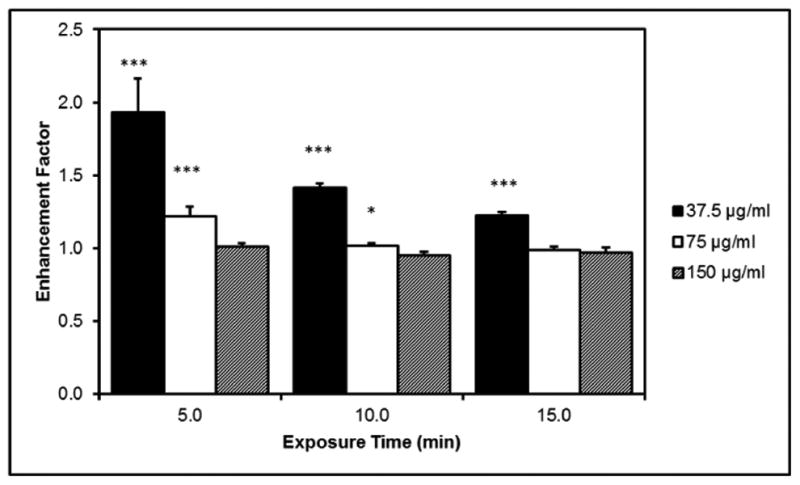
Enhancement factor comparing extent of methylene blue degradation based on experimental and theoretical values at different concentrations of iron oxide nanoparticles and length of AMF exposure.
At the lower concentrations of nanoparticles, the local nanoscale heating effects would be more pronounced than at the highest concentration. At these concentrations, energy would be dispersed to the local area driving the catalytic degradation of methylene blue. This energy, however, is insufficient to heat the surrounding volume resulting in no measurable temperature rise. Thus, we would expect the kinetic behavior to be similar to the temperature elevated a few degrees resulting in the observed enhancement. At the highest concentration the measured temperature corresponds closer the local surface temperature and hence no enhancement.
When enhancement was observed, the degree of enhancement declined with length of AMF exposure. One possible explanation is the reversible agglomeration of the nanoparticles induced by the magnetic field. Being paramagnetic, the nanoparticles would be attracted to each other resulting in aligned chains or clusters.36, 37 In this agglomerated state, the available surface area of the nanoparticles would be reduced affecting the catalyst potential. This further confirms a recent observation made by Sharma et al. where the degree of cellular oxidative stress was a function of iron oxide nanoparticle surface area as opposed to mass delivered.38 Nanoparticle concentration is one of the hallmark factors of colloidal stability and could explain why no enhancement was observed at the highest concentration. Elevated concentrations of magnetic nanoparticles display observable changes in colloidal stability when exposed to the AMF. While not significant, the enhancement factor of the 150 μg/ml system was below 1 at the 10 and 15 minute exposure times. Future experiments investigating the role of aggregation state on the magnetic field heating enhancement factor are warranted.
This study provides a direct example of utilizing the accelerated surface reactivity with AMF exposure for the degradation of a model pollutant. When translating this material property to a biological system such as within the cellular environment, however, there is room for scholarly debate. For starters, the intracellular concentration of H2O2 is typically around 0.5-0.7 μM but can be as high as 1 μM during proliferation signaling.39 Cancer cells are known to have higher levels of H2O2 due to erratic signaling, so the intracellular level could conceivably be even higher than 1 μM, but these levels are significantly lower than the levels used in this study. With the decrease in relative concentrations of reactants, the reaction rates would predictably be slower. Most cancer cells display an overexpression of Akt which causes them to be more susceptible to oxidative stress induced apoptosis.40 Thus, even acute fluctuations of ROS levels from iron oxide catalyzed Fenton chemistry could have a detrimental effect on cancer cells. Here in the best case, we have demonstrated upwards of a two fold increase in ROS generation with AMF exposure. Future research should investigate whether this ROS generation corresponds with an effective concentration of iron oxide nanoparticles triggering a cytotoxic event.
4. Conclusions
This study reports the observed enhanced degradation of methylene blue by free radicals generated by iron oxide nanoparticles heated in an alternating magnetic field. The kinetic behavior of methylene blue degradation was modeled using a second-order reaction, and an Arrhenius relationship was extrapolated from the temperature dependence. When exposed to an alternating magnetic field, the nanoparticles at lower concentrations and exposure time are capable of degrading methylene blue at a greater extent than predicted by the Arrhenius relationship. This observation has multiple future applications, such as improving intracellular hyperthermia processes and reaction rates in advanced oxidation processes.
Scheme 1. Molecular structure of methylene blue.
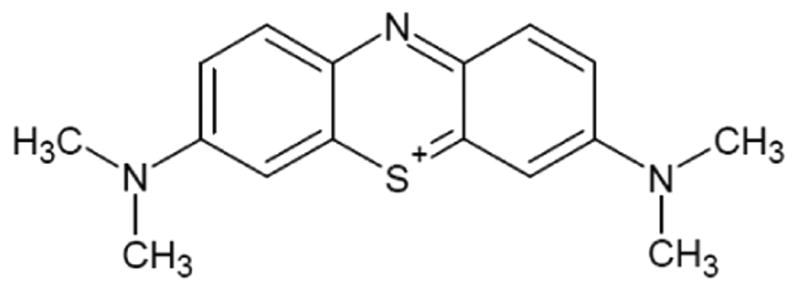
Table 1.
Arrhenius constants of methylene blue degradation at various concentrations of iron oxide nanoparticles.
| Concentration | -Ea (J/mol) | A (s-1) |
|---|---|---|
| 37.5 μg/ml | 7.15e4 | 8.79e8 |
| 75 μg/ml | 9.91e4 | 1.05e14 |
| 150 μg/ml | 8.48e4 | 7.27e11 |
Acknowledgments
RW acknowledges the financial support from a NCI-CNTC pre-doctoral traineeship and the project described was supported by Grant Number R25CA153954 from the National Cancer Institute. The content is solely the responsibility of the authors and does not necessarily represent the official views of the National Cancer Institute or the National Institutes of Health. CO acknowledges the financial support by the NSF REU Grant Number EEC-1156667 from the National Science Foundation.
References
- 1.Frimpong RA, Hilt JZ. Nanomedicine. 2010;5:1401–1414. doi: 10.2217/nnm.10.114. [DOI] [PubMed] [Google Scholar]
- 2.Berry CC. J Phys D-Appl Phys. 2009;42:9. [Google Scholar]
- 3.Dhakshinamoorthy A, Navalon S, Alvaro M, Garcia H. ChemSusChem. 2012;5:46–64. doi: 10.1002/cssc.201100517. [DOI] [PubMed] [Google Scholar]
- 4.Krishnan KM. IEEE Trans Magn. 2010;46:2523–2558. doi: 10.1109/TMAG.2010.2046907. [DOI] [PMC free article] [PubMed] [Google Scholar]
- 5.McCormack PL. Drugs. 2012;72:2013–2022. doi: 10.2165/11209880-000000000-00000. [DOI] [PubMed] [Google Scholar]
- 6.Yallapu MM, Othman SF, Curtis ET, Gupta BK, Jaggi M, Chauhan SC. Biomaterials. 2011;32:1890–1905. doi: 10.1016/j.biomaterials.2010.11.028. [DOI] [PMC free article] [PubMed] [Google Scholar]
- 7.Wydra RJ, Kruse AM, Bae Y, Anderson KW, Hilt JZ. Mater Sci Eng C-Mater Biol Appl. 2013;33:4660–4666. doi: 10.1016/j.msec.2013.07.019. [DOI] [PubMed] [Google Scholar]
- 8.Hilger I, Dietmar E, Linss W, Streck S, Kaiser WA. Journal of Physics-Condensed Matter. 2006;18:S2951–S2958. [Google Scholar]
- 9.Ursachi I, Stancu A, Vasile A. J Colloid Interface Sci. 2012;377:184–190. doi: 10.1016/j.jcis.2012.03.066. [DOI] [PubMed] [Google Scholar]
- 10.Cochran DB, Wattamwar PP, Wydra R, Hilt JZ, Anderson KW, Eitel RE, Dziubla TD. Biomaterials. 2013;34:9615–9622. doi: 10.1016/j.biomaterials.2013.08.025. [DOI] [PubMed] [Google Scholar]
- 11.Naqvi S, Samim M, Abdin MZ, Ahmed FJ, Maitra AN, Prashant CK, Dinda AK. Int J Nanomed. 2010;5:983–989. doi: 10.2147/IJN.S13244. [DOI] [PMC free article] [PubMed] [Google Scholar] [Retracted]
- 12.Stroh A, Zimmer C, Gutzeit C, Jakstadt M, Marschinke F, Jung T, Pilgrimm H, Grune T. Free Radic Biol Med. 2004;36:976–984. doi: 10.1016/j.freeradbiomed.2004.01.016. [DOI] [PubMed] [Google Scholar]
- 13.Malvindi MA, De Matteis V, Galeone A, Brunetti V, Anyfantis GC, Athanassiou A, Cingolani R, Pompa PP. PLoS One. 2014:9. [Google Scholar]
- 14.Mahmoudi M, Hofmann H, Rothen-Rutishauser B, Petri-Fink A. Chemical Reviews. 2012;112:2323–2338. doi: 10.1021/cr2002596. [DOI] [PubMed] [Google Scholar]
- 15.van den Bos EJ, Wagner A, Mahrholdt H, Thompson RB, Morimoto Y, Sutton BS, Judd RM, Taylor DA. Cell Transplant. 2003;12:743–756. doi: 10.3727/000000003108747352. [DOI] [PubMed] [Google Scholar]
- 16.Yu M, Huang SH, Yu KJ, Clyne AM. Int J Mol Sci. 2012;13:5554–5570. doi: 10.3390/ijms13055554. [DOI] [PMC free article] [PubMed] [Google Scholar]
- 17.Pignatello JJ, Oliveros E, MacKay A. Crit Rev Environ Sci Technol. 2006;36:1–84. [Google Scholar]
- 18.Voinov MA, Pagan JOS, Morrison E, Smirnova TI, Smirnov AI. J Am Chem Soc. 2011;133:35–41. doi: 10.1021/ja104683w. [DOI] [PubMed] [Google Scholar]
- 19.Wang B, Yin JJ, Zhou XY, Kurash I, Chai ZF, Zhao YL, Feng WY. J Phys Chem C. 2013;117:383–392. [Google Scholar]
- 20.Rosensweig RE. J Magn Magn Mater. 2002;252:370–374. [Google Scholar]
- 21.Jordan A, Scholz R, Wust P, Fahling H, Felix R. J Magn Magn Mater. 1999;201:413–419. [Google Scholar]
- 22.Moroz P, Jones SK, Gray BN. Int J Hyperthermia. 2002;18:267–284. doi: 10.1080/02656730110108785. [DOI] [PubMed] [Google Scholar]
- 23.Rabin Y. Int J Hyperthermia. 2002;18:194–202. doi: 10.1080/02656730110116713. [DOI] [PubMed] [Google Scholar]
- 24.Creixell M, Bohorquez AC, Torres-Lugo M, Rinaldi C. ACS Nano. 2011;5:7124–7129. doi: 10.1021/nn201822b. [DOI] [PubMed] [Google Scholar]
- 25.Polo-Corrales L, Rinaldi C. J Appl Phys. 2012;111:3. [Google Scholar]
- 26.Melgoza D, Hernandez-Ramirez A, Peralta-Hernandez JM. Photochem Photobiol Sci. 2009;8:596–599. doi: 10.1039/b817287k. [DOI] [PubMed] [Google Scholar]
- 27.Chan KH, Chu W. Chemosphere. 2003;51:305–311. doi: 10.1016/S0045-6535(02)00812-3. [DOI] [PubMed] [Google Scholar]
- 28.Chu W, Chan KH, Kwan CY, Choi KY. Chemosphere. 2007;67:755–761. doi: 10.1016/j.chemosphere.2006.10.039. [DOI] [PubMed] [Google Scholar]
- 29.Zhang SX, Zhao XL, Niu HY, Shi YL, Cai YQ, Jiang GB. J Hazard Mater. 2009;167:560–566. doi: 10.1016/j.jhazmat.2009.01.024. [DOI] [PubMed] [Google Scholar]
- 30.Ghosh P, Kumar C, Samanta AN, Ray S. Journal of Chemical Technology and Biotechnology. 2012;87:914–923. [Google Scholar]
- 31.Frimpong RA, Dou J, Pechan M, Hilt JZ. J Magn Magn Mater. 2010;322:326–331. [Google Scholar]
- 32.de Souza WF, Guimaraes IR, Guerreiro MC, Oliveira LCA. Appl Catal A-Gen. 2009;360:205–209. [Google Scholar]
- 33.Zhang J, Hu FT, Liu QQ, Zhao X, Liu SQ. React Kinet Mech Catal. 2011;103:299–310. [Google Scholar]
- 34.Hsieh SC, Lin PY. J Nanopart Res. 2012:14. [Google Scholar]
- 35.Shahwan T, Abu Sirriah S, Nairat M, Boyaci E, Eroglu AE, Scott TB, Hallam KR. Chem Eng J. 2011;172:258–266. [Google Scholar]
- 36.Biswal SL, Gast AP. Anal Chem. 2004;76:6448–6455. doi: 10.1021/ac0494580. [DOI] [PubMed] [Google Scholar]
- 37.Byrom J, Biswal SL. Soft Matter. 2013;9:9167–9173. [Google Scholar]
- 38.Sharma G, Kodali V, Gaffrey M, Wang W, Minard KR, Karin NJ, Teeguarden JG, Thrall BD. Nanotoxicology. 2014;8:663–675. doi: 10.3109/17435390.2013.822115. [DOI] [PMC free article] [PubMed] [Google Scholar]
- 39.Stone JR, Yang SP. Antioxid Redox Signal. 2006;8:243–270. doi: 10.1089/ars.2006.8.243. [DOI] [PubMed] [Google Scholar]
- 40.Nogueira V, Park Y, Chen CC, Xu PZ, Chen ML, Tonic I, Unterman T, Hay N. Cancer Cell. 2008;14:458–470. doi: 10.1016/j.ccr.2008.11.003. [DOI] [PMC free article] [PubMed] [Google Scholar]


