Müller and Mitra’s contribution regarding the practical whys and hows of non-parametric Bayes (NPB) is welcome. In that spirit, we highlight one basic and one complex social science example for which NPB is uniquely well-suited.
Depression symptoms scores were collected from n = 299 clients on three occasions – pre-treatment, post-treatment, and follow-up – during a study of group therapy’s effectiveness for treating depression. Clients completed up to four group therapy modules and could join the therapy group at start of a module. Therapy group-induced correlations among client outcomes could thus be modeled using random module effects, which would be linked to post-treatment outcomes via multiple membership, and client-specific growth parameters (e.g., random intercept, time, and quadratic time effects) could be specified for modeling within-client correlations and deviations from the average depression score trajectory (Paddock and Savitsky 2013).
Basic use of NPB for a very common analytic problem
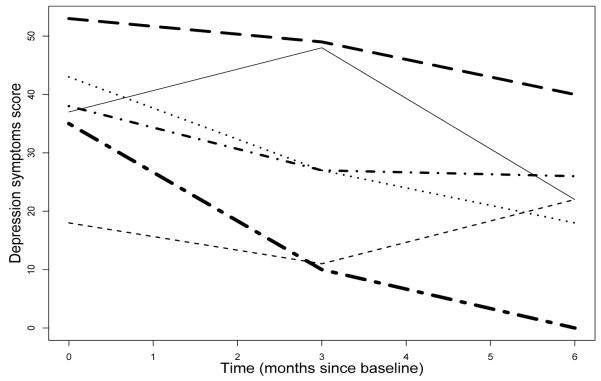
Randomly-sampled depression score trajectories for six clients show convex and concave patterns (Figure 1), so including quadratic time effects in the model seems appropriate. However, for model identifiability, conventional parametric growth curve modeling requires d + 2 repeated observations for a polynomial trajectory of degree d (Bollen and Curran 2006). Ad-hoc parameter constraints would thus be required, such as assuming the quadratic time client random effect variance is 0 or setting variance terms equal to a constant (Little et al. 2006), or imposing identifiability through the prior.
Figure 1.
Depression symptoms scores for six randomly-selected clients at 0, 3, and 6 months post-baseline
Paddock and Savitsky (2013) avoid making ad-hoc constraints by modeling the client growth parameters using a Dirichlet process (DP). The positive probability of ties under DP facilitates a useful parameter dimension reduction, providing a compromise between assuming one trajectory applies equally well to everyone versus having n distinct trajectories for all clients arising from a parametric distribution. There were about 10 unique sets, or clusters, of growth parameters at each MCMC iteration in Paddock and Savitsky (2013). By ‘letting the data speak’ about which patterns existed in the data, the DP approach captured both convex and concave growth curves, whereas the parametric approach only captured concave curves. DP is particularly promising for such longitudinal intervention studies, considering such typically small numbers of observations per client. Example 6 of Müller and Mitra’s paper has similar features - e.g., three random effects and three observations per tripeptide/tissue pair. We would be interested in the authors’ comments on whether and how such dimension reduction played a role in the parametric empirical Bayes versus semiparametric comparison.
More complex example
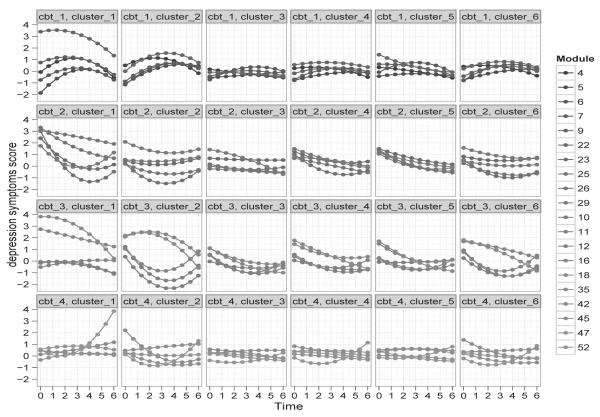
Paddock and Savitsky’s (2013) model would constrain module random effects to be constant over time, not allowing for changes in correlations among outcomes for clients who attend modules together. However, client outcomes might be more strongly correlated at different time points, such as immediately following group therapy versus at baseline or follow-up. Not all clients benefit similarly from group therapy (Smokowski et al. 2001); module effects might change over time and the effects of modules on participant outcome trajectories may vary across study participants. Savitsky and Paddock (to appear)’s dependent Dirichlet process (DDP) model for repeated measures multiple membership data accounts for this and improves model fit. A set of random distributions for client random effect parameters is indexed by therapy group module attendance sequences. Figure 1 illustrates the heterogeneity in the relative effectiveness of group therapy modules. There are clusters of clients whose outcome trajectories vary across modules. Uncovering this variation motivates future research to understand why such variation exists and for whom do module effects vary. Savitsky and Paddock (to appear) found that a parametric additive model alternative for both module and client effects that allowed for time variation failed to capture this heterogeneity.
Figure 2.
DDP model output. Each curve represents the posterior mean of client depression symptoms score trajectories for a randomly selected module. Each row represents one of four distinct therapy groups in the study (cbt 1, … , cbt 4). The six columns correspond to the largest clusters of clients (from largest to smallest).
Acknowledgments
Supported by NIH/NIAAA Grant R01AA019663
References
- Bollen K, Curran P. Latent curve models: A structural equation approach. Wiley; Hoboken, NJ: 2006. [Google Scholar]
- Little T, Bovaird J, Slegers D. Methods for the Analysis of Change. In: Mroczek D, Little T, editors. Handbook of Personality Development. Erlbaum; Mahwah, NJ: 2006. pp. 181–211. [Google Scholar]
- Paddock SM, Savitsky TD. Bayesian Hierarchical Semiparametric Modeling of Longitudinal Post-treatment Outcomes from Open-enrollment Therapy Groups. Journal of the Royal Statistical Society, Series A: Statistics in Society. 2013;176(3) doi: 10.1111/j.1467-985X.2012.12002.x. to appear. [DOI] [PMC free article] [PubMed] [Google Scholar]
- Savitsky T, Paddock S. Bayesian Non-Parametric Hierarchical Modeling for Multiple Membership Data in Grouped Attendance Interventions. Annals of Applied Statistics. doi: 10.1214/12-AOAS620. (to appear) [DOI] [PMC free article] [PubMed] [Google Scholar]
- Smokowski P, Rose S, Bacallao M. Damaging experiences in therapeutic groups: How vulnerable consumers become group casualties. Small Group Research. 2001;32(2):223–251. [Google Scholar]


