

Abstract
Introduction
A step-up strategy for dipeptidyl peptidase (DPP)-4 inhibitor-based regimens has not yet been established. In addition, similarities and differences between DPP-4 inhibitors and glucagon-like peptide (GLP)-1 receptor agonists remain to be elucidated in humans. We investigated the pleiotropic effects of vildagliptin vs liraglutide in patients with type 2 diabetes on sitagliptin-based regimens in an open-label, randomized, clinical trial.
Materials and Methods
A total of 122 patients with type 2 diabetes that was inadequately controlled by sitagliptin-based regimens were randomly assigned to either vildagliptin (50 mg, twice daily) or liraglutide treatment (0.9 mg, once daily) for 12 weeks. The primary outcomes were glycated hemoglobin and body mass index.
Results
Both vildagliptin and liraglutide significantly lowered glycated hemoglobin within 12 weeks after switching from sitagliptin, but liraglutide produced a greater reduction (−0.67 ± 0.12% vs −0.36 ± 0.53%). Liraglutide lowered body mass index, whereas vildagliptin did not affect body mass index. Vildagliptin lowered fasting C-peptide immunoreactivity, but liraglutide did not. Vildagliptin increased serum levels of adiponectin, arachidonic acid, eicosapentaenoic acid and docosahexaenoic acid, whereas liraglutide had no effect on these levels. Quality of life, assessed using the diabetes treatment satisfaction questionnaire, was not impaired in either group. The most common adverse events were gastrointestinal symptoms, which occurred with similar frequencies in both groups.
Conclusions
Vildagliptin-mediated improvements in glycemic control did not correlate with indices for insulin secretion and insulin sensitivity. Switching from sitagliptin to liraglutide is useful in managing hyperglycemia and weight. Each agent exerts unique pleiotropic effects. This trial was registered with the University Hospital Medical Information Network Clinical Trials Registry (no. 000004953).
Keywords: Dipeptidyl peptidase-4 inhibitor, Glucagon-like peptide-1 receptor agonists, Pleiotropic effects
Introduction
Recent large-scale clinical trials have suggested that intensive antidiabetic therapies that cause unnecessary hyperinsulinemia do not achieve satisfactory cardiovascular outcomes in people with type 2 diabetes, possibly causing hypoglycemia and weight gain1. One possible solution for this paradox came from the launch of incretin-based agents, because agents of this class avoid unnecessary hyperinsulinemia, and thereby avoid hypoglycemia and weight gain. Incretin-based therapy consists of two drug classes: dipeptidyl peptidase (DPP)-4 inhibitors, which prevent enzymatic inactivation of endogenous glucagon-like peptide (GLP)-1; and GLP-1 receptor agonists, which have biological activity similar to GLP-1, but are resistant to DPP-42. Incretin-related agents have generally been accepted as second- or third-line therapy for first-line metformin therapy3. Furthermore, incretin-based therapy is thought to be more effective for type 2 diabetes in Asian people than in Caucasian people4. To date, a step-up strategy from DPP-4 inhibitor-based regimens has not yet established in Asian people with type 2 diabetes, especially with the aim to avoid hypoglycemia and weight gain as a result of unnecessary hyperinsulinemia. In this regard, strong DPP-4 inhibitors or GLP-1 receptor agonists are the candidates of choice. In a head-to-head comparison study, liraglutide was superior to sitagliptin in reducing glycated hemoglobin (HbA1c) and weight5. Beyond a class effect, which DPP-4 inhibitor is most effective at lowering HbA1c remains controversial6,7. However, greater reductions in HbA1c and fasting plasma glucose level (FPG) were found with vildagliptin compared with the other DPP-4 inhibitors in meta-analysis and systematic review7. Based on these observations, we hypothesized that vildagliptin and liraglutide are beneficial in managing hyperglycemia and weight when switched from sitagliptin. The present study was designed to compare the efficacy of vildagliptin and liraglutide in Japanese patients with type 2 diabetes who are inadequately controlled with sitagliptin-based therapy. We also aimed to clarify the similarities, differences, and pleiotropic effects of GLP-1 receptor agonists and DPP-4 inhibitors in the treatment of type 2 diabetes.
Materials and Methods
Overview
This was a randomized parallel-group study carried out in Japanese patients. It was designed in accordance with the principles of the Declaration of Helsinki, and the protocol was reviewed and approved by the institutional review board of each study site. Patients provided written informed consent before participation.
A total of 122 patients with type 2 diabetes who did not achieve adequate glycemic control with sitagliptin-based regimens (HbA1c >6.9%) were recruited at the Division of Endocrinology and Metabolism, Kanazawa University Hospital between January 2011 and February 2012. Type 2 diabetes was diagnosed according to World Health Organization criteria, based on a 2-h plasma glucose value of >11.1 mmol/L8. This trial was registered with the University Hospital Medical Information Network Clinical Trials Registry (no. 000004953).
Patient Eligibility
Eligible participants were aged 20–80 years, had type 2 diabetes mellitus, had moderately controlled diabetes with a change in HbA1c of <3% within 12 weeks before screening and had been treated with sitagliptin (50 mg, once daily) for 3 months or longer. Exclusion criteria were as follows: (i) hypersensitivity or contraindication to vildagliptin or liraglutide; (ii) history of type 1 diabetes or history of ketoacidosis; (iii) repeated episodes of unexplained hypoglycemia, as defined by a FPG <60 mg/dL, with or without symptoms of hypoglycemia; (iv) concomitant infection or planned surgery; (v) treatment with vildagliptin or liraglutide within 12 weeks before screening; (vi) concomitant corticosteroid therapy; (vii) poorly controlled diabetes (states of hyperglycemic hyperosmolar syndrome and diabetic ketoacidosis); (viii) dialysis and serum creatinine >2.5 mg/dL in men or >2.0 mg/dL in women; (ix) alanine aminotransferase (ALT) and/or aspartate aminotransferase (AST) >2.5-fold above the upper limit of the normal range; (x) poorly controlled hypertension, systolic blood pressure >160 mmHg or diastolic blood pressure >100 mmHg; (xi) current and/or previous heart failure; (xii) severe retinopathy; (xiii) malignancy on an active therapeutic regimen or without complete remission or cure; (xiv) pregnancy or breast-feeding; and (xv) inability to participate in the study (psychiatric status or psychosocial status) as assessed by the investigators.
Efficacy End-Points
A computer-generated randomization sequence assigned participants in a 1:1 ratio to treatment with vildagliptin or liraglutide. Dynamic randomization was used to adjust for demographic differences (age, sex, prestudy antidiabetic treatment combined with sitagliptin, and HbA1c) between the treatment groups. In this active-comparator, parallel-group trial, eligible participants switched from sitagliptin to vildagliptin or liraglutide, and received each treatment for 12 weeks. Vildagliptin (Novartis Pharma AG, Basel, Switzerland) was started and maintained at 100 mg daily (50 mg in the morning and 50 mg in the evening). Liraglutide (Novo Nordisk, Bagsværd, Denmark), injected subcutaneously with a pen device, was started at 0.3 mg/day, and escalated by 0.3 mg/3 days to 0.9 mg/day (maximum allowable dosage in Japan).
A total of 25 participants were required in each group to achieve 83.8% of power to detect a difference of 0.51% in HbA1c (standard deviation of 0.6% and a two-sample one-sided alpha of 0.05), and 90.9% of power to detect a difference of 1.9 kg in bodyweight (standard deviation of 2.0 and a two-sample one-sided alpha of 0.05). With the assumption of a 50% dropout rate, we enrolled 122 patients (60 per arm).
The primary efficacy end-point was the change from baseline in HbA1c and body mass index (BMI) at week 12. Secondary end-points recorded at baseline and week 12 were: fasting plasma glucose; laboratory evaluations, including hematology, serum chemistry, blood 1,5-anhydroglucitol (1,5-AG), fasting serum insulin (IRI), C-peptide immunoreactivity (CPR), fasting lipid profile including small dense low-density lipoprotein (sdLDL), adiponectin, tumor necrosis factor (TNF)-α, leptin; urinary 8-hydroxy-deoxyguanosine (U-8OHdG) excretion; blood pressure; and physical measures (waist circumference and bodyweight). Urinary albumin (U-Alb) levels were measured by immunoturbidimetry and adjusted using urinary creatinine. CPR index (CPI) was calculated as (100 × fasting CPR [ng/mL])/(18 × FPG [mmol/L])9. The homeostasis model assessment of insulin resistance (HOMA-IR)10 was used as a conventional index for insulin resistance, and was calculated as (fasting insulin [U/mL] × FPG [mmol/L])/22.5. Also, regarding limitations of HOMA-IR when the FPG is above 140 mg/dL, we additionally calculated a parameter of insulin sensitivity quantitative insulin sensitivity check index (QUICKI), which reflects insulin sensitivity even under hyperglycemic conditions. QUICKI was calculated using the logarithmic transformation: 1/(log fasting insulin [U/mL] + log fasting glucose [mg/dL]). To assess basic insulin secretion by β-cells, homeostasis model assessment-β (HOMA-β) was calculated as fasting insulin × 20/(fasting glucose−63)10.
Serum fatty acid levels were measured as a secondary outcome. A serum sample (approximately 0.2 mL) and 2 mL of chloroform-methanol (2:1) was placed in a Pyrex centrifuge tube, homogenized with a Polytron homogenizer (PCU-2-110; KINEMATICA GmbH, Steinhofhale, Switzerland), and then centrifuged at 80 g for 10 min. An aliquot of the chloroform-methanol extract was transferred to another Pyrex tube and dried under a stream of nitrogen gas. The dried sample was dissolved in 100 μL of 0.4 mol/L potassium methoxide methanol/14% boron trifluoride-methanol solution, and the fatty acid concentrations were measured at SRL Inc. with a gas chromatograph (Shimizu GC 17A, Kyoto, Japan).
Treatment satisfaction was another secondary outcome, and was assessed at baseline and at the end of the study using the diabetes treatment satisfaction questionnaire (DTSQ)11–13. The overall treatment satisfaction score was calculated as the sum of DTSQ items 1 (Satisfaction), 4 (Convenience), 5 (Flexibility), 6 (Understanding), 7 (Recommend to others) and 8 (Wish to continue). Items 2 (Perceived hyperglycemia frequency) and 3 (Perceived hypoglycemia frequency) were treated as separate variables. The quality of life instrument was not designed to measure treatment satisfaction related to the device.
Adverse experiences were monitored throughout the study, and were rated by investigators for intensity and relationship to the study drug. Adverse experiences with an onset date of up to 2 weeks after concluding treatment were assessed in person.
Statistical Analysis
Two analyses were carried out. In the intention-to-treat analysis (Table S1), measures that were missing for participants who discontinued the study were replaced with baseline measures. In the second analysis, only data from participants who completed the study (through the 12-week follow-up period) were included. We carried out a completed case analysis rather than an intention-to-treat analysis, because there were few dropouts, and their reasons for dropping out were unrelated to baseline values or responses.
The data are expressed as means ± standard deviation, unless otherwise indicated. The Statistical Package for the Social Sciences (version 11.0; SPSS, Inc., Chicago, IL, USA) was used for the statistical analyses. For univariate analyses between the patient groups, Student's t-test or the Mann–Whitney U-test was used, as appropriate. Values of P < 0.05 showed significance.
Results
Baseline Metabolic Parameters
Patients were recruited between January 2011 and February 2012, with follow up continuing for 12 weeks thereafter. A total of 122 patients who consented to participate in the study were screened (Figure1). The mean age of the patients was 64.7 ± 12.4 years, and mean BMI was 24.7 ± 5.2 kg/m2. FPG, HbA1c, and CPR levels were 166.6 ± 49.2 mg/dL, 8.0 ± 1.5% and 1.8 ± 1.1 ng/mL, respectively. The patients were randomized into two treatment groups (a liraglutide group and a vildagliptin group), which were generally well balanced with respect to baseline demographics and disease characteristics. Of the 122 patients enrolled in the study, five dropped out after randomization and before the intervention (Figure1). All of the patients analyzed were finally administered with 0.9 mg of liraglutide, and took more than 80% compliance of study medication. A total of 53 of 58 patients assigned to vildagliptin, and 49 of 54 assigned to liraglutide achieved 100% compliance of the study medication in the present study.
Figure 1.
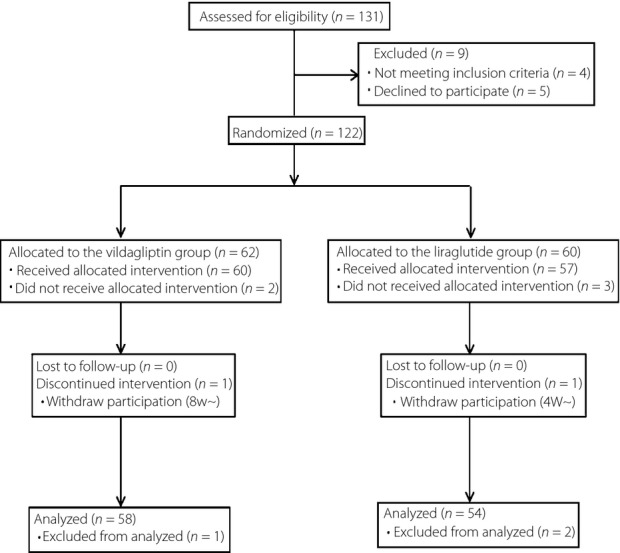
Flow diagram.
Clinical Outcomes
Compared with baseline values, FPG and HbA1c levels were significantly decreased in both groups at the end of the study (Table1). Both liraglutide and vildagliptin significantly lowered HbA1c within 12 weeks after switching from sitagliptin, but the decrease in HbA1c was greater in the liraglutide group than in the vildagliptin group (−0.67 ± 0.12% vs −0.36 ± 0.53%). Liraglutide significantly lowered the BMI from 25.4 ± 4.8 to 24.3 ± 5.8 kg/m2 (P = 0.018), whereas vildagliptin did not affect the BMI. Both liraglutide and vildagliptin significantly lowered FPG within 12 weeks after switching from sitagliptin. Vildagliptin lowered the IRI (from 6.9 ± 7.4 to 4.9 ± 3.6 IU/L, P = 0.044) and CPR (from 1.9 ± 1.2 to 1.5 ± 0.7 ng/mL, P = 0.024), whereas liraglutide did not affect either factor. Vildagliptin increased the serum level of adiponectin from 3.6 ± 2.5 to 4.1 ± 2.7 (P = 0.000); liraglutide had no effect on serum adiponectin levels. Vildagliptin, but not liraglutide, significantly decreased HOMA-IR and increased QUICKI (Table1). However, as shown in Table S2, vildagliptin-mediated change in HbA1c did not correlate with both basal and changes in HOMA-IR and QUICKI, whereas vildagliptin significantly decreased HOMA-IR and increased QUICKI. Liraglutide significantly increased CPI and HOMA-β, whereas vildagliptin did not affect CPI or HOMA-β. At the end of the study, systolic blood pressure, blood urea nitrogen, AST, ALT, γGTP, ALP, TG, HDL-C, U-Alb, U-8OHdG, TNF-α and leptin levels were not changed significantly in either group.
Table 1.
Changes in the characteristics of patients between baseline and 12 weeks
| Vildagliptin | P * | Liraglutide | P * | P ** | |||
|---|---|---|---|---|---|---|---|
| Before | After | Before | After | ||||
| Male:female | 36:22 | 35:19 | |||||
| Prestudy antidiabetic treatment combined with sitagliptin (free/glimepiride/metformin/pioglitazone) | 12/25/30/2 | 12/25/29/1 | |||||
| Bodyweight (kg) | 63.2 ± 14.1 | 63.3 ± 13.9 | 0.694 | 65.8 ± 16.1 | 64.2 ± 16.2 | 0.000 | 0.000 |
| Body mass index (kg/m2) | 24.5 ± 4.6 | 24.2 ± 5.4 | 0.435 | 25.4 ± 4.8 | 24.3 ± 5.8 | 0.018 | 0.000 |
| Waist circumference (cm) | 90.0 ± 10.7 | 89.3 ± 10.4 | 0.061 | 91.1 ± 11.6 | 89.6 ± 12.0 | 0.006 | 0.229 |
| Systolic blood pressure (mmHg) | 130.3 ± 24.7 | 122.4 ± 29.1 | 0.055 | 133.3 ± 19.1 | 130.8 ± 26.5 | 0.448 | 0.360 |
| Fasting plasma glucose (mg/dL) | 169.5 ± 42.5 | 155.2 ± 45.8 | 0.010 | 161.4 ± 52.2 | 144.2 ± 45.0 | 0.016 | 0.736 |
| HbA1c (%) | 8.1 ± 1.2 | 7.8 ± 1.1 | 0.000 | 8.0 ± 0.9 | 7.3 ± 1.0 | 0.004 | 0.026 |
| 1,5-Anhydroglucitol (mg/mL) | 6.5 ± 5.3 | 6.9 ± 5.1 | 0.394 | 7.4 ± 5.6 | 10.7 ± 6.8 | 0.000 | 0.001 |
| BUN (mg/dL) | 15.9 ± 5.5 | 15.0 ± 4.9 | 0.117 | 15.6 ± 6.0 | 14.6 ± 5.6 | 0.280 | 0.739 |
| Cre (mg/dL) | 0.70 ± 0.22 | 0.67 ± 0.22 | 0.018 | 0.74 ± 0.22 | 0.75 ± 0.24 | 0.954 | 0.114 |
| Serum aspartate aminotransferase (IU/L) | 27.8 ± 17.7 | 33.6 ± 52.8 | 0.380 | 26.6 ± 14.9 | 30.5 ± 29.5 | 0.133 | 0.863 |
| Serum alanine aminotransferase (IU/L) | 30.2 ± 20.9 | 32.7 ± 35.4 | 0.579 | 30.1 ± 20.9 | 36.2 ± 39.6 | 0.141 | 0.557 |
| Plasma gamma-glutamyltransferase (IU/L) | 37.0 ± 29.5 | 37.1 ± 37.0 | 0.983 | 43.0 ± 49.4 | 50.4 ± 72.8 | 0.388 | 0.454 |
| Alkaline phosphatase (IU/L) | 226.6 ± 83.1 | 230.5 ± 92.8 | 0.132 | 213.5 ± 66.8 | 219.0 ± 11.9 | 0.570 | 0.499 |
| Total cholesterol (mg/dL) | 185.1 ± 32.8 | 183.8 ± 33.0 | 0.710 | 180.1 ± 34.0 | 168.9 ± 41.5 | 0.007 | 0.117 |
| Triglycerides (mg/dL) | 138.8 ± 101.5 | 125.6 ± 72.5 | 0.242 | 125.0 ± 80.6 | 114.8 ± 62.7 | 0.184 | 0.824 |
| HDLC (mg/dL) | 52.9 ± 17.0 | 52.5 ± 17.3 | 0.522 | 52.9 ± 14.1 | 53.0 ± 13.6 | 0.936 | 0.661 |
| sdLDL-C (mg/dL) | 36.2 ± 17.0 | 37.1 ± 15.9 | 0.568 | 35.1 ± 14.1 | 31.8 ± 13.4 | 0.021 | 0.042 |
| Fasting serum insulin (IU/L) | 6.9 ± 7.4 | 4.9 ± 3.6 | 0.044 | 6.0 ± 5.2 | 7.9 ± 10.3 | 0.162 | 0.020 |
| CPR (ng/mL) | 1.9 ± 1.2 | 1.5 ± 0.7 | 0.024 | 1.7 ± 0.9 | 1.9 ± 1.1 | 0.087 | 0.004 |
| U-Alb (mg/gCre) | 157.8 ± 514.1 | 117.4 ± 280.2 | 0.518 | 91.0 ± 173.4 | 160.8 ± 540.3 | 0.244 | 0.202 |
| U-8OHdG (ng/mgCre) | 11.5 ± 4.0 | 11.9 ± 4.0 | 0.449 | 11.5 ± 4.6 | 11.3 ± 5.9 | 0.657 | 0.681 |
| Adiponectin (μg/mL) | 3.6 ± 2.5 | 4.1 ± 2.7 | 0.000 | 3.8 ± 2.4 | 4.0 ± 2.4 | 0.210 | 0.859 |
| TNF-α (pg/mL) | 1.5 ± 1.0 | 1.6 ± 0.9 | 0.752 | 1.2 ± 0.5 | 1.3 ± 0.4 | 0.602 | 0.319 |
| Leptin (ng/mL) | 8.1 ± 6.9 | 8.1 ± 6.4 | 0.954 | 6.9 ± 5.7 | 7.2 ± 6.8 | 0.580 | 0.546 |
| QUICKI | 0.35 ± 0.05 | 0.36 ± 0.04 | 0.020 | 0.36 ± 0.05 | 0.36 ± 0.06 | 0.835 | 0.100 |
| HOMA-IR | 3.1 ± 4.0 | 1.9 ± 1.5 | 0.038 | 2.5 ± 2.7 | 2.9 ± 4.4 | 0.503 | 0.056 |
| CPI | 1.1 ± 0.6 | 1.1 ± 0.6 | 0.286 | 1.1 ± 0.6 | 1.4 ± 0.8 | 0.003 | 0.002 |
| HOMA-β | 25.5 ± 21.9 | 24.6 ± 22.5 | 0.724 | 25.5 ± 19.5 | 39.4 ± 49.8 | 0.029 | 0.029 |
Data are expressed as mean ± standard deviation.
P-value for the intragroup comparison (baseline vs 12 weeks);
P-value for the intergroup comparison (difference in changes from baseline between groups). BUN, blood urea nitrogen; CPI, C-peptide immunoreactivity index; CPR, C-peptide immunoreactivity; Cre, creatinine; HDLC, high-density lipoprotein cholesterol; HOMA-β, homeostasis model assessment-β; HOMA-IR, homeostasis model assessment of insulin resistance; QUICKI, quantitative insulin sensitivity check index; sdLDL, small dense low-density lipoprotein; TNF, tumor necrosis factor; U-8OHdG, urinary 8-hydroxy-deoxyguanosine; U-Alb, urinary albumin (measured by immunoturbidimetry and adjusted using urinary creatinine).
Changes in Serum Fatty Acid Concentrations
Vildagliptin significantly decreased the arachidic acid level and significantly increased the docosahexaenoic acid (DHA), whereas liraglutide did not affect either factor. Conversely, liraglutide significantly decreased the eicosatrienoic acid level, whereas vildagliptin did not affect it. The levels of arachidonic acid and eicosapentaenoic acid (EPA) were significantly increased in the vildagliptin group compared with the liraglutide group (Table2).
Table 2.
Changes in plasma fatty acid composition between baseline and 12 weeks in patients who completed the study
| Vildagliptin | P * | Liraglutide | P * | P ** | |||
|---|---|---|---|---|---|---|---|
| Before | After | Before | After | ||||
| C12:0 (lauric acid) | 2.3 ± 2.5 | 2.5 ± 3.2 | 0.762 | 1.8 ± 0.9 | 1.9 ± 1.2 | 0.759 | 0.855 |
| C14:0 (myristic acid) | 26.8 ± 16.4 | 27.1 ± 13.8 | 0.941 | 26.1 ± 12.0 | 25.0 ± 14.4 | 0.696 | 0.752 |
| C16:0 (palmitic acid) | 683.9 ± 148.5 | 693.2 ± 167.8 | 0.781 | 659.6 ± 190.5 | 637.8 ± 198.0 | 0.507 | 0.505 |
| C16:1n-7 (palmitoleic acid) | 66.3 ± 35.4 | 74.0 ± 32.8 | 0.122 | 63.2 ± 29.8 | 61.9 ± 32.0 | 0.780 | 0.177 |
| C18:0 (stearic acid) | 191.5 ± 32.0 | 187.2 ± 35.8 | 0.563 | 187.5 ± 32.8 | 197.1 ± 39.2 | 0.307 | 0.701 |
| C18:1n-9 (oleic acid) | 599.1 ± 158.7 | 618.7 ± 164.3 | 0.566 | 582.6 ± 181.3 | 564.5 ± 196.4 | 0.647 | 0.468 |
| C18:2n-6 (linoleic acid) | 736.0 ± 168.4 | 724.4 ± 197.3 | 0.683 | 751.8 ± 141.8 | 732.0 ± 166.9 | 0.560 | 0.851 |
| C18:3n-6 (γ-linolenic acid) | 9.4 ± 4.3 | 8.9 ± 3.8 | 0.523 | 7.6 ± 3.9 | 7.8 ± 4.2 | 0.721 | 0.465 |
| C18:3n-3 (α-linolenic acid) | 23.5 ± 9.7 | 24.2 ± 10.5 | 0.755 | 24.5 ± 10.1 | 25.8 ± 13.9 | 0.707 | 0.880 |
| C20:0n-6 (arachidic acid) | 7.1 ± 1.3 | 6.7 ± 1.4 | 0.043 | 6.4 ± 1.5 | 6.4 ± 1.5 | 0.977 | 0.129 |
| C20:1n9 (eicosenoic acid) | 4.9 ± 1.2 | 5.3 ± 1.6 | 0.213 | 4.8 ± 0.9 | 5.0 ± 1.6 | 0.483 | 0.622 |
| C20:2n6 (eicosadienoic acid) | 5.5 ± 1.2 | 5.6 ± 1.1 | 0.652 | 5.8 ± 1.2 | 5.7 ± 1.9 | 0.732 | 0.576 |
| C20:3n9 (eicosatrienoic acid) | 1.8 ± 1.2 | 2.0 ± 1.1 | 0.300 | 1.6 ± 0.6 | 1.3 ± 0.5 | 0.011 | 0.030 |
| C20:3n-6 (Dihomo-γ-linolenic acid) | 34.1 ± 12.1 | 32.1 ± 8.7 | 0.272 | 36.8 ± 14.9 | 33.6 ± 13.9 | 0.250 | 0.702 |
| C20:4n-6 (arachidonic acid) | 175.0 ± 36.9 | 193.2 ± 37.9 | 0.009 | 164.2 ± 40.5 | 164.0 ± 37.6 | 0.983 | 0.046 |
| C20:5n-3 (eicosapentaenoic acid) | 82.3 ± 38.1 | 99.5 ± 58.2 | 0.021 | 73.4 ± 30.5 | 70.7 ± 32.2 | 0.666 | 0.037 |
| C22:0 (behenic acid) | 18.0 ± 3.4 | 17.3 ± 4.2 | 0.223 | 17.6 ± 3.8 | 16.4 ± 4.0 | 0.055 | 0.559 |
| C22:1n-9 (erucic acid) | 1.5 ± 0.4 | 1.4 ± 0.5 | 0.327 | 1.7 ± 0.7 | 1.4 ± 0.4 | 0.056 | 0.288 |
| C22:4n-6 (docosatetraenoic acid) | 4.0 ± 1.7 | 4.3 ± 1.4 | 0.373 | 3.7 ± 1.2 | 3.4 ± 1.1 | 0.319 | 0.182 |
| C22:5n-3 (docosapentaenoic acid) | 23.7 ± 8.0 | 26.8 ± 12.6 | 0.065 | 21.8 ± 7.3 | 20.8 ± 7.8 | 0.342 | 0.037 |
| C22:6n-3 (docosahexaenoic acid) | 164.5 ± 49.6 | 186.4 ± 64.6 | 0.013 | 147.6 ± 38.3 | 151.7 ± 45.2 | 0.578 | 0.108 |
| C24:1 (nervonic acid) | 34.3 ± 6.9 | 34.1 ± 6.9 | 0.849 | 32.6 ± 8.6 | 32.3 ± 8.1 | 0.727 | 0.922 |
Data are expressed as mean ± standard deviation.
P-value for the intragroup comparison (baseline vs 12 weeks);
P-value for the intergroup comparison (difference in changes from baseline between groups).
Treatment Satisfaction
The mean DTSQ scores for the vildagliptin and liraglutide groups were 25.5 ± 6.3 and 25.1 ± 4.7, respectively, at baseline and 25.8 ± 5.6 and 24.4 ± 7.3, respectively, at the end of the study. The DTSQ scores were not significantly affected by either agent after switching from sitagliptin. In addition, there were no significant differences between the two treatment groups in terms of the changes in treatment satisfaction score (the sum of items 1, 4, 5, 6, 7 and 8), perceived frequency of hyperglycemia (item 2), or hypoglycemia (item 3) at the end of the study (Table3).
Table 3.
Diabetes treatment satisfaction questionnaire scores at baseline and 12 weeks in patients who completed the study
| Vildagliptin | P * | Liraglutide | P * | P ** | |||
|---|---|---|---|---|---|---|---|
| Before | After | Before | After | ||||
| Q1 | 4.1 ± 1.4 | 3.9 ± 1.4 | 0.424 | 4.0 ± 0.7 | 4.0 ± 1.3 | 0.873 | 0.628 |
| Q2 | 3.1 ± 1.7 | 2.8 ± 2.0 | 0.503 | 3.6 ± 1.7 | 3.3 ± 0.3 | 0.312 | 0.958 |
| Q3 | 1.6 ± 1.6 | 1.2 ± 1.6 | 0.437 | 1.4 ± 1.6 | 1.5 ± 1.6 | 0.747 | 0.400 |
| Q4 | 4.3 ± 1.6 | 4.8 ± 1.0 | 0.117 | 4.3 ± 1.4 | 4.3 ± 1.3 | 0.759 | 0.300 |
| Q5 | 4.2 ± 1.6 | 4.5 ± 1.2 | 0.348 | 4.2 ± 1.0 | 4.0 ± 1.4 | 0.527 | 0.264 |
| Q6 | 4.0 ± 1.4 | 4.3 ± 0.9 | 0.296 | 4.3 ± 0.9 | 3.9 ± 1.4 | 0.236 | 0.113 |
| Q7 | 3.9 ± 1.5 | 4.2 ± 1.2 | 0.492 | 4.2 ± 1.1 | 4.1 ± 1.4 | 0.780 | 0.473 |
| Q8 | 4.0 ± 1.5 | 4.2 ± 1.3 | 0.700 | 4.2 ± 1.0 | 4.0 ± 1.4 | 0.548 | 0.495 |
| SUM | 25.5 ± 6.3 | 25.8 ± 5.6 | 0.794 | 25.1 ± 4.7 | 24.4 ± 7.3 | 0.579 | 0.595 |
Data are expressed as mean ± standard deviation.
P-value for the intragroup comparison (baseline vs 12 weeks);
P-value for the intergroup comparison (difference in changes from baseline between groups).
Adverse Events
The most common adverse events were gastrointestinal symptoms, which occurred with similar frequencies in both treatment groups (Table4). The distribution of most other adverse events was similar between treatment groups. Nausea occurred in one patient treated with liraglutide. No pancreatitis or hypoglycemia occurred in present study. In the vildagliptin group, one woman reported hair loss. One episode of liver injury, which the investigator regarded as acute and likely to be related to the study drug, was diagnosed after 12 weeks of vildagliptin therapy in a 64-year-old woman. The investigator discontinued vildagliptin, and switched to liraglutide according to the study protocol. After 3 months of the discontinuation, the patient's liver enzymes recovered to the normal range. In the liraglutide group, one woman suffered a fracture of the shaft of the femur.
Table 4.
Adverse experiences of patients who completed the study
| Vildagliptin | Liraglutide | |
|---|---|---|
| Appetite loss | 1 | 3 |
| Skin itching | 3 | 0 |
| Constipation | 2 | 1 |
| Diarrhea | 2 | 1 |
| Chest discomfort | 2 | 0 |
| Heartburn | 1 | 1 |
| Feeling of fullness in the abdomen | 0 | 1 |
| Nausea | 0 | 1 |
| Injection site redness | 0 | 1 |
| Influenza infection | 1 | 0 |
| Fracture of shaft of femur | 0 | 1 |
| Dizziness | 0 | 1 |
| Liver injury | 1 | 0 |
| Loss of hair | 1 | 0 |
Data are number of participants.
Discussion
This is the first report from an open-label, randomized, parallel-group study to compare the effects of daily doses of 100 mg vildagliptin and 0.9 mg liraglutide on glycemic control and bodyweight in people with type 2 diabetes who did not achieve adequate glycemic control with sitagliptin-based regimens. We showed that after switching from sitagliptin, both vildagliptin and liraglutide significantly lowered HbA1c and that liraglutide was superior to vildagliptin in lowering HbA1c. Vildagliptin 100 mg ameliorated FPG and HbA1c 12 weeks after switching from sitagliptin 50 mg.
Liraglutide significantly decreased bodyweight, as expected, whereas vildagliptin did not affect bodyweight. Although DPP-4 inhibitors increase active GLP-1 concentrations two- or threefold compared with baseline14, the stimulation of GLP-1 receptor activity by liraglutide is estimated to be several times that resulting from DPP-4 inhibition15. In the present study, liraglutide lowered HbA1c independently of weight loss (Table S2). This finding is supported by a recent meta-analysis that included the Liraglutide Effect and Action in Diabetes trials16.
Liraglutide significantly increased CPI and HOMA-β, whereas vildagliptin significantly decreased IRI and CPI. The present finding that liraglutide decreased bodyweight and fasting plasma glucose, and increased markers for β-cell function, such as HOMA-β and CPI, is in agreement with the previous reports5,17. Interestingly, DPP-4 inhibitor vildagliptin did not affect the marker for β-cell function, but increased insulin sensitivity marker QUICKI. The most acceptable interpretation of this finding could be that GLP-1 receptor agonists improve β-cell function5,17, whereas vildagliptin improves insulin sensitivity. In addition, differences in the mode of action between GLP-1 analogs and DPP-4 inhibitors, which might stem from a difference in the dynamics of GLP-1 action or different effects on glucagon secretion, gastric empting and the autonomic nervous system, could also be involved in this phenomenon. The greater reductions in HbA1c and bodyweight with liraglutide vs vildagliptin were probably as a result of the pharmacological stimulation of GLP-1 receptor activity with liraglutide, whereas physiological concentrations of endogenous GLP-1 are achieved with vildagliptin. Nevertheless, both liraglutide- and vildagliptin-mediated improvements in glycemic control did not correlate with indices for insulin secretion and insulin sensitivity (Table S2), suggesting that unique and as yet unrecognized mechanisms might underlie the actions of each agent.
Liraglutide lowered total cholesterol and sdLDL in the present study, unlike in previous studies17,18. Vildagliptin did not affect either measure. In general, GLP-1 receptor agonists appear to beneficially influence fasting lipid parameters, although the effects are small, with reductions vs control of up to 14% for total cholesterol19. For DPP-4 inhibitors, the results are diverse and inconclusive19. Incretin-based therapies might particularly affect postprandial lipid profiles and reduce fasting lipid levels. Switching from sitagliptin to vildagliptin significantly increased the serum adiponectin level in the present study. However, a previous clinical study concluded that neither sitagliptin nor vildagliptin affected adiponectin levels20. The present findings support a previous report that serum levels of DPP-4 negatively correlate with adiponectin levels21, and suggest that vildagliptin is superior to sitagliptin in increasing adiponectin levels. Vildagliptin also significantly improved creatinine levels in the present study. Vildagliptin is well tolerated, with a good safety profile in patients with type 2 diabetes and moderate or severe renal impairment22, as the excretion of unmodified vildagliptin by the kidneys is <25%23. There were no significant differences between the two treatment groups in terms of changes in liver transaminases in the present study. It could be relevant that our patients showed only mild elevation of transaminase levels at baseline, given that GLP-1 receptor agonists were associated with significant improvements in abnormal liver transaminases, biomarkers of hepatocytes, and hepatic steatosis in patients with non-alcoholic fatty liver disease in two human reports24,25.
The present study is the first to show vildagliptin-mediated changes in serum fatty acid profiles in human or animals. Vildagliptin, but not liraglutide, elevated serum concentrations of EPA and DHA after 3 months of administration. The effects of vildagliptin on fatty acid profiles were independent of its effects on glycemic control (Table S2), insulin sensitivity, and cardiovascular markers. The molecular mechanisms underlying the vildagliptin-mediated effects on fatty acid levels and insulin secretion should be pursued in future studies. In contrast to a previous report26, baseline levels of DHA, but not EPA, predicted the vildagliptin-mediated improvement in glycemic control (Table S2). This finding might be relevant to the observation that GLP-1 secretion was induced by ω-3 polyunsaturated fatty acid (PUFA) administration in basic studies27,28. In addition, G protein-coupled receptor (GPR) 120 functions as a receptor for unstructured long-chain fatty acids, and stimulation of GPR 120 with DHA promotes GLP-1 secretion in vitro27. Furthermore, intracolonic administration of DHA stimulates GLP-1 secretion in vivo28.
Quality of life, assessed using the DTSQ, was not impaired in either group after switching from sitagliptin, despite the fact that liraglutide was given by injection and vildagliptin should be taken twice a day. In addition, the change in quality of life did not differ significantly between the two treatment groups. This result is surprising, because it suggests that switching from a once-daily oral agent to either an injected agent or a twice-daily oral agent did not worsen the patients' quality of life. We speculate that increased treatment satisfaction was associated with improved clinical outcomes in the present study, as suggested previously29.
Overall, both liraglutide and vildagliptin were well tolerated. Most of the adverse experiences were mild, and no serious adverse events, such as pancreatitis, which was reported in the liraglutide LEAD studies17,30–32, occurred in the present study.
In summary, vildagliptin-mediated improvements in glycemic control did not correlate with indices for insulin secretion and insulin sensitivity. Switching from sitagliptin to liraglutide is useful in managing hyperglycemia and weight. Each agent exerts unique pleiotropic effects on lipid profile, adiponectin level and fatty acid composition.
Acknowledgments
This work was supported by Grants-in-Aid from the Ministry of Education, Culture, Sports, Science, and Technology of Japan, and research grants from Novo Nordisk and Novartis (to TT and SK). Clinical Centers for the Establishment of Rationale for Antiaging Diabetic Medicine (ERA-DM) Study Chapter 2 Group: Department of Disease Control and Homeostasis, Kanazawa University Graduate School of Medical Science (Kanazawa, Ishikawa): Yumie Takeshita MD PhD, Toshinari Takamura MD PhD, Toshiki Otoda MD PhD; Ken-ichiro Kato MD, Hitomi Wakakuri MD, Masayuki Yamada MD, Hirofumi Misu MD PhD, Shuichi Kaneko MD PhD, Tsuguhito Ota MD PhD, Takehiro Kanamori MD, Yukiko Matsushima (coordinator), Shima Kitakata (coordinator); Handa Medical Clinic (Kanazawa, Ishikawa): Yumie Takeshita MD PhD; Public Hakui Hospital (Hakui, Ishikawa): Toshiki Otoda MD PhD; Japanese Red Cross Kanazawa Hospital (Kanazawa, Ishikawa): Erika Hamaguchi MD PhD and Yasuyuki Nishimura MD PhD; Toyama City Hospital (Toyama, Toyama), Akiko Shimizu MD PhD; Public Central Hospital of Matto Ishikawa (Matto, Ishikawa): Yuki Kita MD and Kozo Kawai MD PhD; Kahoku Central Hospital (Kahoku, Ishikawa), Kensuke Mouri MD; Fukui Saiseikai Hospital (Fukui, Fukui): Kosuke R Shima MD and Yukihiro Bando MD PhD; Kanazawa Municipal Hospital (Kanazawa, Ishikawa): Nobuhiko Koike MD PhD.
Supporting Information
Table S1 |Changes in the characteristics of patients between baseline and 12 weeks (intention to treat analysis).
Table S2 | Factors associated with a change in glycated hemoglobin.
References
- Ray KK, Seshasai SR, Wijesuriya S, et al. Effect of intensive control of glucose on cardiovascular outcomes and death in patients with diabetes mellitus: a meta-analysis of randomised controlled trials. Lancet. 2009;373:1765–1772. doi: 10.1016/S0140-6736(09)60697-8. [DOI] [PubMed] [Google Scholar]
- Drucker DJ, Nauck MA. The incretin system: glucagon-like peptide-1 receptor agonists and dipeptidyl peptidase-4 inhibitors in type 2 diabetes. Lancet. 2006;368:1696–1705. doi: 10.1016/S0140-6736(06)69705-5. [DOI] [PubMed] [Google Scholar]
- Inzucchi SE, Bergenstal RM, Buse JB, et al. Management of hyperglycemia in type 2 diabetes: a patient-centered approach: position statement of the American Diabetes Association (ADA) and the European Association for the Study of Diabetes (EASD) Diabetes Care. 2012;35:1364–1379. doi: 10.2337/dc12-0413. [DOI] [PMC free article] [PubMed] [Google Scholar]
- Pratley RE, Nauck M, Bailey T, et al. Liraglutide versus sitagliptin for patients with type 2 diabetes who did not have adequate glycaemic control with metformin: a 26-week, randomised, parallel-group, open-label trial. Lancet. 2010;375:1447–1456. doi: 10.1016/S0140-6736(10)60307-8. [DOI] [PubMed] [Google Scholar]
- Esposito K, Cozzolino D, Bellastella G, et al. Dipeptidyl peptidase-4 inhibitors and HbA1c target of <7% in type 2 diabetes: meta-analysis of randomized controlled trials. Diabetes Obes Metab. 2011;13:594–603. doi: 10.1111/j.1463-1326.2011.01380.x. [DOI] [PubMed] [Google Scholar]
- Aroda VR, Henry RR, Han J, et al. Efficacy of GLP-1 receptor agonists and DPP-4 inhibitors: meta-analysis and systematic review. Clin Ther. 2012;34:1247–1258. doi: 10.1016/j.clinthera.2012.04.013. [DOI] [PubMed] [Google Scholar]
- Yang W, Chen L, Ji Q, et al. Liraglutide provides similar glycaemic control as glimepiride (both in combination with metformin) and reduces body weight and systolic blood pressure in Asian population with type 2 diabetes from China, South Korea and India: a 16-week, randomized, double-blind, active control trial. Diabetes Obes Metab. 2011;13:81–88. doi: 10.1111/j.1463-1326.2010.01323.x. [DOI] [PubMed] [Google Scholar]
- Puavilai G, Chanprasertyotin S, Sriphrapradaeng A. Diagnostic criteria for diabetes mellitus and other categories of glucose intolerance: 1997 criteria by the Expert Committee on the Diagnosis and Classification of Diabetes Mellitus (ADA), 1998 WHO consultation criteria, and 1985 WHO criteria. World Health Organization. Diabetes Res Clin Pract. 1999;44:21–26. doi: 10.1016/s0168-8227(99)00008-x. [DOI] [PubMed] [Google Scholar]
- Katz A, Nambi SS, Mather K, et al. Quantitative insulin sensitivity check index: a simple, accurate method for assessing insulin sensitivity in humans. J Clin Endocrinol Metab. 2000;85:2402–2410. doi: 10.1210/jcem.85.7.6661. [DOI] [PubMed] [Google Scholar]
- Matthews DR, Hosker JP, Rudenski AS, et al. Homeostasis model assessment: insulin resistance and beta-cell function from fasting plasma glucose and insulin concentrations in man. Diabetologia. 1985;28:412–419. doi: 10.1007/BF00280883. [DOI] [PubMed] [Google Scholar]
- Bradley C. The diabetes treatment satisfaction questionnaire. In: Bradley C, editor. Handbook of Psychology and Diabetes: A Guide to Psychological Measurement in Diabetes Research and Practice. Chur: Harwood Academic Publishers; 1994. pp. 111–132. [Google Scholar]
- Bradley C, Gamsu DS. Guidelines for encouraging psychological well-being: report of a Working Group of the World Health Organization Regional Office for Europe and International Diabetes Federation European Region St Vincent Declaration Action Programme for Diabetes. Diabet Med. 1994;11:510–516. doi: 10.1111/j.1464-5491.1994.tb00316.x. [DOI] [PubMed] [Google Scholar]
- Ishii H, Bradley C, Riazi A, et al. The Japanese version of the Diabetes Treatment Satisfaction Questionnaire (DTSQ): translation and clinical evaluation. Journal of Clinical and Experimental Medicine. 2000;192:809–814. [Google Scholar]
- Aschner P, Kipnes MS, Lunceford JK, et al. Effect of the dipeptidyl peptidase-4 inhibitor sitagliptin as monotherapy on glycemic control in patients with type 2 diabetes. Diabetes Care. 2006;29:2632–2637. doi: 10.2337/dc06-0703. [DOI] [PubMed] [Google Scholar]
- Degn KB, Juhl CB, Sturis J, et al. One week's treatment with the long-acting glucagon-like peptide 1 derivative liraglutide (NN2211) markedly improves 24-h glycemia and alpha- and beta-cell function and reduces endogenous glucose release in patients with type 2 diabetes. Diabetes. 2004;53:1187–1194. doi: 10.2337/diabetes.53.5.1187. [DOI] [PubMed] [Google Scholar]
- Schmidt WE, Gough S, Madsbad NS, et al. Liraglutide, a human GLP-1 analogue, lowers HbA1c independent of weight loss. Diabetologia. 2009;52(Suppl. 1):S289. [Google Scholar]
- Buse J, Rosenstock J, Sesti G, et al. Liraglutide once a day versus exenatide twice a day for type 2 diabetes: a 26-week randomised, parallel-group, multinational, open-label trial (LEAD-6) Lancet. 2009;374:39–47. doi: 10.1016/S0140-6736(09)60659-0. [DOI] [PubMed] [Google Scholar]
- Cuthbertson DJ, Irwin A, Gardner CJ, et al. Improved glycaemia correlates with liver fat reduction in obese, type 2 diabetes, patients given glucagon-like peptide-1 (GLP-1) receptor agonists. PLoS One. 2012;7:e50117. doi: 10.1371/journal.pone.0050117. [DOI] [PMC free article] [PubMed] [Google Scholar]
- van Genugten RE, Möller-Goede DL, van Raalte DH, et al. Extra-pancreatic effects of incretin-based therapies: potential benefit for cardiovascular-risk management in type 2 diabetes. Diabetes Obes Metab. 2013;15:593–606. doi: 10.1111/dom.12050. [DOI] [PubMed] [Google Scholar]
- Rizzo MR, Barbieri M, Marfella R, et al. Reduction of oxidative stress and inflammation by blunting daily acute glucose fluctuations in patients with type 2 diabetes: role of dipeptidyl peptidase-IV inhibition. Diabetes Care. 2012;35:2076–2082. doi: 10.2337/dc12-0199. [DOI] [PMC free article] [PubMed] [Google Scholar]
- Lamers D, Famulla S, Wronkowitz N, et al. Dipeptidyl peptidase 4 is a novel adipokine potentially linking obesity to the metabolic syndrome. Diabetes. 2011;60:1917–1925. doi: 10.2337/db10-1707. [DOI] [PMC free article] [PubMed] [Google Scholar]
- Kothny W, Shao Q, Groop PH, et al. One-year safety, tolerability and efficacy of vildagliptin in patients with type 2 diabetes and moderate or severe renal impairment. Diabetes Obes Metab. 2012;14:1032–1039. doi: 10.1111/j.1463-1326.2012.01634.x. [DOI] [PubMed] [Google Scholar]
- He H, Tran P, Yin H, et al. Absorption, metabolism, and excretion of [14C]vildagliptin, a novel dipeptidyl peptidase 4 inhibitor, in humans. Drug Metab Dispos. 2009;37:536–544. doi: 10.1124/dmd.108.023010. [DOI] [PubMed] [Google Scholar]
- Buse JB, Klonoff DC, Nielsen LL, et al. Metabolic effects of two years of exenatide treatment on diabetes, obesity, and hepatic biomarkers in patients with type 2 diabetes: an interim analysis of data from the open-label, uncontrolled extension of three double-blind, placebo-controlled trials. Clin Ther. 2007;29:139–153. doi: 10.1016/j.clinthera.2007.01.015. [DOI] [PubMed] [Google Scholar]
- Tushuizen ME, Bunck MC, Pouwels PJ, et al. Incretin mimetics as a novel therapeutic option for hepatic steatosis. Liver Int. 2006;26:1015–1017. doi: 10.1111/j.1478-3231.2006.01315.x. [DOI] [PubMed] [Google Scholar]
- Senmaru T, Fukui M, Kobayashi K, et al. DPP-IV inhibitors is effective in patients with type 2 diabetes with high serum eicosapentaenoic acid concentrations. J Diabetes Invest. 2012;3:498–502. doi: 10.1111/j.2040-1124.2012.00220.x. [DOI] [PMC free article] [PubMed] [Google Scholar]
- Hirasawa A, Tsumaya K, Awaji T, et al. Free fatty acids regulate gut incretin glucagon-like peptide-1 secretion through GPR120. Nat Med. 2005;11:90–94. doi: 10.1038/nm1168. [DOI] [PubMed] [Google Scholar]
- Morishita M, Tanaka T, Shida T, et al. Usefulness of colon targeted DHA and EPA as novel diabetes medications that promote intrinsic GLP-1 secretion. J Control Release. 2008;132:99–104. doi: 10.1016/j.jconrel.2008.09.001. [DOI] [PubMed] [Google Scholar]
- Peyrot M, Rubin RR. How does treatment satisfaction work? Diabetes Care. 2009;32:1411–1417. doi: 10.2337/dc08-2256. [DOI] [PMC free article] [PubMed] [Google Scholar]
- Garber A, Henry R, Ratner R, et al. Liraglutide versus glimepiride monotherapy for type 2 diabetes (LEAD-3 Mono): a randomised, 52-week, phase III, double-blind, parallel-treatment trial. Lancet. 2009;373:473–481. doi: 10.1016/S0140-6736(08)61246-5. [DOI] [PubMed] [Google Scholar]
- Marre M, Shaw J, Brandle M, et al. Liraglutide, a once-daily human GLP-1 analogue, added to a sulphonylurea over 26 weeks produces greater improvements in glycaemic and weight control compared with adding rosiglitazone or placebo in subjects with type 2 diabetes (LEAD-1 SU) Diabet Med. 2009;26:268–278. doi: 10.1111/j.1464-5491.2009.02666.x. [DOI] [PMC free article] [PubMed] [Google Scholar]
- Nauck M, Frid A, Hermansen K, et al. Efficacy and safety comparison of liraglutide, glimepiride, and placebo, all in combination with metformin, in type 2 diabetes: the LEAD (liraglutide effect and action in diabetes)-2 study. Diabetes Care. 2009;32:84–90. doi: 10.2337/dc08-1355. [DOI] [PMC free article] [PubMed] [Google Scholar]
Associated Data
This section collects any data citations, data availability statements, or supplementary materials included in this article.
Supplementary Materials
Table S1 |Changes in the characteristics of patients between baseline and 12 weeks (intention to treat analysis).
Table S2 | Factors associated with a change in glycated hemoglobin.