

Abstract
Aims/Introduction
The principal aim of the present study was to investigate the cardiovascular autonomic system status of diabetes patients using approximate entropy (ApEn) extracted from 24-h heart rate variability (HRV) and its frequency components.
Materials and Methods
A total of 29 healthy controls and 63 type 2 diabetes patients were included. Participants’ 24-h HRV signals were recorded, and decomposed and reconstructed into four frequency components: high, low, very low and ultra low. The total 24-h HRV and its four components were divided into 24 1-h segments. ApEn values were extracted and statistically analyzed. Four traditional HRV indices, namely standard deviation of the RR intervals, root mean square of successive differences, coefficient of variance of RR intervals and ratio of low to high power of HRV, were also calculated.
Results
The low-frequency component contained the most abundant non-linear information, so was potentially most suitable for studying the cardiovascular system status with non-linear methods. ApEn values extracted from low- and high-frequency components of healthy controls were higher than those of diabetes patients. Except for root mean square of successive differences, standard deviation of the RR intervals, low to high power of HRV and coefficient of variance of RR intervals of healthy controls were all higher than those of diabetes patients.
Conclusions
The results showed that ApEn contained information on disorders of autonomic system function of diabetes patients as traditional HRV indices in time and frequency domains. ApEn and three traditional indices showed accordance to some degree. Non-linear information in subcomponents of HRV was shown, which is potentially more effective for distinguishing healthy individuals and diabetes patients than that extracted from the total HRV. Compared with diabetes patients, the cardiovascular system of healthy controls showed information of higher complexity, and better regulation function in response to changes of environment.
Keywords: 24-h Heart rate variability, Approximate entropy, Cardiovascular autonomic function
Introduction
Diabetic autonomic neuropathy (DAN) is a common and serious complication of diabetes. When autonomic nervous system disorders occur, angina or myocardial infarction might be painless, which greatly increases the risk of cardiovascular disease events. Therefore, cardiac autonomic dysfunction is usually considered to be a risk factor for cardiovascular disease, and a major cause of morbidity and mortality in diabetes1–3. Studies have reported cardiovascular autonomic neuropathy in the early stages of diabetes or subclinical cardiovascular disease4–6. As an effective, non-invasive indicator to assess the activity, balance and certain pathologies of the autonomic nervous system, heart rate variability (HRV) has been shown to be closely related to cardiovascular events. In the early 1980s, Ewing et al.7 measured differences in the RR intervals of diabetes patients to detect autonomic nerve damage. Since then, further studies on cardiovascular autonomic system status using HRV time and frequency domains have been carried out8–14. Compared with short HRV recordings, 24-h HRV potentially contains more information about the regulation of the cardiac autonomic nervous system. Furthermore, studies have been carried out on the 24-h HRV of patients with diabetes15–20. Most showed that patients with diabetes usually had lower indices of HRV in time domains, and that the ratio of low-frequency (LF) to high-frequency (HF) components was significantly changed in patients with diabetes18.
In addition to analyzing time and frequency domains, non-linear analysis of HRV has been used in recent years. Information on pathological status can be shown by extracting non-linear features of the HRV, and establishing the relationship between observed characteristics and physiological phenomena. Non-linear indices include the Lorenz plot, complexity degree and approximate entropy (ApEn)21,22. Molina-Picó et al.23 analyzed the influence of QRS detection errors in HRV results based on signal entropy measures, and showed that analysis based on ApEn and sample entropy (SampEn) might fail in signal classification tasks because of the presence of certain types of noise. Nikolopoulos et al.24 studied 2-h recordings of HRV from healthy subjects and patients with coronary artery disease and normal left ventricular function, and showed that the Fourier transform and autocorrelation functions could not provide an accurate and clear quantitative categorization, whereas ApEn succeeded in clearly and accurately differentiating between the two groups. Guerra et al.25 showed that ApEn extracted from impedance cardiography signals was significantly higher in subjects with metabolic syndrome compared with those without. Vigo et al.26 studied SampEn of HRV within independent frequency components in awake individuals, and during slow-wave and rapid eye movement sleep in 10 healthy adults. A higher SampEn was found when analyzing global variability and very low frequency (VLF) variability during slow-wave sleep. The authors proposed that non-linear HRV was a useful index of autonomic activity that characterized different sleep–wake cycle stages. Vandeput et al.27 studied 24-h Holter recordings in a healthy population, showing higher non-linear behavior during the night, and non-linear heart rate fluctuations declining with increasing age, supporting the involvement of the autonomic nervous system in the generation of non-linear and complex heart rate dynamics. Corino et al.28 studied 24-h electrocardiogram (ECG) recordings in healthy subjects aged 20–85 years, and confirmed that increasing age during adult life was associated with a reduction in overall HRV and also in the complexity of physiological dynamics. Studies have also been carried out on HRV using both linear and non-linear methods. Pivatelli et al.29 evaluated the linear and non-linear HRV indices in stable angina patients undergoing coronary angiography, and found that the best discriminatory power for the presence of significant coronary obstruction was high frequency (HF) in absolute units, root mean square of successive differences (rMSSD), ApEn and total number of adjacent RR intervals with a difference of duration >50 ms (NN50).
ApEn is one of the most important approaches to studying HRV because of its quantitative capability for regularity of time series. Compared with short ECG recordings, 24-h ECG recordings might provide a more complete description of HRV dynamics, because during a 24-h period, the subject will experience many different stimuli, and the autonomic nervous system is probed in a variety of situations, not only in laboratory-controlled conditions. Therefore, the present study evaluated ApEn from total 24-h HRV and four different frequency components of 24-h HRV recordings, obtained from patients with type 2 diabetes and healthy controls. ApEn values were extracted from 0 to 24 h at hourly intervals, and the ApEn curves from the two groups were represented graphically. ApEn values from four time periods were studied for the two groups.
Materials and Methods
Study Participants
All participants were from Wangjing Hospital of China Academy of Traditional Chinese Medicine during October 2009 to June 2011, including outpatients, hospital patients and healthy individuals. A total of 29 healthy subjects (age range 40–73 years, mean age 51.90 ± 9.06 years, 14 men and 15 women) were selected with unremarkable medical histories and normal physical examinations. A total of 63 participants with type 2 diabetes (age range aged 41–70 years, mean age 56.61 ± 7.16 years, 30 men and 33 women) were selected randomly from patients with diagnosed diabetes. The diagnosis of type 2 diabetes was made according to 1999 World Health Organization criteria30. Among the participants with type 2 diabetes, there were 41 patients with complications and 22 patients without complications. The complications included hypertension, dyslipidemia, hyperuricemia and so on. For diabetes patients, digitalis and β-blockers were not taken within at least 48 h before the start of the study.
Data Acquisition
The 24-h ECG of participants was collected by a Holter recorder. The 24-h HRV data were detected automatically by Holter system from ECG data. To eliminate the pseudo-RR intervals caused by the interference signals, the data were then revised manually and saved by a skilled doctor from the ECG laboratory.
Signal Preprocessing
Because of different starting time recording for all participants, first all data were adjusted to start from 0 h. Then, by a seven-level wavelet decomposition and reconstruction with Daubechies 5 wavelet, 24-h HRV was decomposed into four sections representing different frequency domains, namely high frequency (HF; 0.15–0.4 Hz), low frequency (LF; 0.04–0.15 Hz), very low frequency (VLF; 0.003–0.04 Hz) and ultra-low frequency (ULF; 0–0.003 Hz). Afterwards 24-h signals were divided to 24 segments from 0 to 24 h at hourly intervals.
Extraction of ApEn
ApEn was proposed by Pincus in 1991 as a method for measuring regularity and complexity in time series, and has been successfully used to analyze physiological time series31. As a quantification of regularity in data, ApEn can be used to measure the abnormality and complexity of signals. The more complex and irregular the signal is, the higher the ApEn value. An advantage of ApEn is the relatively low data sample size required – approximately 100–5,000 points. For a 1,000-point dataset, a robust ApEn can be obtained, with favorable antinoise and antijamming. The ApEn algorithm is described by Pincus31, and not repeated in detail here. Given N data points, X(1), X(2), X(3), …, X(N), the ApEn (m,r,N) is estimated, where r is a threshold and m a window size. In the current study, m was chosen to be 2, and r was chosen to be 0.2 times the standard deviation of the raw data.
Time and Frequency Domain Methods
For comparison, four traditional HRV indices in time and frequency domains including standard deviation of the RR intervals (SDNN), rMSSD, coefficient of variance of RR intervals (CVrr) and ratio of low to high power of HRV (LHr) were calculated32.
Statistical Analysis
Four traditional indices of 24-h HRV were analyzed with independent samples t-test. The parameters from four time-periods, namely 00.00–01.00, 08.00–09.00, 12.00–13.00 and 20.00–21.00 h, were analyzed with repeated measures anova. Data were expressed as mean ± standard deviation, and P < 0.05 was considered statistically significant. Statistical analysis was carried out using spss Statistics for Windows, version 17.0 (SPSS Inc., Chicago, IL, USA).
Results
ApEn values from four time-periods of the total 24-h HRV and the four frequency components are shown in Table1. Four indices of 24-h HRV from time and frequency domains are shown in Table2.
Table 1.
Approximate entropy values from four segments of 24-h heart rate variability
| Group | 00.00–01.00 h | 08.00–09.00 h | 12.00–13.00 h | 20.00–21.00 h | |
|---|---|---|---|---|---|
| Original HRV | Healthy | 1.0171 ± 0.2644 | 0.9618 ± 0.2893 | 1.1462 ± 0.2532 | 0.9481 ± 0.2669 |
| Diabetes | 0.9952 ± 0.3825 | 0.8828 ± 0.3205 | 1.0753 ± 0.3783 | 0.8648 ± 0.3527 | |
| HF of HRV | Healthy | 0.7793 ± 0.2191 | 0.7281 ± 0.2309 | 0.7571 ± 0.1761 | 0.7287 ± 0.2568 |
| Diabetes | 0.6042 ± 0.2348 | 0.5859 ± 0.2472 | 0.6461 ± 0.2173 | 0.6126 ± 0.2312 | |
| LF of HRV | Healthy | 1.2866 ± 0.2158 | 1.2751 ± 0.2445 | 1.3778 ± 0.1434 | 1.2357 ± 0.2573 |
| Diabetes | 1.0739 ± 0.3221 | 1.0261 ± 0.3435 | 1.1306 ± 0.3127 | 1.0779 ± 0.3004 | |
| VLF of HRV | Healthy | 0.5317 ± 0.0598 | 0.5319 ± 0.0405 | 0.4715 ± 0.0679 | 0.5267 ± 0.0653 |
| Diabetes | 0.5098 ± 0.0753 | 0.5070 ± 0.0783 | 0.4970 ± 0.0835 | 0.5005 ± 0.0713 | |
| ULF of HRV | Healthy | 0.0226 ± 0.0083 | 0.0180 ± 0.0065 | 0.0235 ± 0.0074 | 0.0229 ± 0.0141 |
| Diabetes | 0.0217 ± 0.0083 | 0.0196 ± 0.0090 | 0.0201 ± 0.0076 | 0.0188 ± 0.0078 |
Data expressed as mean ± standard deviation. HF, high frequency; HRV, heart rate variability; LF, low frequency; VLF, very low frequency; ULF, ultra-low frequency.
Table 2.
Four indices of 24 h heart rate variability from time and frequency domains
| Healthy controls | Diabetes patients | P | |
|---|---|---|---|
| SDNN | 142.4562 ± 24.2303 | 110.2083 ± 29.3668 | <0.0001 |
| rMSSD | 45.3402 ± 25.6490 | 54.4305 ± 26.4914 | 0.126 |
| CVrr | 17.3534 ± 2.5291 | 14.1946 ± 3.5268 | <0.0001 |
| LHr | 1.5123 ± 0.7826 | 0.9195 ± 0.2588 | <0.0001 |
Data expressed as mean ± standard deviation. CVrr, coefficient of variance of RR intervals; LHr, low to high power of heart rate variability; rMSSD, root mean square of successive differences; SDNN, standard deviation of the RR intervals.
Analysis of ApEn Values From 24 Segments of Total 24-h HRV and its Four Components
To study the correlation between ApEn from different frequency components and that from the total HRV, data from healthy controls were analyzed first. Figure1 shows the ApEn curves from healthy subjects. With correlation analysis on subcomponent signals and total 24-h HRV, linear correlation only existed between ApEn from the LF component and that from the total HRV (r = 0.492, P = 0.0147). Figure1 showed ApEn curves from each 1-h interval of the 24-h HRV from the total HRV and the four frequency components. It can be seen that ApEn values from the ULF component were very small, meaning that it contained little non-linear information, consistent with the strong regularity characteristic of ULF components. Therefore, non-linear methods were not suitable for analyzing the ULF component. The highest ApEn values were from the LF component, indicating it contained much non-linear information. In addition, there was some non-linear information contained in the HF and VLF components.
Figure 1.
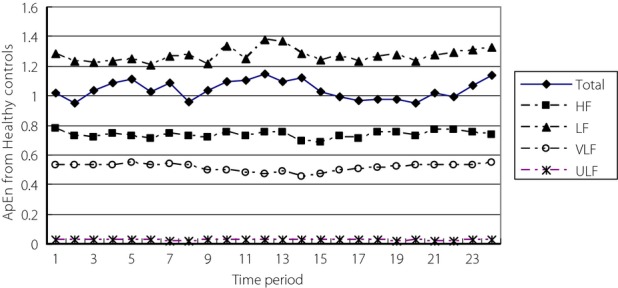
Approximate entropy (ApEn) curves from healthy controls showing the low-frequency component (LF), total heart rate variability (Total), high-frequency component (HF), very low frequency component (VLF) and ultra-low frequency component (ULF).
Figure2 shows the ApEn curves from diabetes patients. With correlation analysis on subcomponent signals and total 24-h HRV from diabetes patients, there was a moderate correlation between ApEn values from the HF component and the total HRV (r = 0.690, P = 0.0002). A correlation also existed between ApEn values from the LF component and the total HRV (r = 0.677, P = 0.0003). As shown in Figure2, the distribution of ApEn curves for the total HRV and the four frequency components in patients with diabetes were similar to the results in healthy controls, therefore they are not discussed further.
Figure 2.
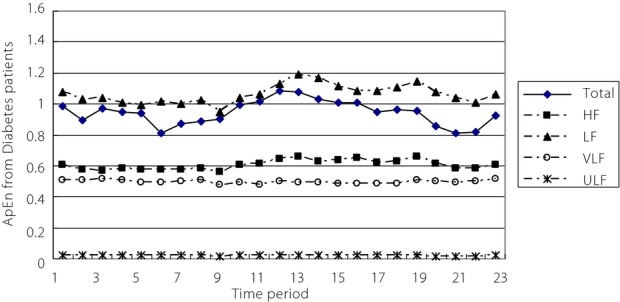
Approximate entropy (ApEn) curves from diabetes patients showing the low-frequency component (LF), total heart rate variability (Total), high-frequency component (HF), very low frequency component (VLF) and ultra-low frequency component (ULF).
Comparison of ApEn Values From the HRV and its Three Components of the Two Groups in Four Time-Periods
Because of the very small ApEn values obtained from the ULF component, it was not analyzed further. ApEn values from the three remaining frequency components and the total HRV of the two groups in four time-periods were analyzed using repeated measures anova.
ApEn values from the total HRV for the two groups were analyzed first. Mauchly's test of sphericity33 showed the hypothesis was not true. After adjustment, there was a significant difference between ApEn values in at least two different time-periods (Greenhouse–Geisser: P = 0.0007). There was no interaction between time-period and group (Greenhouse–Geisser: P = 0.879). Cubic fitting was suitable to fit ApEn curves. The two ApEn curves had a similar tendency of change (P = 0.0006; Figure3). ApEn values from healthy controls and diabetes patients were not statistically significantly different (P = 0.199).
Figure 3.
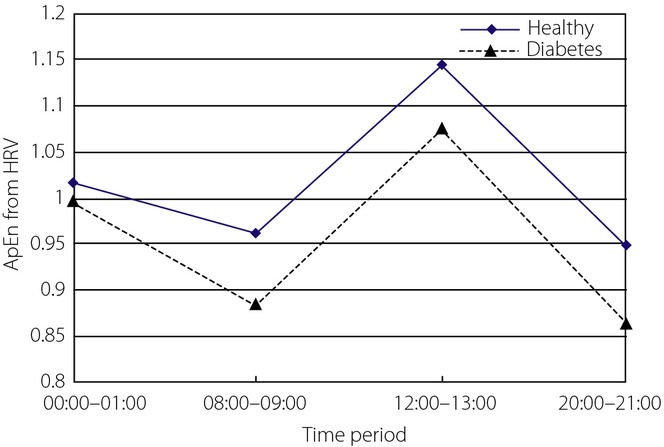
Approximate entropy (ApEn) of heart rate variability (HRV) in four time-periods from the two groups.
When the ApEn values from the HF component of HRV from two groups were statistically analyzed, Mauchly's test of sphericity showed the hypothesis was not true. After adjustment, there was no statistical difference between ApEn values from different time-periods (P = 0.224). There was no interaction between time-period and group (P = 0.491). Cubic fitting was suitable to fit the ApEn curves (P = 0.02). The trends for the two curves were similar (P = 0.793), but the ApEn curve for healthy controls was clearly higher than that of diabetes patients (Figure4). The ApEn values from the two groups were statistically significantly different (P = 0.002). Clinically, it is thought that the HF component of HRV is related to respiratory sinus arrhythmia and mediated solely by parasympathetic activity. HF is predominant at night, which can be explained by a decrease of sympathetic activity in coincidence with parasympathetic arousal during the night. Comparing the results from the two groups, ApEn values from the healthy controls decreased more obviously from 00.00 to 08.00 h, whereas those from patients with diabetes increased more obviously from 08.00 to 12.00 h. In the four periods, the highest ApEn value was 00.00–01.00 h in healthy controls, but 12.00–13.00 h for diabetes patients. The results showed that parasympathetic nervous system activity in healthy controls was strongest at night, in line with what would be expected physiologically, whereas some impairment occurred in diabetes patients. ApEn values from healthy controls were clearly higher than those from diabetes patients, showing that parasympathetic nervous system activity was more complex in healthy controls. The standard deviations of ApEn values for the two groups were not clearly comparable.
Figure 4.
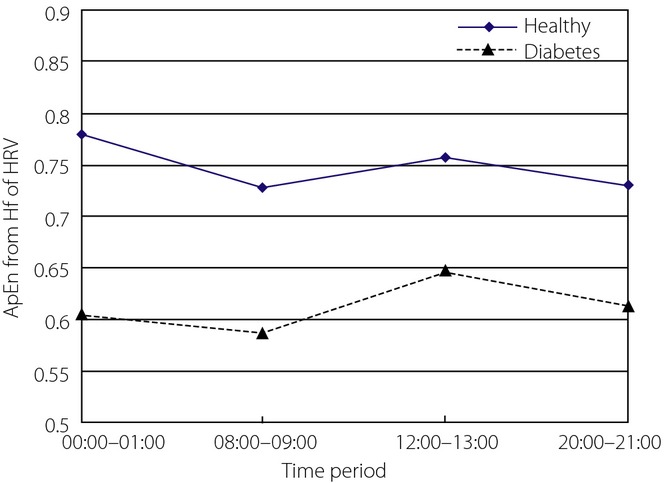
Approximate entropy (ApEn) of high-frequency component component of heart rate variability (HRV) in four time-periods from the two groups.
The ApEn values from the LF component of HRV for the two groups were analyzed, and Mauchly's test of sphericity showed the hypothesis was true. It showed ApEn values from at least two different periods were statistically significantly different (P = 0.018). There was no interaction between time-period and group (P = 0.562). Cubic fitting was suitable to fit ApEn curves (P = 0.002). Trends for the two curves were similar (P = 0.812), but the ApEn curve for healthy controls was clearly higher than that of diabetes patients (Figure5). The ApEn values from the LF component of two groups were statistically significantly different (P = 0.0002). Clinically, it is generally thought that the LF component of HRV is related to baroreflex control and depends on sympathetic and parasympathetic mechanisms. LF is predominant at daytime, which is mainly dominated by sympathetic activity during the day. The ApEn results for both groups appeared high during the day and low at night, which is in accordance with normal physiological activities. The results also showed that trends in sympathetic nervous system activity of the two groups were normal to some degree, but that the sympathetic nervous system had more complex activity in healthy controls, and that their cardiovascular systems had better regulation capability to changes. Standard deviation was larger in diabetes patients, suggesting a wider spread of cardiovascular function status in diabetes patients.
Figure 5.
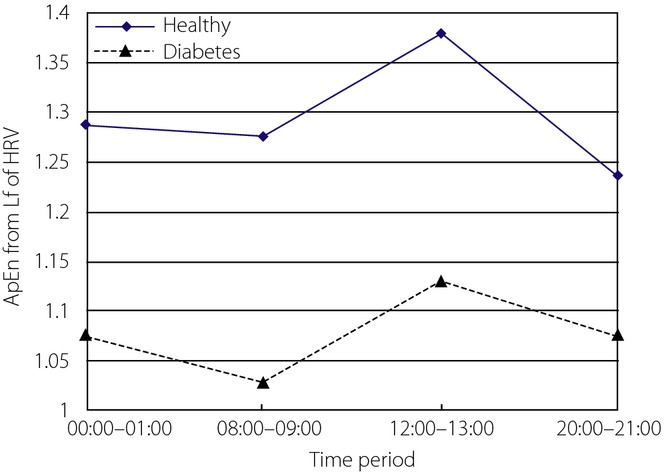
Approximate entropy (ApEn) of low-frequency component of heart rate variability (HRV) in four time-periods from the two groups.
The ApEn values from the VLF component of HRV for the two groups were analyzed, and Mauchly's test of sphericity showed the hypothesis was not true. After adjustment, there was an interaction between time-period and group (P = 0.008). Simple effect analysis was therefore used here. Two independent samples t-tests showed there was no statistically significant difference in the two groups. ApEn curves for the two groups are shown in Figure6. Clinically, the VLF component of HRV is generally considered to reflect neuroendocrine and thermoregulatory influences. Further study is necessary to explore the significance of ApEn from the VLF component.
Figure 6.
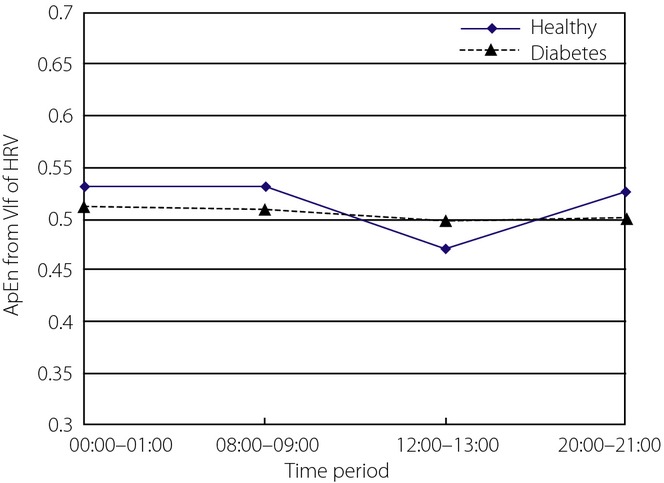
Approximate entropy (ApEn) of very low frequency (VLF) component of heart rate variability (HRV) in four time-periods from the two groups.
Comparison of Four HRV Indices in Time and Frequency Domains of the Two Groups in Four Time-Periods
Four indices of 24-h HRV from the two groups were statistically analyzed with independent samples t-test (Table2). Except for rMSSD, SDNN, CVrr and LHr were significantly different in the two groups, which were higher in healthy controls. That meant the autonomic system function of diabetes patient was worse. Furthermore, three indices in four time-periods were analyzed using repeated measures anova.
SDNN of HRV was statistically analyzed, and Mauchly's test of sphericity showed the hypothesis was not true. After adjustment, SDNNs from at least two different time-periods were significantly different (P = 0.009). There was an interaction between time-period and group (P = 0.019), so simple effects analysis was carried out. In healthy controls, SDNN during 00.00–01.00 h was statistically different from that during 12.00–13.00 and 20.00–21:00 h, respectively. In diabetes patients, SDNN during 08.00–09.00 h was statistically different from that in the other three time-periods, respectively. Except for 08.00–09.00 h, SDNN in the other three time-periods were statistically different in the two groups. SDNN curves are shown in Figure7. Clinically, it is thought SDNN is related to both sympathetic and parasympathetic activity, and usually higher at night. By comparison, the highest SDNN for healthy controls appeared during 00.00–01.00 h, whereas the highest SDNN for diabetes patients appeared during 08.00–09.00 h. SDNN from healthy controls was higher, which indicated better function of the autonomic system.
Figure 7.
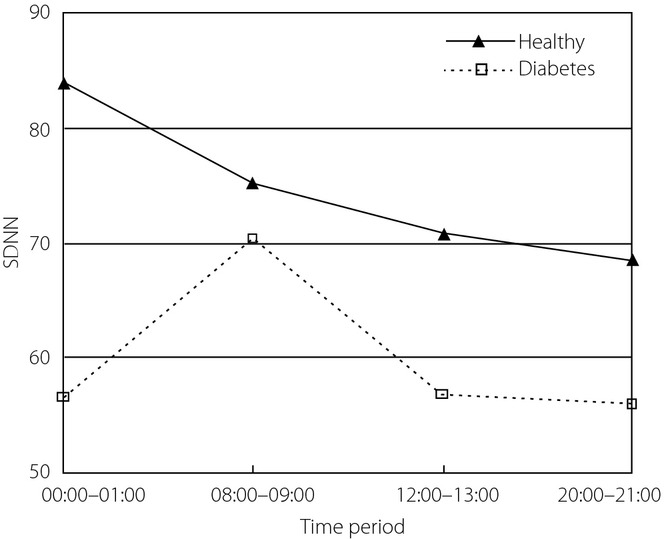
Standard deviation of the RR intervals (SDNN) of heart rate variability (HRV) in four time-periods from the two groups.
CVrr of HRV was analyzed, and Mauchly's test of sphericity showed the hypothesis was not true. After adjustment, CVrr from at least two different time-periods (P = 0.0001) were statistically different. No interaction existed between time-period and group (P = 0.252). Quadratic fitting was suitable (P < 0.0001). CVrr trends from the two groups were similar (P = 0.386), but the values from healthy controls were higher (Figure8). The CVrr values of two groups were statistically significantly different (P = 0.013). Clinically, it is generally thought that CVrr is related to the total autonomic system function. The results showed that autonomic system function of diabetes patients was worse.
Figure 8.
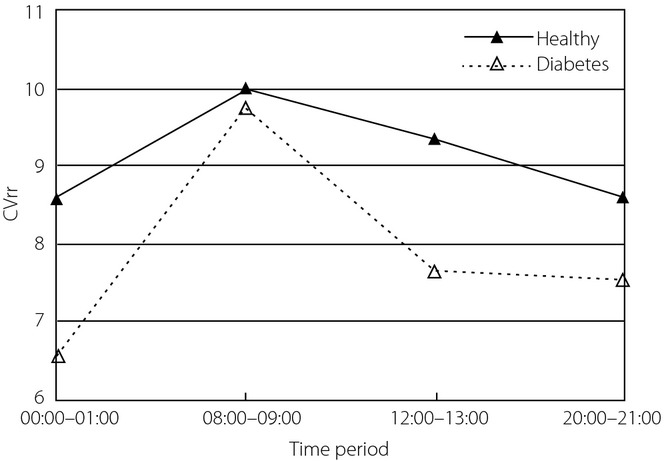
Coefficient of variance of RR intervals (CVrr) of heart rate variability in four time-periods from the two groups.
LHr of HRV from the two groups was statistically analyzed, and Mauchly's test of sphericity showed the hypothesis was true. It showed that ApEn values from four time-periods were not statistically significantly different (P = 0.292). There was an interaction between time-period and group (P = 0.001), so simple effects analysis was carried out. It showed in healthy controls, the LHr during 00.00–01.00 h was statistically different from that in the other three time-periods respectively; whereas in diabetes patients, LHr during 00.00–01.00 h was statistically different from that in 08.00–09.00 h. Except for 00.00–01.00 h, LHr in the other three time-periods were statistically different in the two groups. LHr values of HRV in the four time-periods from the two groups are shown in Figure9. Clinically, LHr reflects the balance of sympathetic and parasympathetic nerves. The LHr trends of the two groups were different, that from healthy controls appeared first rising then decreasing, whereas that from diabetes patients showed the opposite change.
Figure 9.
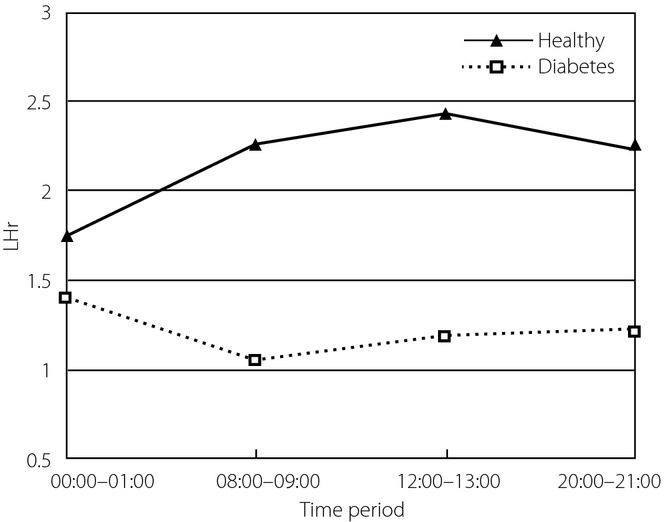
Ratio of low to high power of heart rate variability (LHr) in four time-periods from the two groups.
Discussion
Cardiac autonomic neuropathy (CAN) can occur early in the course of diabetes. Assessment of cardiac autonomic function is very important for patients with diabetes, as it contributes to the evaluation of cardiovascular risk. HRV analysis is one of the principal non-invasive methods for studying cardiac autonomic function. Because of the non-linear properties of HRV, non-linear methods are more suitable for analysis of HRV in time and frequency domains compared with conventional methods34–36.
Considering that different physiological information can be obtained from different frequency domains of HRV, in the present study, ApEn values were extracted from the total 24-h HRV, and four different frequency components with 1-h intervals, to analyze cardiac autonomic function in patients with diabetes.
We obtained results for four different frequency components (LF, HF, VLF and ULF) in healthy subjects and patients with diabetes. Comparing the ApEn curves from the two groups, the ApEN curve for the LF component was highest, meaning this component contained the most abundant complexity information. Because of this, we suggest that the LF component is likely to be the most suitable for extracting non-linear characteristics for analysis using non-linear dynamics theory. Clinically, therefore, this is also likely to be the most suitable component for studying cardiac autonomic function in patients with cardiovascular diseases. There was also some non-linear information contained in the HF and VLF components. The ULF component was the most regular and contained little complexity information, and was therefore not suitable for non-linear analysis.
Further comparative analysis found that ApEn from both the total HRV and VLF component were not significantly different in the two groups. However, there was a significant difference in ApEn both from LF and HF components between the two groups. This shows that after decomposition, it is likely that further non-linear information could be extracted from the LF and HF components, which would be more effective in distinguishing healthy individuals and patients with diabetes. ApEn curves from the LF and HF components of healthy controls were higher than those from diabetes patients, showing that the cardiovascular system of healthy controls contains more complex information, and the regulatory ability of the autonomic nervous system is stronger.
Both ApEn curves from the LF component of the two groups showed a trend of first rising then decreasing during the daytime period, which is in line with what would be expected in human physiology: during daytime hours, activity levels are greater, the sympathetic nervous system is dominant and cardiovascular system activity is more complicated. In comparison, the ApEn values from diabetes patients were lower and variability was larger, meaning that heart rate variability of diabetes patients is reduced, and sympathetic nervous system activity is weaker.
ApEn curves from the HF component showed that parasympathetic nervous system activity in healthy controls was more complicated. The ApEn curves from healthy controls were in accordance with the laws of physiology; that is, the parasympathetic nervous system dominated at night. However, the ApEn curve from diabetes patients was higher during daytime than at night, showing that there was some disorder in parasympathetic nervous system regulation.
From the four indices of 24-h HRV in the time and frequency domains, it could be seen that both SDNN and LHr from the healthy controls were in accordance with normal values of standard measures of HRV suggested by the Task Force of The European Society of Cardiology and The North American Society of Pacing and Electrophysiology in 199632. SDNN from the diabetes group was also in the normal domain, but significantly lower than the healthy controls. LHr from the diabetes group was obviously lower than the normal value. CVrr from the healthy group was obviously higher than that from the diabetes patients. rMSSD was not significantly different in the two groups, which was higher than the normal value. That possibly related to the chosen groups or other unknown reasons. Combined with the tendency analysis of three indices in four time-periods, it can be concluded that SDNN, LHr and CVrr of 24-h HRV all showed that the autonomic system function of diabetes patients was worse compared with healthy controls. There were some disorders of regulation capability of the sympathetic and parasympathetic nerves of diabetes patients. Three indices showed good consistency with ApEn in reflecting the autonomic system function of diabetes patients.
HRV is an important non-invasive tool for assessing the status of the autonomic nervous system. Different frequency components of HRV contain different specific information regarding regulation of the autonomic nervous system. ApEn values extracted from healthy controls and diabetes patients in the present study showed that analysis of subcomponents of HRV is likely to be able to extract information not detected through analysis of the total HRV. The present results showed that sympathetic function was reduced, and there was some disorder in parasympathetic function in the patients with diabetes we examined. This suggests that protecting the cardiovascular system of diabetes patients is as important as controlling blood glucose. Further studies on the non-linear analysis of different frequency components of HRV would be beneficial for exploring the physiological regulatory patterns of the cardiovascular autonomic system.
Acknowledgments
This work was supported by the National Natural Science Foundation of China (30873216), and the Importation and Development of High-Caliber Talents Project of Beijing Municipal Institutions (CIT&TCD201304186). The authors declare no conflict of interest.
References
- Vinik AI, Ziegler D. Diabetic cardiovascular autonomic neuropathy. Circulation. 2007;115:387–397. doi: 10.1161/CIRCULATIONAHA.106.634949. [DOI] [PubMed] [Google Scholar]
- Soedamah-Muthu SS, Chaturvedi N, Witte DR, et al. Relationship between risk factors and mortality in type 1 diabetic patients in Europe: the EURODIAB Prospective Complications Study (PCS) Diabetes Care. 2008;31:1360–1366. doi: 10.2337/dc08-0107. [DOI] [PMC free article] [PubMed] [Google Scholar]
- Pop-Busui R, Evans GW, Gerstein HC, et al. Effects of cardiac autonomic dysfunction on mortality risk in the Action to Control Cardiovascular Risk in Diabetes (ACCORD) trial. Diabetes Care. 2010;33:1578–1584. doi: 10.2337/dc10-0125. [DOI] [PMC free article] [PubMed] [Google Scholar]
- Schroeder EB, Chambless LE, Evans GW, et al. Diabetes, glucose, insulin, and heart rate variability. Diabetes Care. 2005;28:668–674. doi: 10.2337/diacare.28.3.668. [DOI] [PubMed] [Google Scholar]
- Mogensen UM, Jensen T, Køber L. Cardiovascular autonomic neuropathy and subclinical cardiovascular disease in normoalbuminuric type 1 diabetic patients. Diabetes. 2012;61:1822–1830. doi: 10.2337/db11-1235. [DOI] [PMC free article] [PubMed] [Google Scholar]
- Wang QZ, Lan QF, Zhang M, et al. Relationship of cardiovascular autonomic function to QT dispersion in patients with type 2 diabetes mellitus. Chin J Clin Rehabil. 2003;7:2184–2185. (Chinese) [Google Scholar]
- Ewing DJ, Martin CN, Young RJ, et al. The value of cardiovascular autonomic function tests: 10 years’ experience in diabetes. Diabetes Care. 1985;8:491–498. doi: 10.2337/diacare.8.5.491. [DOI] [PubMed] [Google Scholar]
- Astrup AS, Tarnow L, Hansen BV. Cardiac autonomic neuropathy predicts cardiovascular morbidity and mortality in type 1 diabetic patients with diabetic nephropathy. Diabetes Care. 2006;29:334–339. doi: 10.2337/diacare.29.02.06.dc05-1242. [DOI] [PubMed] [Google Scholar]
- Masaoka S, Lev-ran A, Hill LR, et al. Heart rate variability in diabetes: relationship to age and duration of the disease. Diabetes Care. 1985;8:64–68. doi: 10.2337/diacare.8.1.64. [DOI] [PubMed] [Google Scholar]
- Gandhi RA, Marques JLB, Emery CJ, et al. Painful diabetic neuropathy is associated with greater autonomic dysfunction than painless diabetic neuropathy. Diabetes Care. 2010;33:1585–1590. doi: 10.2337/dc09-2314. [DOI] [PMC free article] [PubMed] [Google Scholar]
- Liao D, Sloan RP, Liese AD, et al. Multiple metabolic syndrome is associated with lower heart rate variability. Diabetes Care. 1998;21:2116–2122. doi: 10.2337/diacare.21.12.2116. [DOI] [PubMed] [Google Scholar]
- Ari S, Äkimattila M, Nna A, et al. Predictors of abnormal cardiovascular autonomic function measured by frequency domain analysis of heart rate variability and conventional tests in patients with type 1 diabetes. Diabetes Care. 2000;23:1686–1693. doi: 10.2337/diacare.23.11.1686. [DOI] [PubMed] [Google Scholar]
- Jaiswal M, Urbina EM, Wadwa RP, et al. Reduced heart rate variability among youth with type 1 diabetes The SEARCH CVD study. Diabetes Care. 2013;36:157–162. doi: 10.2337/dc12-0463. [DOI] [PMC free article] [PubMed] [Google Scholar]
- Pop-Busui R. Cardiac autonomic neuropathy in diabetes: a clinical perspective. Diabetes Care. 2010;33:434–441. doi: 10.2337/dc09-1294. [DOI] [PMC free article] [PubMed] [Google Scholar]
- Wang Y, Deng J, Zhang Q, et al. Analysis of heart rate variability and blood pressure variability in 60 elderly patients of diabetes mellitus. Med Innov China. 2011;8:15–17. (Chinese) [Google Scholar]
- Kataoka M, Ito C, Sasaki H, et al. Low heart rate variability is a risk factor for sudden cardiac death in type 2 diabetes. Diabetes Res Clin Pract. 2004;64:51–58. doi: 10.1016/j.diabres.2003.10.009. [DOI] [PubMed] [Google Scholar]
- Gottsäter A, Ahlgren AR, Taimour S, et al. Decreased heart rate variability may predict the progression of carotid atherosclerosis in type 2 diabetes. Clin Auton Res. 2006;16:228–234. doi: 10.1007/s10286-006-0345-4. [DOI] [PubMed] [Google Scholar]
- Zhang J, Tu W, Dai J, et al. Dysfunction of pre- and post-operative cardiac autonomic nervous system in elderly patients with diabetes mellitus. Arch Gerontol Geriatr. 2011;53:334–337. doi: 10.1016/j.archger.2010.12.013. [DOI] [PubMed] [Google Scholar]
- Malpas SC, Maling TJB. Heart-rate variability and cardiac autonomic function in diabetes. Diabetes. 1990;39:1177–1181. doi: 10.2337/diab.39.10.1177. [DOI] [PubMed] [Google Scholar]
- Loimaala A, Huikuri HV, Koobi T, et al. Exercise training improves baroreflex sensitivity in type 2 diabetes. Diabetes. 2003;52:1837–1842. doi: 10.2337/diabetes.52.7.1837. [DOI] [PubMed] [Google Scholar]
- Fu YF, Bai J, Li FJ, et al. A novel CHD diagnostic method based on approximate entropy classification, Beijing. Biomed Eng. 2008;27:142–145. (Chinese) [Google Scholar]
- Guzzetti S, Mezzetti S, Magatelli R, et al. Linear and non-linear 24 h heart rate variability in chronic heart failure. Auton Neurosci. 2000;86:114–119. doi: 10.1016/S1566-0702(00)00239-3. [DOI] [PubMed] [Google Scholar]
- Molina-Picó A, Cuesta-Frau D, Miró-Martínez P, et al. Influence of QRS complex detection errors on entropy algorithms. Application to heart rate variability discrimination. Comput Methods Programs Biomed. 2013;110:2–11. doi: 10.1016/j.cmpb.2012.10.014. [DOI] [PubMed] [Google Scholar]
- Nikolopoulos S, Alexandridi A, Nikolakeas S, et al. Experimental analysis of heart rate variability of long-recording electrocardiograms in normal subjects and patients with coronary artery disease and normal left ventricular function. J Biomed Inform. 2003;36:202–217. doi: 10.1016/j.jbi.2003.09.001. [DOI] [PubMed] [Google Scholar]
- Guerra S, Boscari F, Avogaro A, et al. Hemodynamics assessed via approximate entropy analysis of impedance cardiography time series: effect of metabolic syndrome. Am J Physiol Heart Circ Physiol. 2011;301:H592–H598. doi: 10.1152/ajpheart.01195.2010. [DOI] [PubMed] [Google Scholar]
- Vigo DE, Dominguez J, Guinjoan SM, et al. Nonlinear analysis of heart rate variability within independent frequency components during the sleep – wake cycle. Auton Neurosci. 2010;154:84–88. doi: 10.1016/j.autneu.2009.10.007. [DOI] [PubMed] [Google Scholar]
- Vandeput S, Verheyden B, Aubert AE, et al. Nonlinear heart rate dynamics: circadian profile and influence of age and gender. Med Eng Phys. 2012;34:108–117. doi: 10.1016/j.medengphy.2011.07.004. [DOI] [PubMed] [Google Scholar]
- Corino VDA, Matteucci M, Cravello L, et al. Long-term heart rate variability as a predictor of patient age. Comput Methods Programs Biomed. 2006;82:248–257. doi: 10.1016/j.cmpb.2006.04.005. [DOI] [PubMed] [Google Scholar]
- Pivatelli FC, dos Santos MA, Fernandes GB. Sensitivity, specificity and predictive values of linear and nonlinear indices of heart rate variability in stable angina patients. Int Arch Med. 2012;5:31. doi: 10.1186/1755-7682-5-31. [DOI] [PMC free article] [PubMed] [Google Scholar]
- World Health Organization. Definition, diagnosis and classification of diabetes mellitus and its complication. Geneva: WHO; 1999. Report of a WHO consulation. Part1: Diagnosis and classification of diabetes mellitus. [Google Scholar]
- Pincus SM. Approximate entropy as a measure of system complexity. Proc Natl Acad Sci USA. 1991;88:2297–2301. doi: 10.1073/pnas.88.6.2297. [DOI] [PMC free article] [PubMed] [Google Scholar]
- Task Force of The European Society of Cardiology and The North American Society of Pacing and Electrophysiology. Heart rate variability: standards of measurement, physiological interpretation, and clinical use. Eur Heart J. 1996;17:354–381. [PubMed] [Google Scholar]
- Mauchly JW. Significance test for sphericity of n-variate normal populations. Ann Appl Stat. 1940;11:204–209. [Google Scholar]
- Goldberger AL. Goldberger. Is the normal heartbeat chaotic or homeostatic? Physiology. 1991;6:87–91. doi: 10.1152/physiologyonline.1991.6.2.87. [DOI] [PubMed] [Google Scholar]
- Guzzetti S, Signorini MG, Cogliati C, et al. Non-linear dynamics and chaotic indices in heart rate variability of normal subjects and heart-transplanted patients. Cardiovasc Res. 1996;31:441–446. [PubMed] [Google Scholar]
- Kanters JK, HØjgaard MV, Agner E, et al. Short- and long-term variations in non-linear dynamics of heart rate variability. Cardiovasc Res. 1996;31:400–409. [PubMed] [Google Scholar]