

Abstract
Gaucher disease, the most common lysosomal metabolic disorder, can be treated with enzyme replacement therapy (ERT). Recombinant human glucocerebrosidase imiglucerase (Cerezyme®), produced in Chinese hamster ovary cells, has been used for ERT of Gaucher disease for 20 years. Another recombinant glucocerebrosidase velaglucerase alfa (VPRIV), expressed in a human fibroblast cell line, was approved by the US Food and Drug Administration in 2010. The amino acid sequence difference at residue 495 of these two products is well documented. The overall N-linked qualitative glycan composition of these two products has also been reported previously. Herein, employing our recently developed approach utilizing isobaric tandem mass tag (TMT) labeling and an LTQ Orbitrap XL electron transfer dissociation (ETD) hybrid mass spectrometer, the site-specific glycoforms of these products were identified with ETD and collision-induced dissociation (CID) spectra. The quantitative comparison of site-specific glycans was achieved utilizing higher-energy collisional dissociation (HCD) spectra with a NanoMate used as both a fraction collector and a sample introduction device. From the trypsin-digested mixture of these two products, over 90 glycopeptides were identified by accurate mass matching. In addition to those previously reported, additional glycopeptides were detected with moderate abundance. The relative amount of each glycoform at a specific glycosylation site was determined based on reporter signal intensities of the TMT labeling reagents. This is the first report of site-specific simultaneous qualitative and quantitative comparison of glycoforms for Cerezyme® and VPRIV. The results demonstrate that this method could be utilized for biosimilarity determination and counterfeit identification of glycoproteins.
KEY WORDS: imiglucerase, quantitative comparison, site-specific glycoforms, velaglucerase alfa
INTRODUCTION
Glucocerebrosidase is a lysosomal hydrolase that catalyzes the hydrolysis of glycosylceramide to glucose and ceramide (1). Deficiency of the enzyme results in the accumulation of glycosylceramide in macrophages of the reticular endothelial system, giving rise to the lysosomal storage disease known as Gaucher disease (2). The most common treatment for Gaucher disease is enzyme replacement therapy (ERT), in which defective glucocerebrosidase is supplemented with an active enzyme. Imiglucerase (Cerezyme®), a recombinant analog of human glucocerebrosidase expressed in Chinese hamster ovary cells, has been available since 1994. Due to a cloning artifact that resulted in the encoding of a histidine residue instead of an arginine residue, the sequence of Cerezyme® differs from that of wild-type glucocerebrosidase by a single amino acid substitution at residue 495 (R495H) (3,4). In the summer of 2009, there was a global shortage of Cerezyme® for the treatment of Gaucher disease (5). This shortage led to either the interruption of treatment, dose reduction, or the starting of alternative treatments (6). In February 2010, velaglucerase alfa (VPRIV) was approved by the US Food and Drug Administration as a long-term enzyme replacement therapy for pediatric and adult patients with type 1 Gaucher disease. VPRIV is produced by gene activation technology in a human fibroblast cell line. In contrast to Cerezyme®, VPRIV contains the native human enzyme sequence (4). Previous studies have shown that the single amino acid difference between Cerezyme® and VPRIV does not impact the overall conformation of the molecule or its biological properties (7,8).
Protein glycosylation can potentiate biological activity, regulate the rate of clearance of the protein from the circulatory system, and influence the potential antigenicity of the protein (9–14). The glycoforms of therapeutic glycoproteins can potentially contribute to their efficacy, stability, and safety (15–22). Specifically, acidic glycans containing sialic acid, sulfate, or phosphate have well-known structural properties with specific functional roles in biological processes involving cellular uptake, elimination, and immunogenicity (23,24). Therefore, the presence or absence of acidic glycans and/or known immunogenic forms is often the basis for determining the critical quality attributes of therapeutic glycoproteins. These critical quality attributes require characterization and control from early product development through licensure and continual regulatory quality assessment.
Different production processes of Cerezyme® and VPRIV lead to changes in the overall glycan composition. Analysis of glycosylation patterns showed that VPRIV displayed distinctly different glycan structures from Cerezyme® (4,25,26). Global structural characterization of glycans, through either intact protein analysis (25) or total glycan release (4,26,27), indicated that the predominant glycan on VPRIV was a high-mannose type, with nine mannose units, while Cerezyme® contained a chitobiose tri-mannosyl core glycan with fucosylation. These differences in glycosylation affected cellular internalization. The rate of VPRIV internalization into human macrophages was at least twofold greater than that of Cerezyme® (4). Site-specific quantitative glycoform comparison is desired to better understand these functional differences. Due to the technical difficulty, the authors are unaware of any reports containing site-specific quantitative information for these two therapeutic glycoproteins.
Recently, our group developed a qualitative and quantitative glycoprotein characterization method using isobaric labeling and liquid chromatography-mass spectrometry (LC-MS) on an LTQ Orbitrap XL instrument with electron transfer dissociation (ETD) capabilities (28). Because a unique multiplexed isobaric tandem mass tag (TMT) is used for each sample, up to six samples can be compared side by side in a single experiment. This single sample setting eliminates quantitative errors caused by ionization efficacy and sample preparation differences between samples. While the method reported previously was developed using a model glycoprotein in the absence of excipients, herein we report the modification and adaptation of this method for the analysis of formulated glycoprotein therapeutics. Comprehensive structural comparisons of Cerezyme® and VPRIV with site-specific glycoform identification and relative quantification between these two therapeutic glycoproteins are presented. Given their known similarity in amino acid sequences and differences in glycan compositions, Cerezyme® and VPRIV provide a valuable example for demonstration of the application of the method due to the expected glycan profile variation related to changes in the expression system. Moreover, the technique has a practical role in the regulatory setting for determining the comparability to drug substance after a process change, biosimilarity between the material from different manufacturers, and perhaps in US marketplace surveillance for counterfeit or adulterated glycoprotein therapeutics.
MATERIALS AND METHODS
Sample Preparation
The six-plex Tandem Mass Tag reagent kit, Optima formic acid, and Optima LC-MS solvents were purchased from Fisher Scientific (Pittsburgh, PA). Mass spectrometry-grade trypsin was purchased from Promega (Madison, WI). The drug product Cerezyme® was provided by Genzyme Corporation (Lot A9031, Cambridge, MA). The drug product VPRIV was provided by Shire Human Genetic Therapies, Inc. (Lot FED10-016, Cambridge, MA). Cerezyme® and VPRIV were dissolved in LC-MS-grade water, aliquoted as 100 μg each, and dried under vacuum for storage at 4°C until use.
The isobaric labeling procedure provided by the TMT manufacturer (http://www.piercenet.com/instructions/2162073.pdf) was modified by increasing the triethylammonium bicarbonate buffer concentration from 0.2 to 0.5 M and decreasing the volume from 100 to 20 μL; denaturant (2% sodium dodecyl sulfate (SDS)) was reduced from 5 to 1 μL; the reducing step was omitted; the cysteine-blocking reagent iodoacetamide (5 μL of 375 mM) was replaced with 1 μL of 200 mM methyl methanethiosulfonate; and lastly, the TMT reagent was dissolved in 70 μL of absolute ethanol instead of 41 μL of anhydrous acetonitrile. Specifically, 1 μL of the denaturant (containing 2% SDS) was added to each sample tube containing up to 100 μg of protein and 20 μL of 0.5 M triethylammonium bicarbonate buffer (pH 8.5). Cysteine residues were alkylated with 1 μL of 200 mM methyl methanethiosulfonate at room temperature for 10 min. To each sample tube, 2.5 μL of trypsin solution (1.0 μg/μL) was added. Samples were vortexed and incubated at 37°C overnight (12 to 16 h). Immediately before use, TMT reagents were equilibrated to room temperature and 70 μL of absolute ethanol was added to dissolve the reagents. The content of one TMT reagent vial was transferred to one sample tube and incubated at room temperature for 55 min. The labeling reactions were quenched by adding 8 μL of 5% hydroxylamine and incubating at room temperature for 15 min. The samples labeled with different tags were combined, vacuum concentrated down to 10 μL with a SpeedVac, and diluted with 50 μL of 5% formic acid before LC-MS/MS analysis.
Liquid Chromatography-Mass Spectrometry
An LTQ Orbitrap XL mass spectrometer with ETD (Thermo Scientific, Bremen, Germany) coupled with an Agilent 1200 Series LC system consisting of a binary capillary-flow pump, a vacuum degasser, and a thermostated autosampler (Agilent Technologies, Inc., Palo Alto, CA, USA) was used for LC-MS/MS analysis. Isobarically labeled digests were separated with a Waters SunFire C18 column (2.1 × 150 mm, 3.5 μm). Typically, 10 μL of sample was injected. Gradient elution was performed from 5 to 45% acetonitrile with 0.1% formic acid over 30 min, holding at 45% for 2 min, then immediately increasing to 95% and holding for 10 min to wash the column before column equilibration at 5% acetonitrile for the next injection. A flow rate of 0.2 mL/min was used for all analyses. The eluent was split using a tee connected to a TriVersa NanoMate (Advion BioSciences, Inc., Ithaca, NY) nanospray source. At a flow rate of 450 nL/min, a portion of the sample was introduced into the MS through a LC chip coupler, while the majority of the eluent was collected into a 384-well plate at 10 s/well using a fraction-collecting mandrel. Spray voltages in the range of 1.35 to 1.6 kV and gas pressures between 0.2 and 0.4 psi were employed for both online MS and infusion of collected fractions. Based on the online chromatogram, the target fractions were infused for MS analysis followed by subsequent higher-energy collisional dissociation (HCD) and ETD of the selected precursors. Detailed MS settings and parameters were identical to those previously described (28). Briefly, in-source dissociation at 92 V generated characteristic oxonium ions at m/z 204 which were further fragmented by a dedicated MS3 event for highly sensitive and selective detection of the eluting glycosylated peptides (29). For online LC-MS analysis, high-resolution, accurate-mass full-scan MS spectra were acquired in the Orbitrap mass analyzer followed by data-dependent MS/MS analysis of collision-induced dissociation (CID), HCD, and ETD. The two most intense precursor ions were selected for MS/MS. Fragments were analyzed in either the Orbitrap (CID and HCD) or ion trap (ETD) mass analyzers. Dynamic exclusion was employed to increase peptide coverage using a repeat count of 1 for 20 s.
Data Processing
Qualitative data interpretation of glycopeptides was performed manually with the help of three programs. First, Thermo Scientific’s Xtract software was used to convert the raw data into singly charged monoisotopic spectra for easy interpretation of protonated molecular ions. Second, the experimental accurate mass of the protonated molecular ion was used to search possible oligosaccharide composition using GlycoMod from the Swiss-Prot website (30). Finally, ProSight PTM (31) (Northwestern University) was used for fragment ion prediction. The glycopeptide sequence and glycosylation sites were verified through these fragment ions. Identification of nonglycopeptides was done by accurate mass matching to theoretical peptides and verified with the MS/MS spectrum of each peptide. The spectra acquired online were used for qualitative comparison and identification only.
For quantitative analysis, triplicates of Cerezyme® and VPRIV with 100 μg protein each were labeled with six different TMTs and combined for LC-MS/MS analysis. Raw data files from direct infusion were processed using Qual Browser contained in Xcalibur (Thermo Scientific). Spectra from 50 to 100 scans were averaged to make a composite spectrum. The peak intensities for all TMT reagent reporter ion masses were extracted from the corresponding spectrum lists. The intensities were averaged for each set of triplicates, and the ratio of two sets was calculated as one data point.
RESULTS AND DISCUSSION
TMT Labeling Efficiency of the Drug Products
The reported labeling procedure was developed using commercially available fetuin without any excipients (28). To achieve an optimized labeling procedure for the drug products, different approaches were investigated. Cerezyme® and VPRIV were first labeled with TMTs with all excipients remaining and using the TMT manufacturer’s procedure (http://www.piercenet.com/instructions/2162073.pdf). It was found that only about 10% of digests were labeled (Table I section A and Fig. 1). To eliminate the possible labeling interference caused by excipients, acetone precipitation of proteins and filtration cleaning of the samples with Amicon Ultra centrifugation filters (MWCO 3000 Da, Millipore, Billerica, MA) were investigated. Difficulties were encountered with acetone precipitation. In most instances, proteins did not precipitate or had inconsistent precipitation recovery. When the drug products were cleaned by using Amicon filtration followed by cysteine reduction and alkylation, then digested and labeled with TMTs using the TMT manufacturer’s procedure, the labeling efficiency was improved but still very low (30%, Table I section B). This low labeling efficiency might be due to the presence of excess iodoacetamide which was used for cysteine alkylation. To reduce the iodoacetamide interference, samples were cleaned with Amicon filtration after cysteine reduction and alkylation, then digested and labeled for LC-MS analysis. The overall labeling efficiency was increased to about 70%. However, the filtration recovery of VPRIV was very low and incomparable with filtration recovery of Cerezyme®. When the same amounts of Cerezyme® and VPRIV were alkylated and then cleaned by filtration, digested, and labeled with TMT 130 and 131, respectively, the ion intensity of reporter group 130 was much higher than 131 (inset of Fig. 1b). Because the result represents the nonglycopeptide AA 75–77 which is conserved for Cerezyme® and VPRIV, the ion intensities of reporter groups 130 and 131 should be similar. This uneven filtration recovery made quantification unfeasible.
Table I.
Labeling Efficiency Comparison of Before and After Optimization of Labeling Procedure
| Peptides | Labeling efficiency before sample cleanup (A) | Labeling efficiency after sample cleanup (B) | Labeling efficiency after optimization (C) | ||||||
|---|---|---|---|---|---|---|---|---|---|
| Ion intensity of partially labeled (229.163 Da less) | Ion intensity of fully labeled | % labeling | Ion intensity of partially labeled (229.163 Da less) | Ion intensity of fully labeled | % labeling | Ion intensity of partially labeled (229.163 Da less) | Ion intensity of fully labeled | % labeling | |
| AA 8–39a (3,2,0)b | 1,675,726 | 260,091 | 13.4 | 1,604,070 | 575,950 | 26.4 | 260,858a | 8,057,668a | 96.9 |
| AA 49–74 (3,2,1) | 13,043,456 | 785,945 | 5.7 | 14,253,312 | 2,937,537 | 17.1 | 792,730 | 26,319,616 | 97.1 |
| AA 132–155 (3,2,1) | 18,621,440 | 1,710,586 | 8.4 | 18,299,392 | 8,967,680 | 32.9 | 794,813 | 15,292,672 | 95.1 |
| AA 263–277 (3,2,1) | 2,272,099 | 1,230,458 | 35.1 | 3,223,745 | 5,535,073 | 63.2 | 18,632 | 31,320,832 | 99.9 |
| AA 80–106 (0,0,0) | 21,135,360 | 3,361,900 | 13.7 | 35,056,640 | 13,302,272 | 27.5 | 8557 | 17,318,144 | 100.0 |
| AA 164–186 (0,0,0) | 28,327,680 | 11,603,456 | 29.1 | 41,220,608 | 22,489,600 | 35.3 | 100,314 | 13,955,840 | 99.3 |
aThe ion intensities of AA 1–39 for the optimized procedure since the protein was unreduced
bThe numbers of Hex, HexNAc, and Fuc presented in the glycopeptides
Fig. 1.
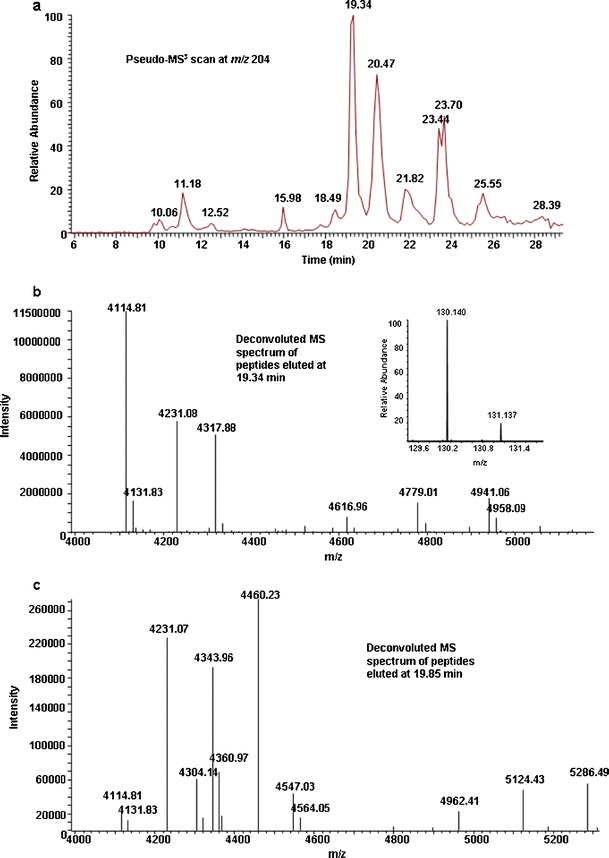
Pseudo-MS3 scan of Cerezyme/VPRIV digest at m/z 204 (a) and deconvoluted full-scan MS spectra at an elution time of 19.34 min (b) and 19.85 min (c). Cysteine was blocked with iodoacetamide. The main component eluted at 19.34 min (m/z 4114.81) is the partially labeled glycopeptide AA 132–155 (Hex3HexNAc2Fuc) whereas the fully labeled same glycopeptide (m/z 4343.96) was eluted at 19.85 min. The mass difference is 229.15 Da. The poor labeling efficiency can be seen from their absolute ion intensities
To further improve the labeling efficiency in the presence of excipients, the TMT manufacturer’s labeling procedure was modified as described in the “MATERIALS AND METHODS” section under “Sample Preparation.” These modifications were based on results from our previously reported investigation (28). Table I lists the labeling efficiency of different procedures. As indicated in the table, with our modified procedure, greater than 95% (Table I section C) of peptides were labeled, demonstrating that the method was suitable for both identification and quantification.
Direct Qualitative Comparison of Cerezyme® and VPRIV
Because the expected disulfide bonds in the two products span relatively short distances (between C4 and C16 and between C18 and C23, respectively) (32), characterization was performed without disulfide bond reduction. More glycopeptides were observed if the reduction step was omitted.
Because isobaric TMT labeling was performed after trypsin digestion of the protein samples, all peptides including both glycopeptides and nonglycopeptides were labeled. The same amounts of Cerezyme® and VPRIV (based on drug products’ label claim) were labeled with different TMTs separately then mixed together for LC-MS analysis. A method with eight events, i.e., high-resolution, accurate-mass full-scan MS acquisition with the Orbitrap mass analyzer followed by data-dependent MS/MS alternating CID, HCD, and ETD scans for the two most intense ions, as well as in-source dissociation at 92 V for glycopeptide detection, was performed for a quick comparison of these two drugs. The MS/MS fragments were analyzed on either the Orbitrap (CID and HCD) or ion trap (ETD) mass analyzers. The total experimental time for all eight events was approximately 6 s. Figure 2a shows a typical full-scan MS base peak chromatogram for all TMT-labeled glycopeptides and nonglycopeptides of the Cerezyme®/VPRIV digests. Figure 2b is the in-source pseudo-MS3 survey scan at m/z 204, which indicates the elution of glycopeptides. For a quick drug similarity comparison, HCD spectra under an investigated peak were examined for their reporter peak intensities. If two drugs have the same amino acid sequence and glycan composition, the reporter peak intensities of different tags for all precursor ions should be similar even though different TMTs were used for different drugs. Figure 2c, d shows a couple of examples. In this experiment, three Cerezyme® samples (100 μg each from the same vial) were labeled with TMTs 126, 128, and 130; three VPRIV samples (100 μg each from the same vial) were labeled with TMTs 127, 129, and 131. All six samples were mixed together for LC-MS analysis. In Fig. 2c, the peak intensities for all six tags are comparable, which means that the peptide with precursor ion at m/z 566.3 is conserved for both drugs. In fact, this is peptide AA 409–413 which is a nonglycopeptide with an identical amino acid sequence for both drugs. In contrast, in Fig. 2d, the reporter peak intensities of tags 126, 128, and 130 are similar to each other but much weaker than those from the group of tags 127, 129, and 131. This implies that the peptide with the precursor ion at m/z 1364.3 is mainly from VPRIV. This 5453.3-Da glycopeptide (AA 132–155) contains the glycan Phos1Hex9HexNAc3 (Table II), which is consistent with the previous report that the predominant glycan on VPRIV is a high-mannose or phosphorylated high-mannose type (4). Therefore, a rapid examination of HCD spectra can provide a similarity screen of up to six drugs since six distinguishable TMTs are available.
Fig. 2.
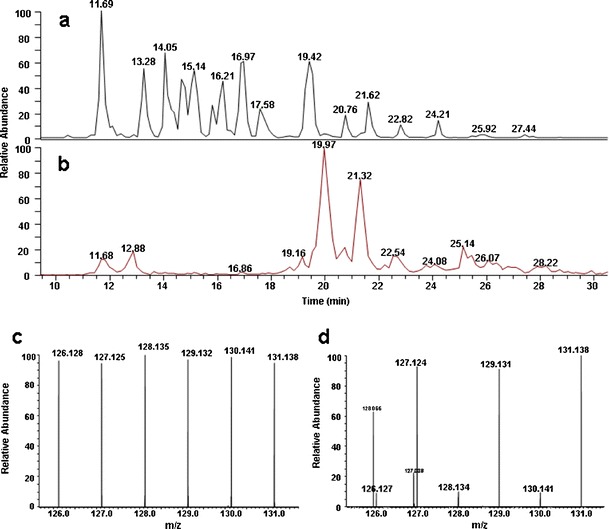
Direct qualitative comparison between Cerezyme® and VPRIV using online HCD spectra. A typical full-scan MS base peak chromatogram for all modified and unmodified peptides is shown in (a), and the extracted ion chromatogram for glycopeptides of Cerezyme®/VPRIV digest is illustrated in (b). Panel (c) is an HCD spectrum of the report region for the nonglycopeptide AA 409–413 at m/z 566.3. Panel (d) is an HCD spectrum of the report region for the glycopeptide AA 132–155 at m/z 1364.3 which is mainly presented in VPRIV
Table II.
Glycopeptides and Corresponding Glycoforms Identified by Accurate Mass and Relatively Quantified Between Cerezyme® and VPRIV from TMT Labeled Tryptic Digests
| Peptides with glycan composition (peptide position) | Theoretical mass [M + H]+ | Experimental mass [M + H]+ e | Mass error (ppm) | Cerezyme® to VPRIV ratio | % RSD |
|---|---|---|---|---|---|
| bARPCIPbK bSFGYSSVVCVCaNA-TYCDSFDPPTFPALGTFSR (AA 1-39)c | |||||
| Hex3HexNAc2 (2.23%)d | 5797.73086 | 5797.73122 | +0.06 | 307.0 | 2.0 |
| Hex3HexNAc3 (0.04%) | 6000.81026 | 6000.82624 | +2.66 | ∞f | |
| Hex8HexNAc2 (0.05%) | 6607.99482 | 6607.98159 | - 2.00 | 0.009 | 7.0 |
| Hex9HexNAc2 (0.32%) | 6770.04762 | 6770.04194 | - 0.84 | 0.001 | 10.9 |
| Hex3HexNAc2Fuc1 (0.01%) | 5943.78872 | 5943.79316 | +0.75 | 183.3 | 6.4 |
| Phos1Hex5HexNAc2 (0.01%) | 6201.80272 | 6201.80390 | +0.19 | 229.1 | 9.5 |
| Phos1Hex6HexNAc2 (0.19%) | 6363.85552 | 6363.85480 | - 0.11 | 56.6 | 5.5 |
| Phos1Hex6HexNAc3 (0.08%) | 6566.93492 | 6566.93586 | +0.14 | 70.2 | 11.2 |
| Phos1Hex9HexNAc2 (0.03%) | 6850.01392 | 6850.00410 | - 1.43 | 0.0f | |
| bMELSMGPIQAaNHTGTGLLLTLQPEQbK (AA 49-74) | |||||
| Hex4HexNAc2 (0.53%) | 4320.13880 | 4320.14550 | +1.55 | ∞ | |
| Hex5HexNAc2 (0.15%) | 4482.19160 | 4482.20181 | +2.28 | ∞ | |
| Hex6HexNAc2 (0.12%) | 4644.24440 | 4644.25393 | +2.05 | 0.03 | 9.2 |
| Hex7HexNAc2 (0.40%) | 4806.29720 | 4806.28969 | - 1.56 | 0.01 | 12.6 |
| Hex8HexNAc2 (1.05%) | 4968.35000 | 4968.34507 | - 0.99 | 0.0 | |
| Hex9HexNAc2 (1.61%) | 5130.40280 | 5130.39985 | - 0.58 | 0.0 | |
| Hex3HexNAc2Fuc1 (7.14%) | 4304.14390 | 4304.14347 | - 0.10 | 781.3 | 2.9 |
| Hex3HexNAc3Fuc1 (0.07%) | 4507.22330 | 4507.21694 | - 1.41 | ∞ | |
| Phos1Hex5HexNAc2 (0.07%) | 4562.15790 | 4562.15932 | +0.31 | ∞ | |
| Phos1Hex7HexNAc2 (0.03%) | 4886.26350 | 4886.25796 | - 1.13 | 0.04 | 6.7 |
| Phos1Hex8HexNAc2 (0.14%) | 5048.31630 | 5048.31264 | - 0.72 | 0.0 | |
| Phos1Hex9HexNAc2 (0.33%) | 5210.36910 | 5210.37368 | +0.88 | 0.0 | |
| Phos1Hex8HexNAc3 (0.05%) | 5251.39570 | 5251.39126 | - 0.85 | 0.0 | |
| bTYTYADTPDDFQLHaNFSLPEEDTbK (AA 132-155) | |||||
| Hex6HexNAc2 (0.13%) | 4684.06460 | 4684.05927 | - 1.14 | 0.04 | 8.4 |
| Hex7HexNAc2 (0.84%) | 4846.11740 | 4846.12430 | +1.42 | 0.003 | 10.2 |
| Hex8HexNAc2 (2.03%) | 5008.17020 | 5008.17641 | +1.24 | 0.001 | 10.9 |
| Hex9HexNAc2 (3.50%) | 5170.22300 | 5170.22719 | +0.81 | 0.0 | |
| Hex3HexNAc2Fuc1 (3.80%) | 4343.96410 | 4343.96979 | +1.31 | 1077.2 | 7.1 |
| Hex3HexNAc3Fuc1 (2.44%) | 4547.04350 | 4547.04848 | +1.10 | 398.8 | 10.2 |
| Hex3HexNAc4Fuc1 (0.26%) | 4750.12290 | 4750.12861 | +1.20 | 66.1 | 9.0 |
| Phos1Hex5HexNAc2 (0.31%) | 4601.97810 | 4601.97963 | +0.33 | ∞ | |
| Phos1Hex6HexNAc2 (0.38%) | 4764.03090 | 4764.03286 | +0.41 | ∞ | |
| Phos1Hex5HexNAc3 (0.08%) | 4805.05750 | 4805.04555 | - 2.49 | 196.1 | 8.9 |
| Phos1Hex7HexNAc2 (0.06%) | 4926.08370 | 4926.08999 | +1.28 | 0.0 | |
| Phos1Hex6HexNAc3 (0.15%) | 4967.11030 | 4967.11147 | +0.24 | 48.4 | 9.9 |
| Phos1Hex8HexNAc2 (0.33%) | 5088.13650 | 5088.14161 | +1.00 | 0.0 | |
| Phos1Hex9HexNAc2 (0.90%) | 5250.18930 | 5250.19448 | +0.99 | 0.001 | 10.3 |
| Phos1Hex9HexNAc3 (0.29%) | 5453.26870 | 5453.25942 | - 1.70 | 0.0 | |
| Neu5Ac1Hex4HexNAc3Fuc1 (0.22%) | 5000.19170 | 5000.19780 | +1.22 | 246.4 | 10.4 |
| Neu5Ac1Hex4HexNAc4Fuc1 (0.22%) | 5203.27110 | 5203.25796 | - 2.53 | 77.0 | 8.9 |
| Neu5Ac1Hex6HexNAc3Fuc1 (0.15%) | 5324.29730 | 5324.29700 | - 0.06 | 0.008 | 11.6 |
| bDLGPTLANSTHHaNVR (AA 263-277) | |||||
| Hex4HexNAc2 (0.04%) | 2915.35766 | 2915.35171 | - 2.04 | 90.7 | 5.5 |
| Hex5HexNAc2 (0.02%) | 3077.41046 | 3077.41347 | +0.98 | 14.9 | 9.4 |
| Hex6HexNAc2 (0.05%) | 3239.46326 | 3239.45952 | - 1.15 | 0.002 | 11.6 |
| Hex7HexNAc2 (0.53%) | 3401.51606 | 3401.50918 | - 2.02 | 0.001 | 7.9 |
| Hex8HexNAc2 (1.88%) | 3563.56886 | 3563.56113 | - 2.17 | 0.0002 | 9.3 |
| Hex9HexNAc2 (3.62%) | 3725.62166 | 3725.61513 | - 1.75 | 0.0 | |
| Hex3HexNAc2Fuc1 (4.98%) | 2899.36276 | 2899.35836 | - 1.52 | 475.1 | 9.2 |
| Hex3HexNAc3Fuc1 (0.87%) | 3102.44216 | 3102.43447 | - 2.48 | 429.0 | 7.5 |
| Hex3HexNAc4Fuc1 (0.05%) | 3305.52156 | 3305.51673 | - 1.46 | 5.0 | 8.9 |
| Hex5HexNAc3Fuc1 (0.01%) | 3426.54776 | 3426.54189 | - 1.71 | 11.6 | 10.7 |
| Phos1Hex5HexNAc2 (1.75%) | 3157.37676 | 3157.37958 | +0.89 | 450.0 | 7.2 |
| Phos1Hex6HexNAc2 (1.78%) | 3319.42956 | 3319.43292 | +1.01 | 864.6 | 7.5 |
| Phos1Hex5HexNAc3 (0.41%) | 3360.45616 | 3360.45909 | +0.87 | ∞ | |
| Phos1Hex7HexNAc2 (0.26%) | 3481.48236 | 3481.48379 | +0.41 | 0.02 | 11.3 |
| Phos1Hex6HexNAc3 (0.89%) | 3522.50896 | 3522.51182 | +0.81 | 1195.1 | 7.2 |
| Phos1Hex8HexNAc2 (0.82%) | 3643.53516 | 3643.53889 | +1.02 | 0.0004 | 10.0 |
| Phos1Hex9HexNAc2 (1.27%) | 3805.58796 | 3805.59047 | +0.66 | 0.0003 | 7.0 |
| Phos1Hex8HexNAc3 (0.32%) | 3846.61456 | 3846.61489 | +0.09 | 0.0 | |
| Phos1Hex9HexNAc3 (0.75%) | 4008.66736 | 4008.66980 | +0.61 | 0.0 | |
| Neu5Ac1Hex4HexNAc3Fuc1 (0.19%) | 3555.59036 | 3555.59262 | +0.64 | ∞ | |
| Neu5Ac1Hex4HexNAc4Fuc1 (0.15%) g | 3758.66976 | 3758.67104 | +0.34 | ∞ | |
| Neu5Ac1Hex6HexNAc3Fuc1 (0.13%) | 3879.69596 | 3879.69521 | - 0.19 | 0.0 | |
| Neu5Ac1Hex5HexNAc4Fuc1 (0.03%) | 3920.72256 | 3920.71792 | - 1.18 | 0.07 | 9.3 |
| Neu5Ac2Hex5HexNAc4Fuc1 (0.02%) | 4211.81796 | 4211.82115 | +0.76 | 0.01 | 11.8 |
aGlycosylation sites
bTMT labeling sites
cPeptide position
dRelative to most abundant peptide
eThe experimental mass [M + H]+ was calculated using Xtract, including mass of labeling reagent
fThe ∞ represents non-detectable ions from VPRIP and 0.0 represents non-detectable ions from Cerezyme®
gThis peptide was illustrated in Figures 3 and 4
Peptide Identification Using Accurate Mass Match
In the drug digest mixture, some peptides, especially glycopeptides, are present in very low abundance. These peptides are not readily detected (selected) by online alternating CID/HCD/ETD scans of TMT-labeled peptides. To examine the drugs Cerezyme® and VPRIV in detail, the high-resolution MS spectra under each elution peak were deconvoluted with Thermo Scientific’s software Xtract. The resulting monoisotopic masses were used to identify the peptides by either mass matching to theoretically predicted peptide masses or using residue glycan masses (subtracting TMT and amino acid masses from the mass of the peptide (28)) to obtain possible glycan compositions through GlycoMod. Various glycoforms at each glycosylation site were tentatively assigned based on their accurate masses. The data identified all glycosylation sites as occupied. Some of the identified glycopeptides are listed in Table II which demonstrates the detailed site-specific glycan heterogeneity. The mass accuracy for all the glycoforms identified was better than 3 ppm. The observed forms were in good agreement with those previously reported although more glycopeptides were identified in the current study (4,26). The relative abundance of some glycoforms was as low as 0.01% of the base peak; however, the excellent mass accuracy offered by the LTQ Orbitrap XL instrument resulted in high confidence in the assigned chemical compositions for these glycoforms. As many as 93 glycopeptides were identified during online MS analysis of the tryptic digest mixture of Cerezyme® and VPRIV. Using accurate mass matching, all nonglycopeptides (except three single amino acids) were identified. The sequence coverage was 99%. All these glycopeptides and nonglycopeptides were verified with online CID MS/MS spectra and offline direct infusion ETD MS/MS spectra as described in the following sections.
Glycosylation Site Mapping by Using ETD
Accurate mass matching is a tool for glycopeptide identification which is normally performed manually. For more confident characterization, the amino acid sequence and glycosylation site were verified using ETD fragmentation data. The relative abundance of some glycopeptides was very low. To obtain a high-quality ETD spectrum, eluted fractions were collected every 10 s with a TriVersa NanoMate while online chromatograms, full-scan MS, and MS/MS were recorded. Since the glycopeptides’ elution could be detected by the in-source pseudo-MS3 survey scan at m/z 204 as described earlier, those targeted fractions were infused using the TriVersa NanoMate. More details regarding ETD acquisition conditions have been described previously (28).
Figure 3 shows an example of an ETD spectrum of the +4 charge state precursor ion at m/z 940.4 for glycopeptide AA 263–277 with an N-linked glycan Neu5Ac1Hex4HexNAc4Fuc1 at position 270. Because ETD preserves labile post-translational modifications (PTMs), it allows for not only the identification of the glycopeptide amino acid sequence but also the assignment of its glycosylation sites. For this glycopeptide, a large number of c ions and z· ions were detected. The glycosylation site was clearly determined at position 270 and the peptide sequence was identified with a series of c/z· ions. The masses of these c/z· ions were confirmed with ProSight PTM (31). The glycopeptides present at very low abundances produced good-quality ETD spectra and were identified with this method, as a result of the HPLC separation and TriVersa fraction collection to enrich the glycopeptides, allowing for numerous scans to be averaged to improve the ETD spectral quality. As shown in Table II, the glycopeptide presented in Fig. 3 is mainly from Cerezyme® and has a relative abundance of 0.15%. Some identified glycopeptides are at a relative abundance of 0.01% compared to the base nonglycopeptide peak (AA 294–303) and still feature high-quality ETD spectra. All glycopeptides listed in Table II were confirmed by ETD spectral analysis.
Fig. 3.
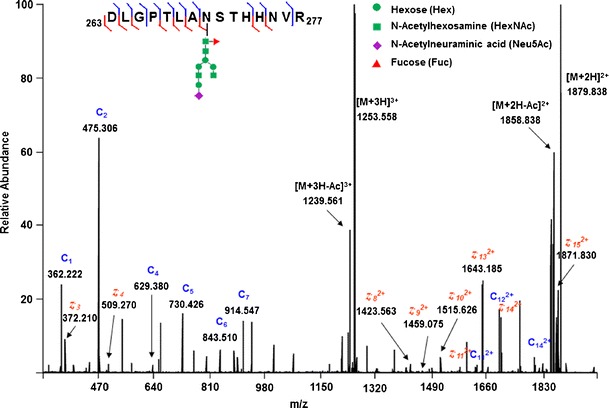
The ETD spectrum of the +4 charge state precursor ion at m/z 940.4, which corresponds to the glycopeptide AA 263–277 with an N-linked glycan Neu5Ac1Hex4HexNAc4Fuc1 at position 270 labeled with TMT. Most of the c ions and z · ions were detected, and the glycosylation site was clearly identified at position 270. The peptide sequence was identified with a series of c/z · ions
Glycan Sequencing by Using CID
CID has limitations for determining glycosylation sites due to the labile nature of the glycan attachment to the peptide. CID predominantly generates fragment ions from the cleavage of glycosidic bonds without breaking amide bonds. Therefore, CID of glycopeptides does not provide any peptide sequence information but is suitable for elucidating the oligosaccharide sequence (29,33,34). Figure 4a shows the raw full-scan MS/MS spectrum of the +4 charge state precursor ion of a glycoform from glycopeptide AA 263–277 at m/z 940.4 (the same glycopeptide as discussed in the previous section). Figure 4b shows the same CID spectrum as that shown in Fig. 4a but interpreted with Xtract and shown with monoisotopic masses. All peaks were assigned to the corresponding fragments. All measured masses were within 2 ppm of their theoretical values, which allowed for an unambiguous assignment of the glycan sequence. Here, the term “glycan sequence” refers to the monosaccharide connecting order and does not imply alpha/beta linkages.
Fig. 4.
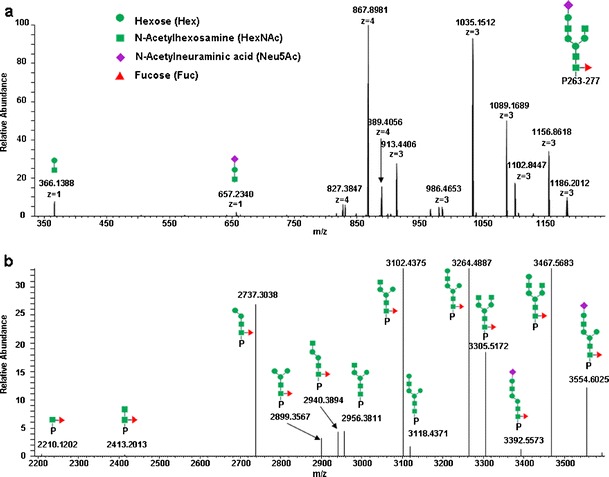
The CID spectrum of the +4 charge state precursor ion at m/z 940.4, which corresponds to the glycopeptide AA 263–277 with an N-linked glycan Neu5Ac1Hex4HexNAc4Fuc1 at position 270 labeled with TMT (the same glycopeptide as shown in Fig. 3). Panel (a) is a raw CID spectrum and (b) is the same spectrum deconvoluted with Xtract. All peaks were assigned with corresponding fragments
The sensitivity of CID is much higher than ETD. The quality of online data-dependent CID MS/MS spectra is sufficient for glycan sequence elucidation. The CID spectra of all 93 identified glycopeptides were acquired by online data-dependent MS/MS and/or through infusion of collected fractions and used to verify these peptides.
Quantitative Site-Specific Glycoform Comparison of Cerezyme® and VPRIV Using HCD
The HCD spectra acquired through online alternating CID/HCD/ETD scans of TMT-labeled peptides are the average of a few scans. They can be used for quick qualitative comparison between samples as discussed in previous sections. However, the spectral quality is not adequate for quantification, especially for low-abundance glycopeptides (28). High-quality HCD spectra and consistent reporter signals were obtained with the help of the TriVersa NanoMate. The target fractions were infused using the TriVersa, and 50–100 scans were averaged to obtain consistent reporter signals with very low noise. The quantification error and precision as well as HCD acquisition conditions were extensively investigated and described in our previous publication (28). As reported previously, the quantification error for both nonglycopeptides and glycopeptides was less than 9% with RSD less than 10%. In the current study, 100.0 μg each of three Cerezyme® samples and three VPRIV samples were labeled with six different TMTs and combined for LC-MS/MS analysis. The peak intensities of the reporter ions for nonglycopeptides and glycopeptides were extracted as described in the “Data Processing” section, and the results from triplicates were averaged as one experimental data point. The labeling experiment was repeated and LC-MS/MS was performed twice for each labeled sample mixture. All four data points were combined and presented in Table II.
All 93 glycopeptides identified during online MS analysis were subsequently located in corresponding fractions. However, some of these glycopeptides could not be quantified due to their low abundance. Table II shows the results for all quantified glycopeptides using direct infusion. Although the glycopeptides at relative abundances as low as 0.01% could be quantified, more abundant glycopeptides resulted in stronger reporter ion signals and were quantified more accurately. When abundance was less than 0.01%, the reporter signals were determined to be too weak for quantification. The Cerezyme to VPRIV ratios reported in Table II were obtained from the reporter ion signals from Cerezyme and VPRIV. In some cases, the reporter ion signals were not detectable because those glycopeptides were only present in one drug species. When a glycopeptide species was present in only one drug product, a default value of “1” was used as peak intensity for the nondetectable signals in order to estimate the ratios. In the rare cases when glycopeptides were detected at a very low abundance, causing the intensity of the reporter ion signal from the detectable drug to be less than 100 counts, a default value of “0.5” was used for the nondetectable signals to estimate the relative ratios. Lastly, when more than two out of four data points (from replicate experiments) resulted in nondetectable signals, the Cerezyme® to VPRIV ratio of that glycopeptide was listed as “∞” or “0.” These extreme ratio values could be used to identify which glycoform was associated with only one glycoprotein drug and not the other instead of providing a measure of the relative amounts between the two drugs. Reporter signal intensities ranged from 1x10³ to 6x10⁵ and 6x10³ to 2x10⁷ for most glycopeptides and nonglycopeptides, respectively. Because relative amounts (signal intensities) within a sample preparation for a specific precursor were determined using HCD fragmentation, fluctuation of instrument conditions would not significantly affect the final results. In addition, one peptide spreading between two fraction wells or one well containing multiple peptides may lead to a reduction in precursor signal, but will not alter the overall results. In some cases, for very low abundant glycopeptides, MS spectra were acquired from adjacent wells so that the sample from the more concentrated well fraction could be identified and used for MS/MS.
Most results presented here are consistent with previous reports, i.e., the predominant glycan on VPRIV is a high-mannose type while Cerezyme® contains a chitobiose tri-mannosyl core glycan with fucosylation (4,25,26). The glycans presented in Figs. 3 and 4, along with another Neu5Ac-containing glycan, Neu5Ac1Hex4HexNAc3Fuc1, were clearly identified as N-linked Cerezyme® glycans as verified with the Cerezyme® to VPRIV ratios in Table II. Additional three sialic acid-containing glycans including Neu5Ac1Hex6HexNAc3Fuc1 were found as N-linked VPRIV glycans. In addition, attachment of N-linked glycan Phos1Hex6HexNAc2 at position Asn270 was reported for both Cerezyme® and VPRIV (4). It was found on Cerezyme® only as shown in Table II. On the other hand, glycan Hex3HexNAc4Fuc1 on Asn270 was reported for Cerezyme® only, but was detected on both Cerezyme® and VPRIV with a ratio of 5.0. Differences identified in this study were based on analysis of one lot of each drug product. Further studies are needed to determine whether these variations are within batch to batch or lot to lot variability of each of the drug products.
The intensity of reporter signals for nonglycopeptides was much stronger than for glycopeptides, as reported and discussed previously (28,35). All nonglycopeptides were easily quantified. Some examples are listed in Table III. As expected, because Cerezyme® and VPRIV have similar amino acid sequences (except for position 495) the reporter signals of both groups were similar as shown in Fig. 2c. The Cerezyme® to VPRIV ratios were close to 1.0 within experimental error. The single amino acid difference at position 495, with a histidine in Cerezyme® and an arginine in VPRIV, was identified by the Cerezyme® to VPRIV ratios of two distinct peptides. In Table III, the peptide AA 474–496 was from Cerezyme® with a ratio of 83.5 while the peptide AA 474–495 was from VPRIV with a ratio of 0.011. Using this TMT/HCD methodology, a site-specific glycan can be identified and an amount relative to a standard can be determined by using reporter peak intensities.
Table III.
Mass Accuracy of Representative Nonglycopeptides and Their Relative Quantification Between Cerezyme® and VPRIV
| Nonglycopeptides | Abundancec (%) | Theoretical mass [M + H]+ | Experimental mass [M + H]+d | Mass error (ppm) | Cerezyme® to VPRIV ratio | % RSD |
|---|---|---|---|---|---|---|
| aYESTR (AA 40–44)b | 21.72 | 884.46751 | 884.46383 | −4.16 | 1.07 | 1.0 |
| aFQaK (AA 75–77) | 75.24 | 880.56564 | 880.56297 | −3.03 | 1.05 | 2.4 |
| aVaK (AA 78–79) | 0.75 | 704.50704 | 704.50621 | −1.18 | 0.97 | 0.7 |
| aLaK (AA 156–157) | 4.14 | 718.52274 | 718.52148 | −1.75 | 1.13 | 0.8 |
| aIPLIHR (AA 158–163) | 17.42 | 977.64571 | 977.64274 | −3.04 | 1.10 | 2.2 |
| aGSLaK (AA 195–198) | 63.49 | 862.57624 | 862.57494 | −1.51 | 1.10 | 3.5 |
| aDFIAR (AA 258–262) | 59.07 | 850.49841 | 850.49578 | −3.09 | 1.13 | 2.4 |
| aLLMLDDQR (AA 278–285) | 87.93 | 1232.68701 | 1232.68340 | −2.93 | 1.08 | 0.7 |
| aVVLTDPEAAaK (AA 294–303) | 100.00 | 1500.90374 | 1500.90051 | −2.15 | 0.95 | 0.8 |
| aATLGETHR (AA 322–329) | 1.22 | 1113.62141 | 1113.61809 | −2.98 | 0.95 | 2.2 |
| aLGSWDR (AA 354–359) | 31.00 | 962.52571 | 962.52330 | −2.50 | 0.90 | 0.6 |
| aDTFYaK (AA 409–413) | 88.56 | 1131.64504 | 1131.64372 | −1.17 | 1.05 | 0.5 |
| aFIPEGSQR (AA 426–433) | 98.49 | 1162.64181 | 1162.63877 | −2.61 | 1.07 | 2.6 |
| aDPAVGFLETISPGYSIHTYLWR | ||||||
| (AA 474–495 of VPRIV) | 0.20 | 2751.43431 | 2751.43593 | +0.59 | 0.011 | 12.1 |
| aDPAVGFLETISPGYSIHTYLWHR | ||||||
| (AA 474–496 of Cerezyme®) | 0.07 | 2888.49322 | 2888.49672 | +1.21 | 83.52 | 10.3 |
aTMT labeling sites
bPeptide position
cRelative to most abundant peptide
dThe experimental mass [M + H]+ was calculated using Xtract, including mass of the labeling reagent
CONCLUSIONS
In this study, the complete characterization of two glycoprotein drug products, including the identification of amino acid sequences, glycosylation sites, site-specific glycan sequences, as well as quantification, was performed. The TMT labeling approach used in combination with an LTQ Orbitrap XL hybrid mass spectrometer with ETD capable of alternating CID, ETD, and HCD spectral acquisition was successfully applied to analyze the glycoprotein therapeutics Cerezyme® and VPRIV at a quantitative level. As claimed, amino acid sequences for the two products were determined to be the same except at residue 495 with a histidine for Cerezyme® and an arginine for VPRIV. In agreement with previously reported results (4), VPRIV contains longer chain and high-mannose glycans which greatly differ from the core tri-mannose structure of Cerezyme® glycans. It was further demonstrated in this study that most glycoforms only belong to Cerezyme® or VPRIV while a few glycoforms are present in both products, such as Hex3HexNAc4Fuc1, Hex5HexNAc3Fuc1 at position Asn270. In addition, there are some predominant glycoforms for each product with high relative abundance compared to the base peptide peak. Berg-Fussman et al. reported that the occupancy of glycosylation sites and glycan structure of glucocerebrosidase significantly affected its enzymatic activity (22). These predominant glycoform differences between the two products may contribute to the reported cellular uptake increase of VPRIV over Cerezyme® (4). Glycoforms at very low abundance (0.01% of base peak) were also unambiguously identified and quantified. This is a crucial feature of this method since the capability to detect trace levels of undesired glycoforms is critical for chronic use therapies where 20 mg or more of a recombinant protein may be administered. With such large doses in chronic administration, the patients are very likely to be exposed to a greater level of any unfavorable variants presented in the drug.
The quantitative site-specific glycoform determination reported here demonstrates a pathway for comprehensive characterization of glycoprotein therapeutics. Glycosylation has become increasingly important as manufacturers attempt to modify and alter glycosylation to optimize biological activity and tissue/organ specificity of therapeutic recombinant proteins. Key glycan modifications can be identified using this method and corresponding comparisons can be made with protein function studies. The results could be used to improve drug efficacy and develop new drugs. From a regulatory prospective, this approach could be used to monitor counterfeit or adulterated APIs as well as determine biosimilarity.
Acknowledgments
The authors gratefully acknowledge receipt of materials from Genzyme Corporation (Cerezyme®) and Shire Human Genetic Therapies, Inc. (VPRIV) which were used in this work. The work performed in the study was supported in part by the FDA Critical Path grant program awarded to H. Ye.
Disclaimer
The findings and conclusions in this article have not been formally disseminated by the Food and Drug Administration and should not be construed to represent any agency determination or policy.
References
- 1.Kacher Y, Brumshtein B, Boldin-Adamsky S, Toker L, Shainskaya A, Silman I, et al. Acid beta-glucosidase: insights from structural analysis and relevance to Gaucher disease therapy. Biol Chem. 2008;389(11):1361–9. doi: 10.1515/BC.2008.163. [DOI] [PubMed] [Google Scholar]
- 2.Beutler E, Grabowski GA. Gaucher disease. In: Scriver CR, Sly WS, editors. The metabolic and molecular bases of inherited disease. New Yourk: McGraw-Hill Inc.; 2001. pp. 3635–68. [Google Scholar]
- 3.Edmunds T. β-Glucocerebrosidase ceredase and Cerezyme. In: McGrath BM, Walsh G, editors. Directory of therapeutic enzymes. Boca Raton: CRC Press; 2006. p. 117. [Google Scholar]
- 4.Brumshtein B, Salinas P, Peterson B, Chan V, Silman I, Sussman JL, et al. Characterization of gene-activated human acid-beta-glucosidase: crystal structure, glycan composition, and internalization into macrophages. Glycobiology. 2010;20(1):24–32. doi: 10.1093/glycob/cwp138. [DOI] [PMC free article] [PubMed] [Google Scholar]
- 5.Aerts JM, Yasothan U, Kirkpatrick P. Velaglucerase alfa. Nat Rev Drug Discov. 2010;9(11):837–8. doi: 10.1038/nrd3311. [DOI] [PubMed] [Google Scholar]
- 6.Hollak CE, vom Dahl S, Aerts JM, Belmatoug N, Bembi B, Cohen Y, et al. Force majeure: therapeutic measures in response to restricted supply of imiglucerase (Cerezyme) for patients with Gaucher disease. Blood Cells Mol Dis. 2010;44(1):41–7. doi: 10.1016/j.bcmd.2009.09.006. [DOI] [PubMed] [Google Scholar]
- 7.Wei RR, Hughes H, Boucher S, Bird JJ, Guziewicz N, Van Patten SM, et al. X-ray and biochemical analysis of N370S mutant human acid beta-glucosidase. J Biol Chem. 2011;286(1):299–308. doi: 10.1074/jbc.M110.150433. [DOI] [PMC free article] [PubMed] [Google Scholar]
- 8.Van Patten SM, Hughes H, Huff MR, Piepenhagen PA, Waire J, Qiu H, et al. Effect of mannose chain length on targeting of glucocerebrosidase for enzyme replacement therapy of Gaucher disease. Glycobiology. 2007;17(5):467–78. doi: 10.1093/glycob/cwm008. [DOI] [PubMed] [Google Scholar]
- 9.Brooks SA. Appropriate glycosylation of recombinant proteins for human use: implications of choice of expression system. Mol Biotechnol. 2004;28(3):241–55. doi: 10.1385/MB:28:3:241. [DOI] [PubMed] [Google Scholar]
- 10.Warnock JN, Al-Rubeai M. Bioreactor systems for the production of biopharmaceuticals from animal cells. Biotechnol Appl Biochem. 2006;45(Pt 1):1–12. doi: 10.1042/BA20050233. [DOI] [PubMed] [Google Scholar]
- 11.Mukovozov I, Sabijicl T, Hortelano G, Ofosu FA. Factors that contribute to the immunogenicity of therapeutic recombinant human proteins. Thromb Haemost. 2008;99(5):874–82. doi: 10.1160/TH07-11-0654. [DOI] [PubMed] [Google Scholar]
- 12.Haller CA, Cosenza ME, Sullivan JT. Safety issues specific to clinical development of protein therapeutics. Clin Pharmacol Ther. 2008;84(5):624–7. doi: 10.1038/clpt.2008.158. [DOI] [PubMed] [Google Scholar]
- 13.Kawasaki N, Itoh S, Hashii N, Takakura D, Qin Y, Huang X, et al. The significance of glycosylation analysis in development of biopharmaceuticals. Biol Pharm Bull. 2009;32(5):796–800. doi: 10.1248/bpb.32.796. [DOI] [PubMed] [Google Scholar]
- 14.Rudd PM, Elliott T, Cresswell P, Wilson IA, Dwek RA. Glycosylation and the immune system. Science. 2001;291(5512):2370–6. doi: 10.1126/science.291.5512.2370. [DOI] [PubMed] [Google Scholar]
- 15.Liszewski K. Exploiting post-translational modifications. Genet Eng News. 2005;25(1):22. [Google Scholar]
- 16.Dwek RA, Butters TD, Platt FM, Zitzmann N. Targeting glycosylation as a therapeutic approach. Nat Rev Drug Discov. 2002;1(1):65–75. doi: 10.1038/nrd708. [DOI] [PubMed] [Google Scholar]
- 17.Helenius A, Aebi M. Intracellular functions of N-linked glycans. Science. 2001;291(5512):2364–9. doi: 10.1126/science.291.5512.2364. [DOI] [PubMed] [Google Scholar]
- 18.Okuyama N, Ide Y, Nakano M, Nakagawa T, Yamanaka K, Moriwaki K, et al. Fucosylated haptoglobin is a novel marker for pancreatic cancer: a detailed analysis of the oligosaccharide structure and a possible mechanism for fucosylation. Int J Cancer. 2006;118(11):2803–8. doi: 10.1002/ijc.21728. [DOI] [PubMed] [Google Scholar]
- 19.Kyselova Z, Mechref Y, Al Bataineh MM, Dobrolecki LE, Hickey RJ, Vinson J, et al. Alterations in the serum glycome due to metastatic prostate cancer. J Proteome Res. 2007;6(5):1822–32. doi: 10.1021/pr060664t. [DOI] [PMC free article] [PubMed] [Google Scholar]
- 20.Kayser V, Chennamsetty N, Voynov V, Forrer K, Helk B, Trout BL. Glycosylation influences on the aggregation propensity of therapeutic monoclonal antibodies. Biotechnol J. 2011;6(1):38–44. doi: 10.1002/biot.201000091. [DOI] [PubMed] [Google Scholar]
- 21.Sola RJ, Griebenow K. Glycosylation of therapeutic proteins: an effective strategy to optimize efficacy. BioDrugs. 2010;24(1):9–21. doi: 10.2165/11530550-000000000-00000. [DOI] [PMC free article] [PubMed] [Google Scholar]
- 22.Berg-Fussman A, Grace ME, Ioannou Y, GA G. Human acid β-glucosidase N-glycosylation site occupancy and the effect of glycosylation on enzymatic activity. J Biol Chem. 1993;268(20):14861–66. [PubMed] [Google Scholar]
- 23.Varki A, Kornfeld S. The spectrum of anionic oligosaccharides released by endo-beta-N-acetylglucosaminidase H from glycoproteins. Structural studies and interactions with the phosphomannosyl receptor. J Biol Chem. 1983;258(5):2808–18. [PubMed] [Google Scholar]
- 24.Raju TS, Briggs JB, Chamow SM, Winkler ME, Jones AJ. Glycoengineering of therapeutic glycoproteins: in vitro galactosylation and sialylation of glycoproteins with terminal N-acetylglucosamine and galactose residues. Biochemistry. 2001;40(30):8868–76. doi: 10.1021/bi010475i. [DOI] [PubMed] [Google Scholar]
- 25.Salinas PA, Miller MJC, Lin MX, Savickas PJ, Thomas JJ. Mass spectrometry-based characterization of acidic glycans on protein therapeutics. Int J Mass Spectrom. 2012;312:122–34. doi: 10.1016/j.ijms.2011.06.017. [DOI] [Google Scholar]
- 26.Takasaki S, Murray GJ, Furbish FS, Brady RO, Barranger JA, Kobata A. Structure of the N-asparagine-linked oligosaccharide units of human placental beta-glucocerebrosidase. J Biol Chem. 1984;259(16):10112–7. [PubMed] [Google Scholar]
- 27.Tekoah Y, Tzaban S, Kizhner T, Hainrichson M, Gantman A, Golembo M, et al. Glycosylation and functionality of recombinant ss-glucocerebrosidase from various production systems. Bioscience reports. 2013;33(5):doi:10.1042/BSR2013008. [DOI] [PMC free article] [PubMed]
- 28.Ye H, Boyne MT, 2nd, Buhse LF, Hill J. Direct approach for qualitative and quantitative characterization of glycoproteins using tandem mass tags and an LTQ Orbitrap XL electron transfer dissociation hybrid mass spectrometer. Anal Chem. 2013;85(3):1531–9. doi: 10.1021/ac3026465. [DOI] [PubMed] [Google Scholar]
- 29.Peterman SM, Mulholland JJ. A novel approach for identification and characterization of glycoproteins using a hybrid linear ion trap/FT-ICR mass spectrometer. J Am Soc Mass Spectrom. 2006;17(2):168–79. doi: 10.1016/j.jasms.2005.10.008. [DOI] [PubMed] [Google Scholar]
- 30.http://ca.expasy.org/tools/glycomod, (6/2/2014).
- 31.https://prosightptm2.northwestern.edu, (6/2/2014).
- 32.Dvir H, Harel M, McCarthy AA, Toker L, Silman I, Futerman AH, et al. X-ray structure of human acid-beta-glucosidase, the defective enzyme in Gaucher disease. EMBO Rep. 2003;4(7):704–9. doi: 10.1038/sj.embor.embor873. [DOI] [PMC free article] [PubMed] [Google Scholar]
- 33.Morelle W, Canis K, Chirat F, Faid V, Michalski JC. The use of mass spectrometry for the proteomic analysis of glycosylation. Proteomics. 2006;6(14):3993–4015. doi: 10.1002/pmic.200600129. [DOI] [PubMed] [Google Scholar]
- 34.Alley WR, Jr, Mechref Y, Novotny MV. Characterization of glycopeptides by combining collision-induced dissociation and electron-transfer dissociation mass spectrometry data. Rapid Commun Mass Spectrom. 2009;23(1):161–70. doi: 10.1002/rcm.3850. [DOI] [PubMed] [Google Scholar]
- 35.Viner RI, Zhang T, Second T, Zabrouskov V. Quantification of post-translationally modified peptides of bovine alpha-crystallin using tandem mass tags and electron transfer dissociation. J Proteomics. 2009;72(5):874–85. doi: 10.1016/j.jprot.2009.02.005. [DOI] [PubMed] [Google Scholar]