Abstract
We consider dosing regimens designed to cure patients by eradicating colony forming units (CFU) such as bacteria. In the field of “population” pharmaco-kinetics/dynamics (PK/PD), inter-individual variability (IIV) of patients is estimated using model parameter statistical distributions. We consider a more probabilistic approach to IIV called stochastic process theory, motivated by the fact that tumor treatment planning uses both approaches. Stochastic process PD can supply additional insights and suggest different dosing regimens due to its emphasis on the probability of complete CFU eradication and its predictions on “pure chance” fluctuations of CFU number per patient when treatment has reduced this integer to less than ~100. To exemplify the contrast between stochastic process PD models and standard deterministic PD models, which track only average CFU number, we analyze, neglecting immune responses, neonatal intravenous gentamicin dosing regimens directed against Escherichia coli. Our stochastic calculations predict that the first dose is crucial for CFU eradication. For example, a single 6 mg/kg dose is predicted to have a higher eradication probability than four daily 4 mg/kg doses. We conclude: (1) neonatal gentamicin dosing regimens with larger first doses but smaller total doses deserve investigation; (2) in general, if standard PK/PD models predict average CFU number drops substantially below 100, the models should be modified to incorporate stochastic effects more accurately, and will then usually make more favorable, or less unfavorable, predictions for front boosting (“hit hard early”). Various caveats against over-interpreting the calculations are given.
Electronic supplementary material
The online version of this article (doi:10.1208/s12248-014-9715-3) contains supplementary material, which is available to authorized users.
KEY WORDS: anti-bacterial dosing regimens, front boosting, PK/PD eradication probability, small-number stochastic fluctuations, stochastic birth-death cell population dynamics
INTRODUCTION
Scope
Many medical treatments aim to cure a disease by eradicating, with or without the aid of the patient’s immune system, cells, such as bacteria, that are colony forming units (CFU), rather than aiming to control the disease by indefinitely prolonged therapy. This paper gives examples where mathematical modeling predicts that random fluctuations in CFU number per patient are important during protracted anti-bacterial drug treatments aiming to cure immunocompromised patients.
Therapies often use dosing regimens where the total dose is split into fractions separated by extended time intervals. Figure 1 shows a schematic cycle of 9 daily fractions, with the first dose larger than the others (“boosted”). In our specific examples the first several days turned out to be the most important period.
Fig. 1.
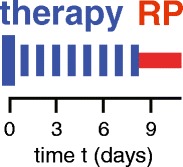
Intermittent dosing. Shown is a hypothetical cycle of 9 dose fractions, one every 24 h. The first dose fraction is boosted. During a recovery period (RP), the drug clears and short-term patient toxicity effects ameliorate
PK/PD Modeling
Most PK/PD models of antibiotic action [reviewed, e.g., in (1–3)] are deterministic: the main equations concern averages, e.g., the average number of CFU such as bacteria. Time dependent averages are typically computed by integrating coupled nonlinear first order ordinary differential equations [reviewed, e.g., in (4)]. Inter-individual variability (IIV) is usually addressed by assuming that some of the parameters in the differential equations are described by appropriate statistical distributions for a patient population [reviewed in (5)].
PK/PD modeling has analyzed gentamicin treatment directed against neonatal Escherichia coli. Neonates are immunocompromised (6) and E. coli has become the leading cause of U.S. fatalities due to early-onset neonatal sepsis; one population-based estimate (7) is that in 2005–2008 yearly incidence was about 840 cases (95% CI 710–980), with mortality of 210 (150–290) corresponding to ~0.05 deaths per 1,000 live births; premature neonates had significantly higher risks.
One PK/PD approach to modeling gentamicin treatment of E. coli in neonates is given in (8,9). The approach takes into account drug-induced “adaptive resistance,” which is reversible within days [reviewed in (4,10)]; it does not consider irreversible resistance caused, e.g., by bacterial mutations (11,12). It predicts standard intravenous injection dosing regimens may sometimes drive the average CFU number per patient to <1. This prediction indicates that corrections should be made to take into account random small-number fluctuations (13), as studied in the theory of stochastic processes [also called random processes; reviewed, e.g., in (14,15)].
Tumor treatment planning, especially in the case of radiotherapy, uses many different stochastic process calculations, relevant on different time scales, from femtoseconds to years, as reviewed in (16–19) and in the online AAPS Supplement section S.4.1. The influence on IIV of stochastic fluctuations at the single cell level is considered (16,18); an approach similar to the statistical methods of population PK/PD is also used to analyze IIV [reviewed, e.g., in (20)].
Preview
Stochastic process calculations of tumor control probability by radiotherapeutic eradication of cancer cells [reviewed in (16,17,19)] suggested to us analogous analyses of drug dosing regimens: the main novelty in the present paper is transferring a mathematical stochastic process theory technique from radiobiological tumor treatment planning to a PK/PD model of neonatal gentamicin treatment. Differences due to the fact that drugs remain in the body during a period of hours or more had to be taken into account, as did the fact that typically a substantial fraction of bacteria are CFU whereas only a small minority of tumor cells are CFU.
Some of our results suggest using large first doses. However our approach is preliminary and has a number of limitations. For example, patient immune system action is neglected. This and other important limitations are itemized at length in the “Discussion” section.
In the stochastic-process approach to PD introduced here some IIV is attributed to “pure chance” or, as is almost equivalent in practice, to biological differences below the limit of resolution of currently feasible observations. Despite the many powerful new methods that are becoming available for observing both individual patient and population characteristics (21,22) there are still PK/PD scenarios where probabilistic calculations are indicated. A conceptual example of at present essentially unobservable differences would be the difference between failure vs. success of binary fission for one specific bacterium in a given patient, whose analysis involves considering fission failure probability, i.e., using a stochastic model. In discussing systems PD modeling [reviewed, e.g., in (23)], it was pointed out that “A notable success … has been the recognition that noise plays an important role in … creating cell-to-cell variability” (24). In situations close to cure, where there are only a few CFU in a patient, such stochastic cell-to-cell variability can presumably sometimes lead to much bigger differences and IIV, such as cure vs. relapse.
MATHEMATICAL AND COMPUTATIONAL METHODS
Deterministic and Stochastic Neonatal Gentamicin Pk/Pd Modeling
Our calculations extend two papers (8,9) on PK/PD modeling of neonatal gentamicin treatments. Figure 2 is a condensed summary. Complete details on all the calculations are given in the online AAPS Supplement, section S3. In Fig. 2, and throughout, we often use the notation of the two published papers.
Fig. 2.
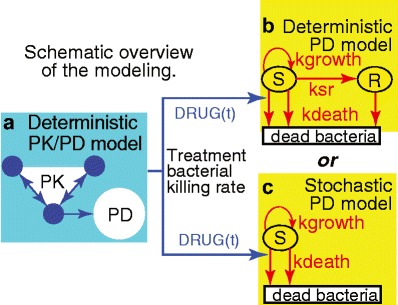
Abbreviated synopsis of the modeling. a As input for deterministic or stochastic PD models of CFU growth and death one needs a rate for the killing of cycling bacteria by gentamicin. This rate, the function DRUG(t), was estimated by using published PK/PD mathematical models, consisting of a standard 3-compartment PK model (small circles), and then a deterministic PD calculation (large circle) accounting for the fact that CFU develop reversible, transient, “adaptive” gentamicin drug resistance in response to dosing. DRUG(t) is a non-linear function of the free drug concentration calculated from the PK model. b Additional PD calculations are needed to estimate, using the published deterministic model, the total number, s(t), of bacteria per patient in the compartment S for cycling CFU, and the number r(t) of possible “resting” (quiescent) bacteria in compartment R, which is initially empty, i.e., r(0) = 0. Arrows indicate bacterial cell population dynamical processes and their labels are transition rates. For example, ksr, which is time and density dependent, is the rate at which cycling bacteria become quiescent. According to the model, ksr becomes substantial only if the total number of bacteria grows to about 100 times the number present at birth; until then the decrease of cycling bacteria due to onset of quiescence is predicted to be negligible. c The present paper emphasizes a stochastic mathematical model of the eradication probability E(t) that s(t) = 0. In the stochastic calculation: (i) The number s is considered to jump from integer to integer as time increases. For reasons explained in the “Results” section, it is possible to use a simplified model which has no R compartment. (ii) Jump probabilities are determined by rates: for treatment killing (downward arrow at left) with per-cell jump probability DRUG(t) h−1; for background killing (other downward arrow) with per-cell jump probability kdeath h−1; and for bacterial fission with per-cell jump probability kgrowth h−1. (iii) E(t) is the probability that at some time between 0 and t, s has jumped from 1 to 0, whereupon, according to the model, it remains 0. Thus, E(t) always increases as time increases. None of the calculations attempt to take into account irreversible gentamicin resistance or neonate immune system assistance to gentamicin treatment
The papers considered four gestation ages (GA). We shall give results for a highly premature neonate with GA = 25 weeks and a full term one with GA = 40 weeks. Many different dosing regimens, with individual doses given as 5-min infusions, will be considered; however, in view of both current thinking (4) and results in the present paper, regimens involving inter-dose intervals of at least 24 h are emphasized.
We always assume treatment starts at birth, taken to be time t = 0. For parameters, we use the central values from (9) and from Table III, “combined data,” in (8). Using central values gives the predicted individualized treatment response of a hypothetical “typical” patient, not the predicted treatment response of a heterogeneous population. For the purposes of our exploratory analysis of the difference between deterministic PD and stochastic process PD, this simplification is arguably the most informative approach.
As usual, the minimum inhibitory concentration (MIC) is taken to be 2 mg/L (9). Though not directly relevant to the question of how deterministic and stochastic estimates differ, toxicity will be discussed below by the method [reviewed in (4,25)] of comparing the (deterministically calculated) in vivo free drug concentration in the central compartment to MIC.
The rest of this Methods section describes: (a) a CFU eradication probability function that will be emphasized throughout, (b) the stochastic process methods used, and (c) a description of how open-source computational PK/PD modeling is here implemented.
Eradication Probability
In Fig. 2b, c, there are no arrows into compartment S for bacterial CFU other than the arrow which also emanates from S. Correspondingly the models predict that if the number s(t) of CFU in S ever becomes zero, it remains at zero (eradication). The initial value at t = 0 is estimated from published data (9) at s(0) ~ 109 CFU per neonate, with the specific value depending on weight at birth.
The deterministic PD calculation Fig. 2b predicts only the average of s(t) and predicts that s(t) = 0 never occurs. Thus the calculation does not directly predict eradication probabilities. For example if the calculated average of s(t) is 2, that might mean all patients harbor two CFU so no eradication has [yet] occurred; but it might alternatively mean that in 99% of the patients eradication has occurred and the remaining “unlucky” 1% harbor 200 bacteria each. In such situations an estimate of the eradication probability as exp(-average), where average is 2 in our example, is sometimes used. However, seminal papers by S. Tucker and coworkers on tumor treatment planning, e.g., (26), emphasized that this estimate implicitly assumes Poisson statistics, which can be quite inaccurate in situations where CFU birth and death rates are large and time dependent. Moreover the estimate refers to a single time rather than being a gradually increasing eradication probability; for example if the average is evaluated at the bottom of an s(t) trough, it seems unrealistic to ignore the question of how long the CFU population lingers at or near that trough. Subsequent analyses [reviewed in (19)] have reinforced these objections.
In general, an advantage of stochastic models over deterministic models is that the former give systematic numerical estimates of eradication probabilities (27). Using the model summarized in Fig. 2c and given in full in the online AAPS supplement section S3, we calculated an eradication probability E(t) that s(t) = 0 for various dosing regimens.
Independent-CFU: Kendall’s Stochastic Model
Review of Deterministic Methods and Results for Independent-CFU Dynamics
In Fig. 2c, the CFU in S undergo independent (also sometimes called “non-interacting” or “exponential”) population dynamics. Stochastic exponential growth/decay models generalize deterministic ones, so we start by reviewing the latter. Denote average CFU number by m(t); thus, m(t) is analogous to s(t) in Fig. 2b. The deterministic equation of exponential population dynamics (growth or decay) is m(t) = m(0)exp[μt], where m(0) > 0. Here μ is a constant, called the Malthusian parameter and interpreted as the difference between per-CFU birth rate and per-CFU death rate (both always assumed non-negative in the present paper), with μ thus positive or negative according to whether birth or death rate is larger.
More generally, the Malthusian rate could be a function μ(t) of the time, driven, e.g., by time dependent drug concentrations. Then the relevant ordinary differential equation and its solution are the following:
| 1 |
We are mainly interested in situations where, due to a large death rate caused by drug treatment, μ(τ) ≪ 0 for most times τ. Then the integral in Eq. 1 is negative, which implies CFU population decrease, i.e., m(t) ≪ m(0).
An essential assumption implicit in Eq. (1) is that different CFU are independent of each other. In our case, the assumption is reasonable because we are considering scenarios where the CFU density is so small stochastic small-number fluctuations are important. Formally speaking, with μ(t) independent of m(t) the differential equation (1A) is linear; knowing the time dependence for a single CFU initially, i.e., knowing the solution with m(0) = 1, determines the time dependence of the average for any initial value m(0) simply by multiplication. In contrast, inter-CFU interactions at high densities are described by nonlinear equations. A simple example is the logistic differential equation for sigmoidal growth (28), where the solution for m(0) ≫ 1 is qualitatively different from, rather than just a multiplicative rescaling of, the solution for m(0) = 1.
Stochastic Process Methods
The stochastic process model corresponding to Eq. (1) is one of only a few that can be analyzed with explicit analytic equations, rather than requiring extensive Monte-Carlo simulations. It is a birth-death stochastic process model for a population of independent identically distributed cells, first investigated in detail by Kendall (29). The per-cell rates of the model can be time-dependent but must be state independent; the full definition of the model, and its mathematical properties, are given in many standard texts [e.g., as example 4.8 by Tan (15)] and are reviewed in our online AAPS Supplement, section S2. In contrast to the deterministic model in Eq. (1), the stochastic counterpart model requires knowing the birth and death rates b(t) and d(t) individually, not merely their difference μ(t) = b(t) − d(t); the (per-CFU) birth rate b(t) is interpreted intuitively (14) by saying that the chance that 1 CFU divides into 2 CFU within a very short time interval dt centered at t is b(t)dt ; a corresponding interpretation holds for the death rate d(t).
Sections S2 and S4 of the online AAPS Supplement derive the equations needed to calculate the eradication probability E(t) of this stochastic model; they include intuitive comments about how stochastics work in this comparatively simple case. The overall conclusion there is that stochastic predictions, relative to deterministic ones, tend to favor front boosting over back boosting.
Computer Modeling
Technicalities of interest primarily to other computational/mathematical modelers are relegated to the supplement. However mathematical and computational PK/PD papers should, in our opinion, contain enough information that any reader with a moderate knowledge of modern computational methods can duplicate every one of the results. We have therefore included in section 3 of the online AAPS Supplement copies of, and links to, our customized software, written in the fully open-source computer language R.
RESULTS
Preview
Except where explicitly stated to the contrary, all dosing regimens discussed have at least 24 h between doses. We first calculated the time-dependence of average CFU number using deterministic PK/PD models for a 10-day period. The results suggested focusing on the first 85 h when comparing stochastic and deterministic PD models. Carrying out the comparison gave numerical estimates of the eradication probability E(t). The results suggested that, in a stochastic calculation that neglects irreversible resistance and immune system action, a large first dose, and CFU population dynamics during the first 36 h, are crucial for the predicted eradication probability: E(t) increasing to >0.5 was calculated to occur quite early or not at all. Finally, a statistically highly significant (p ≪ 0.001) correlation was found between the final eradication probability and a simpler index obtained directly from the dosing regimen without invoking any models or adjustable parameters.
Deterministic PK/PD Predictions for the First 10 Days
Figure 3, obtained by using the deterministic PK/PD model outlined in Fig. 2a, b for one of the dosing cycles analyzed in (9), indicated that, for this specific dosing regimen: (a) we should simplify by focusing on the first 85 h of treatment since predicted average total CFU number at 85 h becomes and remains so high that stochastic small-number corrections to the deterministic model are no longer needed; and (b) when using a stochastic calculation to find E(t) the simplified independent-CFU (i.e., ksr = 0) model of Fig. 2c is adequate, because E(t) grows significantly only at early times when the total CFU number in the central compartment is estimated to be many logs smaller than the number which would lead to substantial deviations from a ksr = 0 model.
Fig. 3.
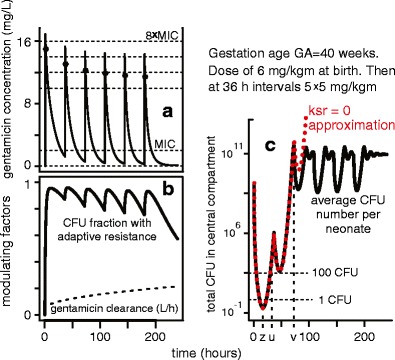
Deterministic PK/PD estimates for a 10 day period: an example. a As in the references, asterisks denote calculated concentrations 1 h after each dose (simulated as a 5-min infusion). For the dosing regimen in this example, peak and trough concentrations are predicted to decrease. b Most bacteria are predicted to acquire reversible adaptive drug resistance within 10 h after the first dose. In addition, the drug clearance gradually increases during the 10-day period. Both factors tend to make later doses less effective than early ones. c This panel illustrates some key properties. First, deterministic PK/PD models sometimes predict that the average total CFU number in S becomes less than 1. Here, the minimum (at time z) is only about 0.255 CFU per patient. Second, we here have u < 36 h for the time u where the predicted CFU number is less than 100 for the last time. Third, a simplified model, in which the rate ksr = 0, is very nearly exact until a time greater than u when the predicted CFU number has grown very large. Such properties facilitate the comparison of stochastic to deterministic PD predictions (see text)
The First Few Days
Figure 4 shows, for the first 85 h of one dosing regimen chosen to be reasonably typical, results (panels a–d) of deterministic PK/PD modeling and (panels e and f) of the stochastic PD model summarized in Fig. 2c. It is seen (panels e and f) that the stochastic PD model predicts, for the extinction probability E(t), that E(t) increases most rapidly at early times (when adaptive resistance is still small) and reaches nearly its final value EF at ~15 h for the premature neonate or <30 h for the full-term neonate.
Fig. 4.
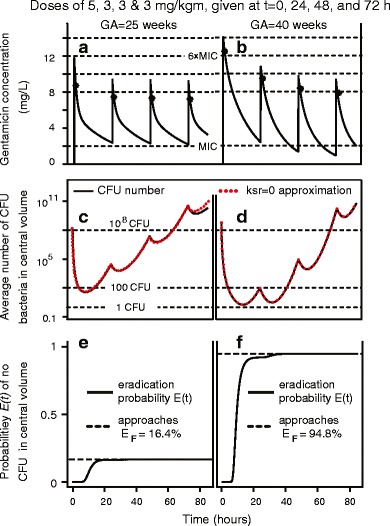
Deterministic and stochastic PK/PD estimates for an 85 h period: an example. a and b show deterministically calculated averages wholly analogous to a of Fig. 3. The main difference is that here average concentration remains above MIC for all times (a) or all times less than 48 h (b). c and d are wholly analogous to c of Fig. 3. e, f The curves are the stochastically calculated eradication probabilities E(t). In e, E(t) has reached almost its final value, E F ~16%, by <20 h. In f, the second dose, administered at 24 h, does give a visible increase in E(t) but the last two doses do not
We concluded that, to the extent that these properties hold for other dosing regimens: (a) the first dose is the key one as far as obtaining a large final eradication probability EF; (b) doses later than about 36 h after the first dose are usually almost useless as regards increasing the predicted EF.
Tables and Statistics for the First 75 h
We therefore investigated to what extent Figs. 3 and 4 are typical by considering a number of 72 h dosing regimens with equal intervals between doses; each regimen was followed by a 3-h recovery period. Results for 24- and 36-h intervals between doses are shown in Tables I and II. In each row we state the estimated EF, specifically the eradication probability E(75) that the central compartment contains no bacterial CFU at 75 h; we add calculated free drug concentrations, often considered as indicators of effectiveness and/or toxicity (4,30,31), with troughs > MIC usually deprecated. It is seen that comparing GA = 40 weeks with GA = 25 weeks for a given dosing regimen: (a) E(75) for GA = 40 weeks is larger (e.g., rows Table I rows 13 and 14 vs. Table II rows 6 and 7); (b) for eradication probabilities >0.5 there are more troughs < MIC, especially after several days. In this sense the term neonate is easier to treat than the premature neonate (whose central compartment volume per kg is larger). Tables I and II are selected excerpts from a 32-row larger table, given in section S3 of the online AAPS Supplement, each row of which contains results for both GA = 25 and GA = 40.
Table I.
Eradication probabilities and concentration troughs/peaks. GA=40 weeks
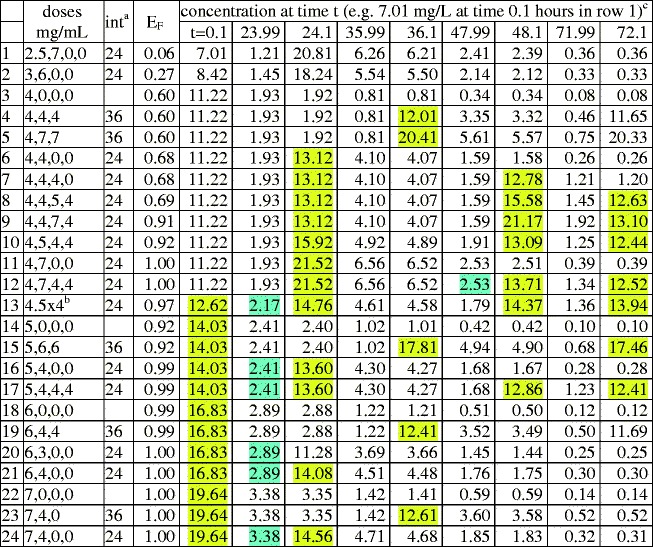
aInterval between doses, e.g. in row 1, 2.5 mg/kg at birth, then 7 mg/kg after 24 h
bFour doses, each 4.5 mg/kg
cConcentration troughs > MIC (=2 mg/L), and peaks >6MIC, are highlighted blue or yellow respectively to facilitate comments on toxicity in the “Discussion” section
Table II.
Eradication probabilty and concentration troughs/peaks. GA=25 weeks
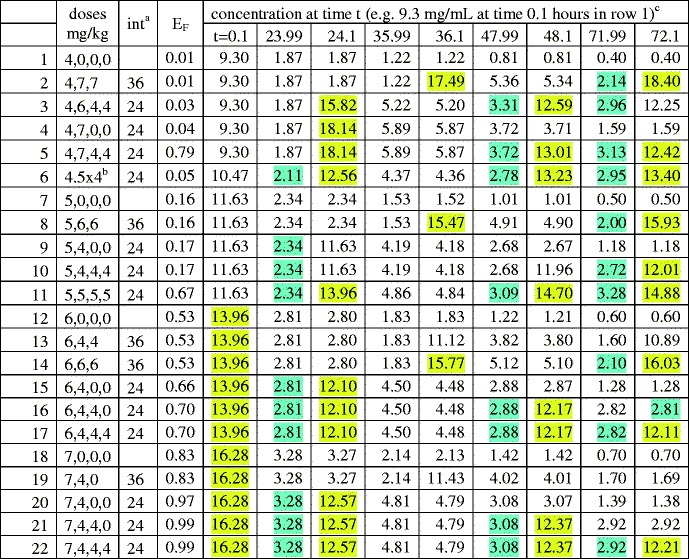
aIntervals between doses, in hours; e.g. row 2 shows 4 mg/kg given at birth, then 2 × 7 mg/kg at 36 h intervals
bFour doses, each 4.5 mg/kg
cConcentration troughs greater than MIC (=2 mg/L), and peaks >6MIC, are highlighted blue or yellow respectively to facilitate comments on toxicity in the Discussion section
Lexicographic Ordering
The tables are “lexicographically ordered” as follows. If the first dose in row x is smaller than the first dose in row y, row x is located above row y. Ties which remain after applying this criterion are broken by using dose intervals: rows having no second dose are above those having intervals of 36 h, which in turn are above those having intervals of 24 h. Ties which still remain are broken by using the size of the second dose, then by using the size of the third dose, and finally by using the size of the fourth dose. Lexicographic order indicates the degree of front boosting. It is seen that lexicographic order correlates with E(75). For example in Table II the front boosted regimen row 20 has a substantially larger E(75) than the corresponding back boosted, lexicographically earlier, regimen, row 2.
In order to quantify the correlation, we computed Spearman’s rank correlation coefficient “rho” for the sum of both E(75) values (GA = 25 and GA = 40 weeks) using lexicographic order as predictor; the result was rho = 0.96, with p < 10−15 for the alternate hypothesis that the correlation of E(75) with lexicographic order was due to chance. For vividness, the input to this rank correlation coefficient calculation is shown in Fig. 5.
Fig. 5.
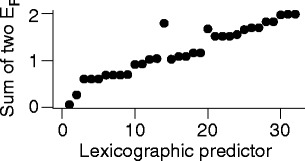
Rank correlation input. The vertical axis gives the sum of the 2 eradication probabilities E(75) for the 25-week and the 40-week neonates, as predicted using the mathematical model of Figs. 2a, c. The horizontal axis is the row number of the 32-row table in the supplement. The x axis is merely ordinal: stretching it non-linearly would give a graph with the same information
Additional Results
For completeness, Table III gives predictions of our mathematical model (Fig. 2) for a twice daily dosing regimen, compared to a single dose that gives a similar E(75) value. It is seen that during the first 3 days the predicted concentration for the twice daily regimen never drops below MIC (2 mg/L) and never gets as high as 5×MIC.
Table III.
Additional dosing regimens for GA=40 weeks

a7 dose fractions of 2.2 mg/kg 12 h apart
One adjustable constant in the published model of Fig. 2a is Koff, the rate at which adaptively resistant bacteria return to sensitivity when no longer subjected to gentamicin, with ln2/Koff the corresponding half-life, taken as 50 h in (9) and above. The value of the half-life in patients is not well known, but may often be smaller (32). Therefore, to check robustness of the results, we redid our calculations using half-life 25 h instead of 50 h. The main conclusions were not changed. In particular, the Spearman coefficient rho was 0.84, with p = 4 × 10⁻⁷. However, as expected, the model-estimated final eradication probability EF is higher. Details are in online AAPS Supplement section S3.3. One of the more notable examples is the following: for GA = 40 and an initial 3 mg/kg dose followed 24 h later by a 6-mg/kg dose, EF assuming a half-life of 50 h is 27%; but when assuming a 25-h half-life, it increases to EF = 90%.
DISCUSSION
Our results concern a new approach to anti-bacterial PK/PD modeling, attempting to estimate an eradication probability E(t) by stochastic PD modeling in silico. This “Discussion” section will first list some limitations of our calculations, which imply that the results cannot, at least at present, serve as prospective estimates of cure rates. Then we discuss the results in more detail and make suggestions.
Some Limitations of the Analysis, Especially as Regards E(t) and EF
Among the limitations of our analysis are the following.
Correlating EF with effectiveness observed in vitro, preclinically, or clinically was not attempted.
Our results only apply to individualized treatment of a hypothetical neonate that has parameters typical of neonates with the same GA and birth-weight. The statistical methods of population PK/PD have to be added to the stochastic process calculations unless detailed information on each neonate is available and is used to design individualized treatments. For example, in general any predicted advantage of front boosting will apply only to a fraction of the patient population—there will be some patients for whom both front boosted and corresponding back boosted regimens are predicted to be effective and some for whom neither is predicted to be effective. Any predicted advantage of front boosting is therefore “fuzzed out” when applied to many different individuals in a heterogeneous population.
Our equations merely graft one stochastic process PD calculation onto an otherwise deterministic PK/PD calculation. To really estimate eradication, a systematically stochastic approach is needed for all aspects. For example, suppose one sample treated in vitro has CFU counts below the limit of detection at a preassigned final time. In a deterministic treatment the question of whether all CFU in such a sample are eradicated need not be considered (9) but in a comprehensively stochastic approach that would be a key question.
Our model has many of the same problems as other current in silico PK/PD models (33), e.g. an unfortunate combination of over-simplification with over-parameterization. The changes in predicted EF values when changing the parameter Koff (see the “Results” section) are one example of how over-parameterization can lead to substantial uncertainties.
In particular, the model may not be detailed enough biologically to connect cure to CFU number. For example, even if there are no remaining CFU in the central compartment, CFU could be “hiding” at other locations in the body and subsequently repopulate the central compartment. The deterministic PD model we are modifying does not address this possibility, and does not need to address it because effectiveness is judged by clinical trials rather than predicted mathematically. But in our stochastic argument, the possibility is important.
Similarly, and perhaps most importantly, in its present form the model is applicable only to immunoincompetent patients. Neglecting immune system dynamics may be less acceptable in a fully stochastic calculation than in the corresponding deterministic approximation. A more extensive calculation, which models the coupled effect of immune reactions and treatment driving total CFU number down to such small values that stochastic fluctuations become important, will eventually be needed.
Comments on EF
Despite the caveats listed above, we suggest there are reasons to consider EF as a possible effectiveness index, which deserves experimental and clinical investigation. One reason is that EF considers a relevant biological scenario (Fig. 2a, c), however oversimplified. Another is that the eradication probability E(t) calculated from the model increases and approaches its limiting value EF gradually, which seems plausible. Corresponding deterministic estimates (discussed in the “Eradication probability” subsection of Methods) refer to just one time, such as the end of treatment or the time when the predicted average CFU number is at its minimum, not to the entire time course of a treatment regimen. Finally, the fact that, at least for neonatal gentamicin treatments, EF calculated from a model correlates strongly with a lexicographic ordering, which is so simple that it is automatically available in the clinic, indicates a potential practical advantage.
Regimens with Large First Dose but Small Total Dose: Toxicity
The most interesting rows in Tables I and II have, compared to most current practice, a larger first dose but smaller total dose. The most extreme examples consist of a single dose of 5–7 mg/kg at birth and then no further treatment.
Gentamicin overdosing is dangerous, especially as regards nephrotoxicity and irreversible vestibular ototoxicity (4,25,34). Clinical guidelines for neonates vary (4,25,30,31,35,36). Guidelines often specify that free drug concentration in the central compartment should include frequent or prolonged troughs < MIC (=2 mg/L) during the first week, which our extreme examples (e.g. Table II row 18) clearly satisfy. Prolonged or repeated concentrations above a certain value (6×MIC is one estimate) are also usually deprecated. However it has been argued that a single high peak which decays rapidly may perhaps not be too dangerous, due to saturation effects in drug uptake for both ear and kidney (4,25,36). Comparing with Tables I and II indicates that the high initial doses needed to achieve high predicted values of EF, especially doses of 6 mg/kg or more which are used only rarely for neonates (36), are as yet neither unambiguously safe nor unambiguously ruled out by toxicity constraints.
Front Loading
If mathematically predicted concentration troughs < MIC (36) and EF > 50% are taken as goals (see caveats above), there are implications for front boosting. Examples of model-predicted front boosting advantage include many cases like the contrast between the single 5 mg/kg dose in Table I row 14 and higher-total-dose regimens (rows 2, 8–11) which lead to smaller EF, despite also having at least one dose at least as large as 5 mg/kg and having higher concentration troughs. The intuitive reasons for this predicted difference include the development of adaptive resistance and increasing clearance (Fig. 3b) and also the general tendency of stochastics to favor early dosing (AAPS Supplement, sections S2 and S4).
Conclusions and Recommendations
For neonatal gentamicin treatments directed at E. coli, we suggest that the safety and effectiveness of larger first doses coupled with smaller total doses than usual in current practice deserve further investigation in silico and in vitro, which could in turn eventually lead to preclinical and clinical trials. More generally, if standard PK/PD models predict that the average CFU number ever drops substantially below ~100 per patient, the models should be modified to incorporate stochastic effects systematically, which will then usually give more favorable, or less unfavorable, predictions for front boosting (“hit hard early”).
Electronic supplementary material
(DOCX 241 kb)
Acknowledgments
Support from NIH NCI ICBP U54CA149233 (LH and RKS), from the University of California Undergraduate Research Program (NS), and from the Cleveland Clinic Foundation (TR) is gratefully acknowledged. We thank Prof. L. Hanin for useful criticisms.
Conflict of interest
There are no conflicts of interest related to the work in the manuscript.
Confidentiality
Use of the information in this manuscript for commercial, noncommercial, research, or purposes other than peer review not permitted prior to publication without the expressed written permission from the author.
REFERENCES
- 1.Czock D, Markert C, Hartman B, Keller F. Pharmacokinetics and pharmacodynamics of antimicrobial drugs. Expert Opin Drug Metab Toxicol. 2009;5(5):475–87. doi: 10.1517/17425250902913808. [DOI] [PubMed] [Google Scholar]
- 2.Nielsen EI, Friberg LE. Pharmacokinetic-pharmacodynamic modeling of antibacterial drugs. Pharmacol Rev. 2013;65(3):1053–90. doi: 10.1124/pr.111.005769. [DOI] [PubMed] [Google Scholar]
- 3.Wu B, Sy SKB, Derendorf H. Principles of applied pharmacokinetic–pharmacodynamic modeling. In: Vinks AA, Derendorf H, Mouton JW, editors. Fundamentals of antimicrobial pharmacokinetics and pharmacodynamics. New York: Springer; 2014. [Google Scholar]
- 4.Bulik CC, Nightingale CH, Nicolau DP. Aminoglycosides. In: Vinks AA, Derendorf H, Mouton JW, editors. Fundamentals of antimicrobial pharmacokinetics and pharmacodynamics. New York: Springer; 2014. [Google Scholar]
- 5.Vinks AA. Population pharmacokinetic–pharmacodynamic (PK/PD) modeling of anti- infective agents and its applications to individualized therapy. In: Vinks AA, Derendorf H, Mouton JW, editors. Fundamentals of antimicrobial pharmacokinetics and pharmacodynamics. New York: Springer; 2014. [Google Scholar]
- 6.Wynn JL, Levy O. Role of innate host defenses in susceptibility to early onset neonatal sepsis. Clin Perinatol. 2010;37(2):307–37. doi: 10.1016/j.clp.2010.04.001. [DOI] [PMC free article] [PubMed] [Google Scholar]
- 7.Weston EJ, Pondo T, Lewis MM, Martell-Cleary P, Morin C, Jewell B, et al. The burden of invasive early-onset neonatal sepsis in the United States, 2005–2008. Pediatr Infect Dis J. 2011;30(11):937–41. doi: 10.1097/INF.0b013e318223bad2. [DOI] [PMC free article] [PubMed] [Google Scholar]
- 8.Nielsen EI, Sandstrom M, Honore PH, Ewald U, Friberg LE. Developmental pharmacokinetics of gentamicin in preterm and term neonates: population modelling of a prospective study. Clin Pharmacokinet. 2009;48(4):253–63. doi: 10.2165/00003088-200948040-00003. [DOI] [PubMed] [Google Scholar]
- 9.Mohamed AF, Nielsen EI, Cars O, Friberg LE. Pharmacokinetic-pharmacodynamic model for gentamicin and its adaptive resistance with predictions of dosing schedules in newborn infants. Antimicrob Agents Chemother. 2012;56(1):179–88. doi: 10.1128/AAC.00694-11. [DOI] [PMC free article] [PubMed] [Google Scholar]
- 10.Barker CI, Germovsek E, Hoare RL, Lestner JM, Lewis J, Standing JF. Pharmacokinetic/pharmacodynamic modelling approaches in paediatric infectious diseases and immunology. Adv Drug Deliv Rev. 2014;73:127–39. doi: 10.1016/j.addr.2014.01.002. [DOI] [PMC free article] [PubMed] [Google Scholar]
- 11.Downie L, Armiento R, Subhi R, Kelly J, Clifford V, Duke T. Community-acquired neonatal and infant sepsis in developing countries: efficacy of WHO’s currently recommended antibiotics–systematic review and meta-analysis. Arch Dis Child. 2013;98(2):146–54. doi: 10.1136/archdischild-2012-302033. [DOI] [PubMed] [Google Scholar]
- 12.Hasvold J, Bradford L, Nelson C, Harrison C, Attar M, Stillwell T. Gentamicin resistance among Escherichia coli strains isolated in neonatal sepsis. J Neonatal-Perinatal Med. 2013;6(2):173–7. doi: 10.3233/NPM-1365512. [DOI] [PubMed] [Google Scholar]
- 13.Gurney WSC, Nisbet RM. Ecological dynamics. USA: Oxford University Press; 1998. [Google Scholar]
- 14.Grimmett G, Stirzaker D. Probability and random processes. 3. Oxford: Oxford University Press; 2001. [Google Scholar]
- 15.Tan W. Stochastic models with applications to genetics, cancers, AIDS, and other biomedical systems. London: World Scientific; 2002. [Google Scholar]
- 16.Zaider M, Hanin L. Tumor control probability in radiation treatment. Med Phys. 2011;38(2):574–83. doi: 10.1118/1.3521406. [DOI] [PubMed] [Google Scholar]
- 17.Marcu LG, Harriss-Phillips WM. In silico modelling of treatment-induced tumour cell kill: developments and advances. Comput Math Methods Med. 2012;2012:960256. doi: 10.1155/2012/960256. [DOI] [PMC free article] [PubMed] [Google Scholar]
- 18.Fakir H, Hlatky L, Li H, Sachs R. Repopulation of interacting tumor cells during fractionated radiotherapy: stochastic modeling of the tumor control probability. Med Phys. 2013;40(12):121716. doi: 10.1118/1.4829495. [DOI] [PMC free article] [PubMed] [Google Scholar]
- 19.Hanin L, Zaider M. Optimal schedules of fractionated radiation therapy by way of the greedy principle: biologically-based adaptive boosting. Phys Med Biol. 2014;59(15):4085–98. doi: 10.1088/0031-9155/59/15/4085. [DOI] [PubMed] [Google Scholar]
- 20.Fowler JF. 21 years of biologically effective dose. Br J Radiol. 2010;83(991):554–68. doi: 10.1259/bjr/31372149. [DOI] [PMC free article] [PubMed] [Google Scholar]
- 21.Iyengar R, Zhao S, Chung SW, Mager DE, Gallo JM. Merging systems biology with pharmacodynamics. Sci Transl Med. 2012;4(126):126ps7. doi: 10.1126/scitranslmed.3003563. [DOI] [PMC free article] [PubMed] [Google Scholar]
- 22.Reinhart K, Bauer M, Riedemann NC, Hartog CS. New approaches to sepsis: molecular diagnostics and biomarkers. Clin Microbiol Rev. 2012;25(4):609–34. doi: 10.1128/CMR.00016-12. [DOI] [PMC free article] [PubMed] [Google Scholar]
- 23.Jusko WJ. Moving from basic toward systems pharmacodynamic models. J Pharm Sci. 2013;102(9):2930–40. doi: 10.1002/jps.23590. [DOI] [PMC free article] [PubMed] [Google Scholar]
- 24.Sorger P, Allerheiligen S, Abernethy D, Altman R, Brouwer K, Califano A, et al. Quantitative and systems pharmacology in the post-genomic era: new approaches to discovering drugs and understanding therapeutic mechanisms 2011. Available from: http://www.nigms.nih.gov/News/Reports/Pages/201110-syspharma.aspx.
- 25.Croes S, Koop AH, van Gils SA, Neef C. Efficacy, nephrotoxicity and ototoxicity of aminoglycosides, mathematically modelled for modelling-supported therapeutic drug monitoring. Eur J Pharm Sci Off J Eur Fed Pharm Sci. 2012;45(1–2):90–100. doi: 10.1016/j.ejps.2011.10.022. [DOI] [PubMed] [Google Scholar]
- 26.Tucker SL, Thames HD, Taylor JM. How well is the probability of tumor cure after fractionated irradiation described by Poisson statistics? Radiat Res. 1990;124(3):273–82. doi: 10.2307/3577839. [DOI] [PubMed] [Google Scholar]
- 27.Ovaskainen O, Meerson B. Stochastic models of population extinction. Trends Ecol Evol. 2010;25(11):643–52. doi: 10.1016/j.tree.2010.07.009. [DOI] [PubMed] [Google Scholar]
- 28.Edelstein-Keshet L. Mathematical models in biology. Philadelphia: SIAM; 2005. [Google Scholar]
- 29.Kendall DG. On the generalized birth and death process. Ann Math Stat. 1948;19:101–17. doi: 10.1214/aoms/1177730285. [DOI] [Google Scholar]
- 30.Hoff DS, Wilcox RA, Tollefson LM, Lipnik PG, Commers AR, Liu M. Pharmacokinetic outcomes of a simplified, weight-based, extended-interval gentamicin dosing protocol in critically ill neonates. Pharmacotherapy. 2009;29(11):1297–305. doi: 10.1592/phco.29.11.1297. [DOI] [PubMed] [Google Scholar]
- 31.Dersch-Mills D, Akierman A, Alshaikh B, Yusuf K. Validation of a dosage individualization table for extended-interval gentamicin in neonates. Ann Pharmacother. 2012;46(7–8):935–42. doi: 10.1345/aph.1R029. [DOI] [PubMed] [Google Scholar]
- 32.Barclay ML, Begg EJ. Aminoglycoside adaptive resistance: importance for effective dosage regimens. Drugs. 2001;61(6):713–21. doi: 10.2165/00003495-200161060-00001. [DOI] [PubMed] [Google Scholar]
- 33.McLanahan ED, El-Masri HA, Sweeney LM, Kopylev LY, Clewell HJ, Wambaugh JF, et al. Physiologically based pharmacokinetic model use in risk assessment—why being published is not enough. Toxicol Sci Off J Soc Toxicol. 2012;126(1):5–15. doi: 10.1093/toxsci/kfr295. [DOI] [PubMed] [Google Scholar]
- 34.Cooper AC, Commers AR, Finkelstein M, Lipnik PG, Tollefson LM, Wilcox RA, et al. Otoacoustic emission screen results in critically ill neonates who received gentamicin in the first week of life. Pharmacotherapy. 2011;31(7):649–57. doi: 10.1592/phco.31.7.649. [DOI] [PubMed] [Google Scholar]
- 35.Reynolds LF, Mailman TL, McMillan DD. Gentamicin in neonates at risk for sepsis—peak serum concentrations are not necessary. Paediatr Child Health. 2012;17(6):310–2. [PMC free article] [PubMed] [Google Scholar]
- 36.Fjalstad JW, Laukli E, van den Anker JN, Klingenberg C. High-dose gentamicin in newborn infants: is it safe? Eur J Pediatr. 2013. [DOI] [PubMed]
Associated Data
This section collects any data citations, data availability statements, or supplementary materials included in this article.
Supplementary Materials
(DOCX 241 kb)


