

Abstract
Members of the genus Brucella have cell wall characteristics of Gram-negative bacteria, which in the most significant species includes O-polysaccharide (OPS). Serology is the most cost-effective means of detecting brucellosis, as infection with smooth strains of Brucella leads to the induction of high antibody titers against the OPS, an unbranched homopolymer of 4,6-dideoxy-4-formamido-d-mannopyranosyl residues (d-Rha4NFo) that are variably α(1→2)- and α(1→3)-linked. Six d-Rha4NFo homo-oligosaccharides were synthesized, each containing a single α(1→3) link but with a varied number of α(1→2) links. After conjugation to bovine serum albumin (BSA), glycoconjugates 1 to 6 were used to develop individual indirect enzyme-linked immunosorbent assays (iELISAs). The diagnostic capabilities of these antigens were applied to panels of cattle serum samples, including those falsely positive in conventional assays, and the results were compared with those of the complement fixation test (CFT), serum agglutination test (SAT), fluorescent polarization assay (FPA), smooth lipopolysaccharide (sLPS) iELISA, and competitive enzyme-linked immunosorbent assay (cELISA) methods. Results from field serum samples demonstrated that all of the synthetic antigens had excellent diagnostic capabilities. Assays developed with the α(1→3)-linked disaccharide conjugate 1 were the best at resolving false-positive serological results. This was supported by the results from serum samples derived from experimentally infected cattle. Data from synthetic trisaccharide antigens 2 and 3 and tetrasaccharide antigen 4 identified an OPS epitope equally common to all Brucella abortus and Brucella melitensis strains but unique to Brucella. Synthetic oligosaccharide conjugates function as effective surrogates for naturally derived antigens. The creation of discrete OPS epitope antigens reveals not only the previously untapped diagnostic potential within this key diagnostic structure but also holds significance for the design of brucellosis vaccines and diagnostics that enable the differentiation of infected from vaccinated animals.
INTRODUCTION
Brucellosis is a zoonotic disease caused by members of the genus Brucella. These are non-spore-forming coccobacillary rods with cell wall characteristics of Gram-negative bacteria, which include peptidoglycans, outer membrane proteins, and lipopolysaccharide (LPS). The species Brucella abortus, Brucella melitensis, and Brucella suis cause the greatest animal and human health impacts. The LPS of field strains of these species possess O-polysaccharides (OPS), which protrude from the cell wall and alter the morphology of colonies giving rise to their description as “smooth” species and strains. The main feature of the disease in livestock is reproductive failure, which is most evident through abortion and male infertility (1). Otherwise, many animals with such an infection appear outwardly healthy. This is not so in humans, in whom undulant fever occurs in most cases (2).
The principle method for monitoring brucellosis in the animal population, and a necessity for its eradication, is serology. The classical and contemporary methods for the serodiagnosis of brucellosis in animals have been well described (3–5), and despite differences, all the assays make use of diagnostic antigens that are rich in OPS.
The main structural element within the Brucella OPS is a homopolymer of 4,6-dideoxy-4-formamido-d-mannopyranosyls (d-Rha4NFo), which are variably α(1→2) and α(1→3) linked (6–9). The proportion of each linkage type in different strains of Brucella appears to vary from 0% to 20% frequency of α(1→3) linkage types, with the remainder being α(1→2) types. Notably, only the B. suis biovar 2 type strain has been found to be devoid of α(1→3) links (10).
The Brucella OPS is formed as a d-Rha4NFo block copolymer (8), with two polymeric elements combined into one molecule with three non-d-Rha4NFo sugars at the reducing end forming the adaptor and primer regions (11). The first d-Rha4NFo element, found at the reducing end, is a sequence of d-Rha4NFo units that are all α(1→2) linked. This sequence is capped by one or more tetrasaccharide d-Rha4NFo units containing a central α(1→3) link; otherwise the linkages are of the α(1→2) type. The presence of the α(1→3) link constitutes the specific feature of the M epitope. The OPS of the M-dominant strains of Brucella have several multiples of these tetrasaccharide units coupled to the α(1→2)-linked polymer. The OPS of A-dominant strains contain one or two of these terminal tetrasaccharides coupled to a longer α(1→2)-linked polymer. Consequently, an α(1→3) link is present near the tip of each OPS molecule regardless of whether it derives from an A- or an M-dominant strain of Brucella.
The significance of this linkage detail is that it substantially alters the shape of the OPS and affects antibody binding. This has been shown in numerous studies using monoclonal antibodies (MAbs) (12–16), and the absorbed monospecific polyclonal serum that is used within the classical biotyping scheme for Brucella to classify strains as either A, M, or mixed A and M serotypes (17).
Infection with other Gram-negative bacteria which possess similar OPS structures may induce antibodies that cross-react with Brucella OPS (18), giving rise to false-positive serological reactions (FPSRs). The most well cited of these is Yersinia enterocolitica O:9 (19, 20), as this bacterium possesses a homopolymer that consists exclusively of α(1→2)-linked d-Rha4NFo units (7, 21).
Given the dominance of the OPS as a target for polyclonal anti-Brucella antibodies, the unique structural elements within it were considered worthy of further investigation as diagnostic antigens. Several epitopes within the OPS have been putatively identified on the basis of MAb binding studies (12, 13, 16) and the structural knowledge available at that time. The A and C/Y epitopes, comprising d-Rha4NFo residues that are exclusively α(1→2) linked are also found within the OPS of Y. enterocolitica O:9. The specific structural feature of the C epitope, specific to Brucella but found in equal abundance in all smooth strains (B. suis biovar 2 and Brucella inopinata BO2 excepted), was almost completely unknown. The M epitope comprises α(1→3)-linked d-Rha4NFo residues, a structure unique to Brucella.
Native OPS antigens cannot deliver full diagnostic potential, as these epitopes coexist and overlap. Discrete epitope antigens are required, and the only way to produce them is through chemical synthesis. The aim of this study was to explore the potential of synthetic d-Rha4NFo-homo-oligosaccharides that possess increasingly specific M-like properties as diagnostic antigens for the serodetection of bovine brucellosis. The synthesis and preliminary evaluation of these antigens were recently described (14, 15). The first objective of this study was to evaluate antigens 1 to 6 (see Fig. S1 in the supplemental material) against sera from cattle infected, as confirmed by culture, with B. abortus and with sera from randomly selected non-Brucella-infected cattle. The second objective of this study was to evaluate how effective each antigen was at serological resolution of FPSRs.
MATERIALS AND METHODS
Oligosaccharide synthesis.
The d-Rha4NFo oligosaccharide antigens were synthesized and conjugated to bovine serum albumin (BSA) as described elsewhere (14, 15). These possess different numbers of d-Rha4NFo units and linkage types (see Fig. S1 in the supplemental material). For glycoconjugates 1 to 6, the number of oligosaccharide copies conjugated to BSA was 14 to 17.
Serology.
The serum agglutination test (SAT) using sLPS was performed as described previously (4), as was the complement fixation test (CFT), following the warm fixation method. The fluorescent polarization assay (FPA) was performed as described previously (20). The competitive enzyme-linked immunosorbent assay (cELISA) was also performed as described previously (22) following the principles set out by the World Organization for Animal Health (OIE). The cELISA employs an M-dominant smooth lipopolysaccharide (sLPS) derived from B. melitensis 16M, and competition against polyclonal serum antibodies is mediated though the anti-M-specific MAb BM40 (23). The indirect enzyme-linked immunosorbent assay (iELISA) using sLPS (derived from B. abortus S99) was performed as described previously (24) following the principles set out by the OIE.
To perform iELISA with the synthetic oligosaccharides, their BSA conjugates were passively coated onto standard polystyrene 96-well ELISA plates (Nunc) by overnight incubation at 4°C in 100 μl of carbonate buffer per well (pH 10.0) at a concentration of 2.5 μg/ml. The plates were then washed four times with 200 μl of phosphate-buffered saline per well (containing 0.5% Tween 20) and then tapped dry. Sera were diluted 1:50 in casein blocker, and 100 μl was added to each well (each sample was tested in duplicate, and the average was taken as the final result). Positive and negative serum controls plus blank wells without serum added were applied to each plate. The plates were incubated for 30 min at room temperature on a rotary shaker at 160 rpm. The plates were then washed and tapped dry as described above. Horseradish peroxidase-conjugated polyclonal rabbit anti-bovine IgG1 was added, 100 μl per well, at a working strength that had previously been empirically established (the same conjugate concentration was used for all synthetic antigen ELISAs). The plates were then incubated as described for sera and then washed and tapped dry as described above. Each well of the plates was then developed with 100 μl of 0.015% H2O2 substrate and 0.5 mg/ml of 2,2′-azinobis(3-ethylbenzthiazolinesulfonic acid) chromogen diluted in a pH 4.0 buffer. The color was allowed to develop for 15 min (±2 min); then, 100 μl of 1 mM sodium azide solution was added, and the optical density (OD) for each well at 405 nm was read using a spectrophotometer. Prior to calculating the results for each sample, the OD for the blank reference was subtracted from all other values. The results for each serum sample were then expressed as a percentage of the plate-positive serum control.
Serum samples.
All sera were from archived (frozen) samples. Classical (SAT and CFT) serology was performed prior to freezing. The remaining assays were performed on thawed samples. There were five populations of cattle sera evaluated within this study. These were as follows. There were a total of 45 samples from individual animals, each confirmed by bacterial culture (17) from fresh tissues to be field infected with A-dominant strains of B. abortus (biovars 1 or 3). These are henceforth referred to as “culture-positive” samples. There were also 68 samples from individual animals whose sera were collected from within Great Britain between 1996 and 1999, more than 10 years since the declaration of its officially brucellosis-free status. These sera were all positive for at least one of the four conventional assays: CFT (n = 44), SAT (n = 24), cELISA (n = 58), or iELISA (n = 64). Eight of the samples were positive in all four assays, 36 were positive in three, 16 were positive in two, and 8 were positive in one. Other than serology, there was no cultural or epidemiological evidence of the disease. These are henceforth referred to as FPSR samples. In addition, 125 randomly selected serum samples collected from non-Brucella-infected cattle from Great Britain after 2007 were also included; these are henceforth referred to as “random noninfected” samples. Serum samples from eight cattle experimentally infected as described previously were also evaluated (20), four with B. abortus strain 544 (an A-dominant strain) and four with Y. enterocolitica O:9. All animal procedures were conducted in accordance with the United Kingdom Animal (Scientific Procedures) Act of 1986.
Infection from field and experimental cases was confirmed by the isolation of Brucella by bacterial culture (17) from either tissue (lymph nodes, blood, or abortion material), vaginal swabs, or milk culture, depending upon the particular case.
Statistical analysis.
Each ELISA's diagnostic efficacy was determined by receiver operator characteristic (ROC) curve analysis to find the area under the ROC curve (AUC) and its 95% confidence interval and also by identifying the maximum (optimal) Youden index (YImax) (YI = diagnostic sensitivity [DSn] + diagnostic specificity [DSp] − 1). Each method reflects the ability of the assay to correctly classify samples from those animals that are infected with Brucella from those that are not. This was done with the assistance of GraphPad Prism 6 software. DSn and DSp were calculated according to the standard convention (25). Testing for significant differences between the AUC values, performed according to published methods (26, 27), and one-way P values based on an approximation of the normal distribution are presented.
RESULTS
The diagnostic efficacy of the synthetic oligosaccharide antigens was evaluated on two levels, their initial ability to differentiate between “culture-positive” and “random noninfected” samples and their ability to differentiate between “culture-positive” and FPSR samples. In the first case, the nonasaccharide 6 (nona-6), pentasaccharide 5 (penta-5), and tetrasaccharide 4 (tetra-4) antigens provided perfect discrimination (AUC, 1; DSn and DSp, 100%). The disaccharide antigen 1 was marginally less effective, with one false-negative resulting in an AUC of 0.9928 and optimized DSn and DSp values of 97.78% and 100%, respectively. The DSn of the conventional assays (Table 1) were 100.0% for the B. abortus sLPS (strain S99) iELISA, 97.78 for the B. melitensis sLPS (strain 16M) cELISA, 93.33 for the SAT, and 84.44 for the CFT. The synthetic oligosaccharide iELISA results are shown by way of scatter plot (see Fig. S2 [nona-6 and penta-5] and S3 [tetra-4 and disaccharide 1] in the supplemental material).
TABLE 1.
Diagnostic performance statistics based upon discrimination between “culture-positive” and FPSR seraa
| Assay or antigen | AUC | 95% CIb of AUC | YI (%) | DSp (%) | DSn (%) |
|---|---|---|---|---|---|
| B. abortus S99 sLPS iELISAc | NA | NA | 5.88 | 5.88 | 100.00 |
| B. melitensis 16 M sLPS cELISAc | NA | NA | 12.48 | 14.71 | 97.78 |
| CFT | NA | NA | 19.74 | 35.29 | 84.44 |
| SAT | NA | NA | 58.04 | 64.71 | 93.33 |
| Nonasaccharide 6d | 0.8317 | 0.7512–0.9122 | 57.13max | 88.24 | 68.89 |
| Pentasaccharide 5d | 0.8667 | 0.8019–0.9314 | 61.74max | 66.18 | 95.56 |
| Trisaccharide 2, terminal α(1→2)d | 0.8672 | 0.7976–0.9367 | 60.91max | 76.47 | 84.44 |
| B. melitensis 16 M sLPS cELISAd | 0.8817 | 0.8055–0.9579 | 68.98max | 86.76 | 82.22 |
| B. abortus S99 sLPS iELISAd | 0.8922 | 0.8290–0.9553 | 69.05max | 77.94 | 91.11 |
| Trisaccharide 3, terminal α(1→3)d | 0.8987 | 0.8334–0.9640 | 72.68max | 88.24 | 84.44 |
| Tetrasaccharide 4d | 0.9046 | 0.8478–0.9613 | 67.45max | 94.12 | 73.33 |
| Disaccharide 1d | 0.9310 | 0.8776–0.9845 | 78.60max | 89.71 | 88.89 |
Diagnostic performance statistics for conventional assays and iELISAs developed with synthetic oligosaccharide antigens.
CI, confidence interval; NA, not applicable.
ELISAs evaluated according to pre-established positive/negative cutoffs.
ELISAs evaluated by ROC methods to generate AUC and YImax values using the samples described in this study.
All the serodiagnostic assays were applied to the FPSR samples, and their diagnostic efficacies are summarized in Table 1. The four conventional assays are listed first. Their positive/negative cutoff thresholds have already been established, and therefore ROC AUC values are not applicable. Their YI, DSp, and DSn values, based on these established cutoffs, are presented, and they show that assays with the highest DSn values have the lowest DSp values. This is epitomized by the iELISA with the B. abortus sLPS (strain S99) antigen, which has 100% DSn but very poor specificity (only 5.88%). The B. melitensis sLPS (strain 16M) cELISA fared a little better, with higher YI due to increased DSp at the cost of reduced DSn. The DSp of the CFT and SAT were each considerably higher, but this was offset to some degree by the lower DSn.
The ROC AUC values for all the ELISAs performed in this study are also presented (Table 1). It was possible to reevaluate the sLPS ELISAs by ROC methods owing to their quantitative output, and it was deemed relevant to do so in order that their diagnostic performance may be more equitably compared to that of the synthetic oligosaccharide iELISAs. The assays are listed in descending order of AUC values such that the best antigen/assay is at the bottom of the table. The data show that, with regard to the resolution of FPSRs, the native sLPS-based ELISAs (after ROC analysis) have greater AUC values than the ELISAs developed with nona-6, penta-5, and trisaccharide 2 (with terminal α[1→2] link) antigens. Trisaccharide 3 (with a terminal α[1→3] link), tetra-4, and disaccharide 1 ELISAs each have higher AUC values. Of the synthetic antigens, with the interesting exception of trisaccharides 2 and 3, the lower the number of α(1→2) links, the higher the AUC. This culminates in the finding that the disaccharide 1 with only one link, an α(1→3) link, gives the best AUC value of any antigen.
The YImax data show a similar trend for the AUC data. In this case, the sLPS ELISAs had the 3rd and 4th best results. These YImax values were exceeded by those from trisaccharide 3-based iELISA, with the disaccharide 1-based iELISA having the highest YImax value. As for the AUC data, the nonasaccharide 6-based iELISA had the lowest YImax value out of the antigens evaluated.
The AUC values relating to the resolution of FPSRs were compared in order to identify any significant differences between the AUC data for two given assays (see Table S1 in the supplemental material). Most comparisons were not significant (P > 0.05), but comparisons involving the antigens with the highest and lowest AUC values did yield some significant differences (P < 0.05). The AUC of nonasaccharide antigen 6 was significantly lower than the AUC for all other antigens except the pentasaccharide 5 and trisaccharide 2 with the terminal α(1→2) link. Disaccharide antigen 1 had a significantly greater AUC than those of the nona-6, penta-5, and trisaccharide 2 antigens. The only other significant comparison was that between tetrasaccharide 4 and trisaccharide 2.
Summary data for the iELISAs are presented in much greater detail by scatter plot (see Fig. S2 to S4 in the supplemental material), where the distribution of results for each sample population can clearly be seen. There is considerable overlap between the results for the “culture-positive” and FPSR samples for each of the nona-6 and pentasaccharide 5 antigens (see Fig. S2 in the supplemental material). There is a much-decreased level of overlap between these two populations when the tetrasaccharide 4 and, particularly, when the disaccharide 1 antigens are applied (see Fig. S3 in the supplemental material). The results for the FPSR samples overlap much more with the results from the “culture-positive” samples for the trisaccharide 2 with the terminal α(1→2) link than observed with the data from the terminally α(1→3)-linked trisaccharide 3 (see Fig. S4 in the supplemental material). This is countered to some extent by a decreased sensitivity for some of the “culture-positive” samples.
The distribution of the data for the B. abortus (strain S99) sLPS and disaccharide 1 antigen iELISAs, which had the highest AUC and YImax values, is similar to that seen with tetra-4 and disaccharide 1 (see Fig. S3 in the supplemental material). The sLPS antigen has good sensitivity but allows considerable crossover between the distributions of the two sample population types. The positive/negative cutoffs (22.45% for the disaccharide 1 antigen and 37.10% for the sLPS antigen) that result in the YImax values for each assay, based on the evaluation of the “culture-positive” samples and the FPSR samples, are plotted in Fig. 1. This divides the scatter plot into four quadrants, with the upper right and lower left quadrants containing datum points that have the same qualitative interpretation for each assay. The upper left and lower right quadrants display discordant data. The lower right quadrant in particular shows the results for 13 FPSR samples positive by sLPS antigen but negative when disaccharide 1 antigen was applied.
FIG 1.

Results (expressed as a percentage of a positive control) for the conventional B. abortus strain S99 sLPS (x axis) and the M disaccharide-BSA conjugate 1 iELISAs (y axis). Solid blue diamonds, results for sera from cattle confirmed as infected with A-dominant strains of B. abortus (n = 45) (“culture-positive” sera); open red triangles, results for sera from non-Brucella-infected cattle that are positive in one or more conventional serodiagnostic assays (n = 68). The horizontal and vertical dashed lines show the positive and negative cutoffs for the disaccharide 1 antigen (22.45%) and for the sLPS antigen (37.10%), respectively, that result in the YImax value for each assay (based on the evaluation of the “culture-positive” and FPSR samples).
All the serological assays were also applied to samples from cattle experimentally infected with either B. abortus strain 544 or Y. enterocolitica O:9. To analyze the data, the positive/negative cutoff for each assay was set at the highest value at which all 16 samples from the four Brucella-infected animals were classified as positive. The specificity values shown in Table 2 are the percentages of the 16 samples from the 4 Y. enterocolitica O:9-infected cattle that were negative at this assigned cutoff.
TABLE 2.
Specificities of serodiagnostic assays applied to samples from experimentally infected cattlea
| Assay and/or antigen | Specificity (%) (no. of negative results) |
|---|---|
| Conventional assays and antigens | |
| Serum agglutination test (SAT) | 37.5 (6) |
| B. abortus S99 sLPS iELISA | 50.0 (8) |
| Fluorescence polarization assay (FPA) | 50.0 (8) |
| B. melitensis 16 M sLPS cELISA | 56.25 (9) |
| Complement fixation test (CFT) | 62.5 (10) |
| Synthetic oligosaccharide antigen iELISAs | |
| Nonasaccharide 6 | 62.5 (10) |
| Pentasaccharide 5 | 62.5 (10) |
| Trisaccharide, terminal α(1→2) 2 | 68.75 (11) |
| Tetrasaccharide 4 | 75.0 (12) |
| Trisaccharide, terminal α(1→3) 3 | 81.25 (13) |
| Disaccharide 1 | 87.5 (14) |
Cattle were infected with either B. abortus strain 544 (n = 4) or Y. enterocolitica O:9 (n = 4), and 4 samples per animal were taken (at weeks 3, 7, 16, and 24 postinfection). To analyze the data, the positive/negative cutoff was set at the highest value at which all 16 samples from the four Brucella-infected animals were classified as positive. Each specificity shown is the percentage of the 16 samples from the four Y. enterocolitica O:9-infected cattle that were negative at this assigned cutoff.
Of the conventional assays, the SAT was the least specific, and the CFT was the most specific. The B. abortus S99 sLPS iELISA and the FPA measured half of the samples from the Y. enterocolitica O:9-infected animals as having a greater response than the lowest titer sample from the B. abortus-infected cattle. The cELISA was marginally better than this. Within this context, synthetic oligosaccharides 1 to 6 outperformed all of the conventional assays, with the exception of the CFT. In a pattern of performance very similar to that observed from the field FPSRs, the shorter oligosaccharides with fewer α(1→2) links were increasingly effective. As before, trisaccharide 3 was more effective than trisaccharide 2 and, in this case, exceeded the performance of tetrasaccharide 4. As before, disaccharide 1 was the most effective at resolving false-positive samples.
The individual datum points derived from the application of the B. abortus S99 sLPS and disaccharide iELISAs to the sera from the infected cattle are shown within line graphs (Fig. 2 and 3, respectively). There are similarities between the data generated from each of the antigens; for example, in each case, the titers for the samples derived from the Y. enterocolitica O:9-infected animals generally fell from 3 weeks postinfection. By week 7 in each of the iELISAs, the serum populations were less overlapped and, on a week-by-week basis, there was no further overlap between the two serum populations. However, owing in large part to the high residual titers of the samples from Y. enterocolitica O:9-infected animal 2 and the substantial fall in titers of the samples derived from B. abortus-infected cattle 2 and 3, the overall data from the B. abortus sLPS iELISA are much more confounded than those derived from the disaccharide 1 antigen iELISA.
FIG 2.
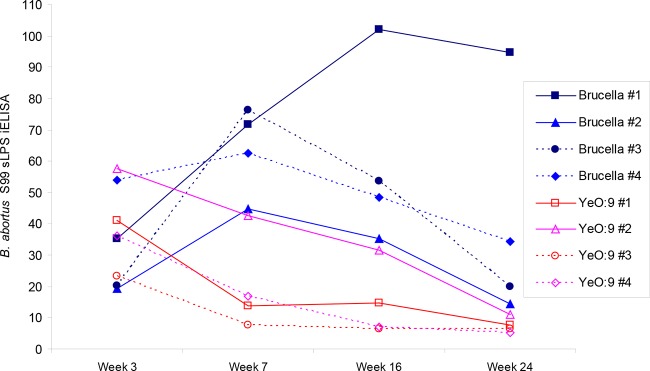
Results of the conventional B. abortus strain S99 sLPS iELISA (y axis) are shown against the numbers of weeks postinfection (x axis). Blue lines with solid datum points, results from four B. abortus strain 544-infected cattle; red lines with open datum points, results from four Y. enterocolitica O:9 experimentally infected cattle. Each datum point type and line denotes results for a specific animal, as shown in the legend.
FIG 3.
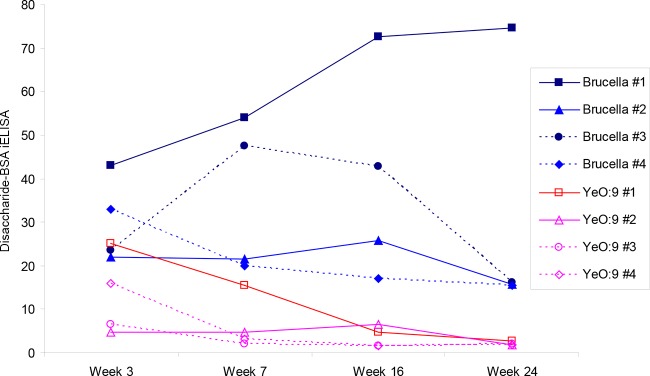
Results of M disaccharide-BSA conjugate 1 iELISAs (y axis) are shown against the numbers of weeks postinfection (x axis). Blue lines with solid datum points, results from four B. abortus strain 544-infected cattle; red lines with open datum points, results from four Y. enterocolitica O:9 experimentally infected cattle. Each datum point type and line denotes results for a specific animal, as shown in the legend.
DISCUSSION
The awareness and basis of anti-Brucella OPS MAb binding specificity has been in place since the 1980s. Much less is known about how this relates to the specificity of the polyclonal anti-OPS repertoire. The domination of the antibody response by the common OPS epitopes has been inferred from the effectiveness of Y. enterocolitica O:9 sLPS as a diagnostic antigen for serodiagnosis (28) and the limited qualitative differences observed when Brucella sLPS of differing serotypes have been applied in this role (29).
The purpose of this study was to investigate the effectiveness of synthetic d-Rha4NFo oligosaccharides as serodiagnostic antigens for bovine brucellosis. A range of structures were evaluated; those that were longer were hypothesized to possess good sensitivity, while those that were shorter but still contained an α(1→3) link were hypothesized to possess greater specificity.
Synthetic antigens 1 to 6 were evaluated against the “culture-positive” serum population, and four of the antigens were also evaluated against the “random noninfected” sera. The results (Fig. 1; see also Fig. S2 to S4 in the supplemental material) show that the nona-6, penta-5, and tetra-4 each provide perfect discrimination between the two population types (AUC, 1). Disaccharide antigen 1 also provided excellent discrimination (AUC, 0.9928). Nona-6 and penta-5 antigens have been shown to bind to monoclonal antibodies (15), and their binding to polyclonal sera is not unexpected. The pentasaccharide 5 antigen was shown to bind preferentially to anti-M than to anti-A MAbs; thus, one may hypothesize that it would be a less sensitive diagnostic applied to sera from cattle infected with an A-dominant B. abortus strain. This was not the case, and recent pilot studies have also demonstrated the diagnostic potential of even shorter oligosaccharides (14). Indeed, tetrasaccharide 4 exhibited perfect diagnostic performance even in the absence of any recognized A or C/Y epitopes within its structure (as there are no contiguous α[1→2] links within it). Disaccharide 1 contained no α(1→2) links. Remarkably, it too gave excellent diagnostic results against these two populations of sera.
It was hypothesized that oligosaccharides 1 to 4, which were designed to be M epitopes, would provide superior diagnostic specificity compared to that of the native antigen. The rationale was that (i) cross-reacting sera would most likely contain antibodies to the A or C/Y epitopes, which are also found within the structure of Y. enterocolitica O:9 OPS, and that these would have lower affinity for the M epitope, (ii) as far as is known, the M epitope, is unique to Brucella, (iii) the M epitope is found in all B. abortus and B. melitensis strains evaluated to date, and (iv) although of low frequency in the OPS of A-dominant strains compared to the A and C/Y epitopes, the M epitope is still an abundant surface antigen.
The results against the FPSR sera show that, with the exception of trisaccharide antigens 2 and 3, the smaller the antigen and the fewer the number of α(1→2) links, the higher the AUC. This culminated in the superior performance of disaccharide antigen 1. This is the first time that it has been demonstrated that untreated polyclonal sera contain a specificity for epitopes containing the α(1→3) link. Furthermore, this has been demonstrated using sera derived from infection with A-dominant strains, which demonstrates the broad practical applicability of this diagnostic approach.
Trisaccharide antigens 2 and 3 are very similar in structure, with both of them containing each type of linkage, but they demonstrate different and interesting properties. Trisaccharide 3, with the α(1→3) link in the terminal position, has superior diagnostic properties (a higher AUC) compared to those of the other trisaccharide 2, with a terminal α(1→2) link. The sequence of the linkage is therefore relevant to antibody binding, with the terminal linkage particularly important. Therefore, the tip of the OPS/oligosaccharide plays a highly important role in antibody binding as well as the role played by the more recognized linear (internal) structures, such as the A, M, and C/Y epitopes. These types of interactions have been shown previously with MAbs binding to the OPS of the Vibrio cholerae O1 serotype (30), which has a structure very similar to that of the OPS from Brucella.
The information generated here, together with the recent structural analysis (8), provides good evidence from which to propose the structure of the Brucella OPS C epitope as the terminally α(1→2)-linked trisaccharide 2, as synthesized in this study. The penultimate terminal α(1→3) link plays a crucial role in differentiating this epitope from the OPS tip of Y. enterocolitica O:9 and also marks the structure as the end of the repeating unit found in all Brucella OPS, with the exception of B. suis biovar 2. This biovar, recently described as containing no α(1→3) links (10), lacks not only M epitopes but also C epitopes. This hypothesis supports previous speculation that the α(1→3) link must somehow be involved (31).
Given the influence of the tip epitope in generating the antibody repertoire, its impact must be considered. Although the second and third sugar units from the terminal end may have an important role in antibody binding, the terminal sugar is likely to be the most important. Evaluation of the interaction between the OPS from anti-Vibrio cholerae O1 and a serotype-specific MAb using synthetic sugars demonstrated that even a single monosaccharide bound highly effectively to the MAb. This suggests that the synthetic d-Rha4NFo oligosaccharides presented here all include tip epitope properties, which may affect diagnostic sensitivity and specificity.
This may explain why the disaccharide 1 antigen fell short of providing complete discrimination between the FPSR samples and those from the Brucella-infected animals. The imperfect specificity may also be due to an element of binding of anti-C/Y or anti-A to the α(1→3)-linked structure; however, this might be expected to occur with reduced affinity compared to the binding to the etiological α(1→2)-linked epitope.
The increased influence of the terminal linkages may also explain why the B. abortus S99 sLPS iELISA outperformed the nona-6 and penta-5 antigens in the task of resolving FPSRs. The sLPS structure is an amphiphilic macromolecule with a hydrophobic element (lipid A) that readily adsorbs to ELISA plate surfaces. Consequently, the tip of the OPS will be the element that protrudes from the plate's surface, in much the same way as from the surface of the bacterial cell, to preferentially interact with the serum antibodies. Compared to the M tetrasaccharide located at the surface of the Brucella sLPS on the OPS tip, the additional α(1→2)-linked d-Rha4NFo residues on the nonreducing terminal end of the nonasaccharide 6 may present a tip structure more akin to that displayed by the OPS of Y. enterocolitica O:9. This may override any benefit that may have existed by having a proportionally higher α(1→3) content than that of the native A-dominant OPS within the sLPS. The tetrasaccharide 4 shares the M epitope tip with the native OPS without additional α(1→2) links, and this may lie behind the marginally higher AUC value. Trisaccharide 3 and disaccharide 1 lack a terminal α(1→2) link, and this is probably the reason for their superior AUC.
However, comparisons between the sLPS and oligosaccharide antigens must be tempered with caution due to the different nature of the carrier molecules (e.g., BSA and core sugars plus lipid A) involved, differences in methodology together with limitations in the sample size, and the power of the analysis. Nevertheless, the data from the experimentally infected animals, where the etiology of the antibodies is unequivocally known, support many of the findings derived from the field samples. The diagnostic specificity of tetra-, tri-, and disaccharide antigens 1 to 4 exceeded the specificities of all the conventional assays. The diagnostic specificity increased as the proportions of α(1→3) links within the structures increased. However, as before, trisaccharides 2 and 3 somewhat bucked this trend and displayed the different diagnostic specificity characteristics as described above. Not only was disaccharide antigen 1 the most specific, but the results show that this specificity is not due to some slowly maturing antibody response as the titers are well established by 3-weeks postinfection.
In conclusion, the synthetic oligosaccharide conjugates make excellent antigens for the serodiagnosis of Brucella, oligosaccharides 1 to 4 having also been shown to bind human antibodies (14), and eliminate the need to culture this highly infectious zoonotic organism in order to obtain native antigens for this purpose. The unique ability to design bespoke structures allows, for the first time, the diagnostic potential of the OPS to be fully exploited. This is demonstrated by the improvements in diagnostic specificity demonstrated by disaccharide antigen 1. Indeed, this antigen demonstrates that remarkably small structures may possess immensely powerful properties. The data from trisaccharides 2 and 3 demonstrate the importance of the tip epitope, and this should be considered in future work. The information generated also has positive implications for the design of vaccines and differentiating infected from vaccinated animals (DIVA) assays for brucellosis. Where previously the induction of anti-OPS antibodies by smooth vaccine strains has been viewed as a problem, it now presents an opportunity.
Supplementary Material
ACKNOWLEDGMENTS
This work was supported by the Department for Environment, Food, and Rural Affairs, Great Britain, a Discovery grant from the Natural Science and Engineering Research Council of Canada (NSERC), and a grant from the Bill & Melinda Gates Foundation through the Grand Challenges Explorations initiative.
We have filed a patent application for the use of the oligosaccharides described within the article.
The findings and conclusions contained within are those of the authors and do not necessarily reflect the positions or policies of the funders.
Footnotes
Supplemental material for this article may be found at http://dx.doi.org/10.1128/JCM.03185-14.
REFERENCES
- 1.Poester FP, Samartino LE, Santos RL. 2013. Pathogenesis and pathobiology of brucellosis in livestock. Rev Sci Tech 32:105–115. [DOI] [PubMed] [Google Scholar]
- 2.Franco MP, Mulder M, Gilman RH, Smits HL. 2007. Human brucellosis. Lancet Infect Dis 7:775–786. doi: 10.1016/S1473-3099(07)70286-4. [DOI] [PubMed] [Google Scholar]
- 3.Godfroid J, Nielsen K, Saegerman C. 2010. Diagnosis of brucellosis in livestock and wildlife. Croat Med J 51:296–305. doi: 10.3325/cmj.2010.51.296. [DOI] [PMC free article] [PubMed] [Google Scholar]
- 4.OIE (World Organisation for Animal Health). 2009. Chapter 2.4.3. Bovine brucellosis, p 615–650. In OIE Biological Standards Commission (ed), Manual of diagnostic tests and vaccines for terrestrial animals. OIE, Paris, France: http://www.oie.int/fileadmin/Home/eng/Health_standards/tahm/2.04.03_BOVINE_BRUCELL.pdf. [Google Scholar]
- 5.Nielsen K, Yu WL. 2010. Serological diagnosis of brucellosis. Prilozi 31:65–89. [PubMed] [Google Scholar]
- 6.Bundle DR, Cherwonogrodzky JW, Perry MB. 1987. Structural elucidation of the Brucella melitensis M antigen by high-resolution NMR at 500 MHz. Biochemistry 26:8717–8726. doi: 10.1021/bi00400a034. [DOI] [PubMed] [Google Scholar]
- 7.Caroff M, Bundle DR, Perry MB, Cherwonogrodzky JW, Duncan JR. 1984. Antigenic S-type lipopolysaccharide of Brucella abortus 1119-3. Infect Immun 46:384–388. [DOI] [PMC free article] [PubMed] [Google Scholar]
- 8.Kubler-Kielb J, Vinogradov E. 2013. Reinvestigation of the structure of Brucella O-antigens. Carbohydr Res 378:144–147. doi: 10.1016/j.carres.2013.03.021. [DOI] [PMC free article] [PubMed] [Google Scholar]
- 9.Meikle PJ, Perry MB, Cherwonogrodzky JW, Bundle DR. 1989. Fine structure of A and M antigens from Brucella biovars. Infect Immun 57:2820–2828. [DOI] [PMC free article] [PubMed] [Google Scholar]
- 10.Zaccheus MV, Ali T, Cloeckaert A, Zygmunt MS, Weintraub A, Iriarte M, Moriyón I, Widmalm G. 2013. The epitopic and structural characterization of Brucella suis biovar 2 O-polysaccharide demonstrates the existence of a new M-negative C-negative smooth Brucella serovar. PLoS One 8:e53941. doi: 10.1371/journal.pone.0053941. [DOI] [PMC free article] [PubMed] [Google Scholar]
- 11.Kubler-Kielb J, Vinogradov E. 2013. The study of the core part and non-repeating elements of the O-antigen of Brucella lipopolysaccharide. Carbohydr Res 366:33–37. doi: 10.1016/j.carres.2012.11.004. [DOI] [PMC free article] [PubMed] [Google Scholar]
- 12.Bundle DR, Cherwonogrodzky JW, Gidney MA, Meikle PJ, Perry MB, Peters T. 1989. Definition of Brucella A and M epitopes by monoclonal typing reagents and synthetic oligosaccharides. Infect Immun 57:2829–2836. [DOI] [PMC free article] [PubMed] [Google Scholar]
- 13.Douglas JT, Palmer DA. 1988. Use of monoclonal antibodies to identify the distribution of A and M epitopes on smooth Brucella species. J Clin Microbiol 26:1353–1356. [DOI] [PMC free article] [PubMed] [Google Scholar]
- 14.Ganesh NV, Sadowska JM, Sarkar S, Howells L, McGiven J, Bundle DR. 2014. Molecular recognition of Brucella A and M antigens dissected by synthetic oligosaccharide glycoconjugates leads to a disaccharide diagnostic for brucellosis. J Am Chem Soc 136:16260–16269. doi: 10.1021/ja5081184. [DOI] [PubMed] [Google Scholar]
- 15.Guiard J, Paszkiewicz E, Sadowska J, Bundle DR. 2013. Design and synthesis of a universal antigen to detect brucellosis. Angew Chem Int Ed Engl 52:7181–7185. doi: 10.1002/anie.201302303. [DOI] [PubMed] [Google Scholar]
- 16.Weynants V, Gilson D, Cloeckaert A, Tibor A, Denoel PA, Godfroid F, Limet JN, Letesson JJ. 1997. Characterization of smooth lipopolysaccharides and O polysaccharides of Brucella species by competition binding assays with monoclonal antibodies. Infect Immun 65:1939–1943. [DOI] [PMC free article] [PubMed] [Google Scholar]
- 17.Alton GG, Jones LM, Angus RD, Verger JM. 1994. Techniques for the brucellosis laboratory (techniques et pratiques). INRA Editions, Paris, France. [Google Scholar]
- 18.Corbel MJ. 1985. Recent advances in the study of Brucella antigens and their serological cross-reactions. Vet Bull 55:927–942. [Google Scholar]
- 19.Garin-Bastuji B, Hummel N, Gerbier G, Cau C, Pouillot R, Da Costa M, Fontaine JJ. 1999. Non specific serological reactions in the diagnosis of bovine brucellosis: experimental oral infection of cattle with repeated doses of Yersinia enterocolitica O:9. Vet Microbiol 66:223–233. doi: 10.1016/S0378-1135(99)00010-3. [DOI] [PubMed] [Google Scholar]
- 20.McGiven J, Sawyer J, Perrett L, Brew S, Commander N, Fisher A, McLarnon S, Harper K, Stack J. 2008. A new homogeneous assay for high throughput serological diagnosis of brucellosis in ruminants. J Immunol Methods 337:7–15. doi: 10.1016/j.jim.2008.05.004. [DOI] [PubMed] [Google Scholar]
- 21.Caroff M, Bundle DR, Perry MB. 1984. Structure of the O-chain of the phenol-phase soluble cellular lipopolysaccharide of Yersinia enterocolitica serotype O:9. Eur J Biochem 139:195–200. doi: 10.1111/j.1432-1033.1984.tb07994.x. [DOI] [PubMed] [Google Scholar]
- 22.Stack JA, Perrett LL, Brew AP, MacMillan AP. 1999. Competitive ELISA for bovine brucellosis suitable for testing poor quality samples. Vet Rec 145:735–736. [PubMed] [Google Scholar]
- 23.Greiser-Wilke I, Moennig V. 1987. Monoclonal antibodies and characterization of epitopes of smooth Brucella lipopolysaccharides. Ann Inst Pasteur Microbiol 138:549–560. doi: 10.1016/0769-2609(87)90040-8. [DOI] [PubMed] [Google Scholar]
- 24.Thompson I, McGiven J, Sawyer J, Thirlwall R, Commander N, Stack J. 2009. Competitive electrochemiluminescence wash and no-wash immunoassays for detection of serum antibodies to smooth Brucella strains. Clin Vaccine Immunol 16:765–771. doi: 10.1128/CVI.00006-09. [DOI] [PMC free article] [PubMed] [Google Scholar]
- 25.Jacobson RH. 1998. Validation of serological assays for diagnosis of infectious diseases. Rev Sci Tech 17:469–526. [DOI] [PubMed] [Google Scholar]
- 26.Hanley JA, McNeil BJ. 1982. The meaning and use of the area under a receiver operating characteristic (ROC) curve. Radiology 143:29–36. doi: 10.1148/radiology.143.1.7063747. [DOI] [PubMed] [Google Scholar]
- 27.Hanley JA, McNeil BJ. 1983. A method of comparing the areas under receiver operating characteristic curves derived from the same cases. Radiology 148:839–843. doi: 10.1148/radiology.148.3.6878708. [DOI] [PubMed] [Google Scholar]
- 28.Bundle DR, Perry MB, Cherwonogrodzky JW, Duncan JR, Caroff M. May 1989. Antigenic polysaccharide specific for Brucella abortus and Yersinia enterocolitica serotype 0:9. US patent 4,831,126A.
- 29.Alonso-Urmeneta B, Marin C, Aragon V, Blasco JM, Diaz R, Moriyon I. 1998. Evaluation of lipopolysaccharides and polysaccharides of different epitopic structures in the indirect enzyme-linked immunosorbent assay for diagnosis of brucellosis in small ruminants and cattle. Clin Diagn Lab Immunol 5:749–754. [DOI] [PMC free article] [PubMed] [Google Scholar]
- 30.Villeneuve S, Souchon H, Riottot MM, Mazie JC, Lei P, Glaudemans CP, Kovac P, Fournier JM, Alzari PM. 2000. Crystal structure of an anti-carbohydrate antibody directed against Vibrio cholerae O1 in complex with antigen: molecular basis for serotype specificity. Proc Natl Acad Sci U S A 97:8433–8438. doi: 10.1073/pnas.060022997. [DOI] [PMC free article] [PubMed] [Google Scholar]
- 31.Laurent TC, Mertens P, Dierick JF, Letesson JJ, Lambert C, De Bolle X. 2004. Functional, molecular and structural characterisation of five anti-Brucella LPS mAb. Mol Immunol 40:1237–1247. doi: 10.1016/j.molimm.2003.11.037. [DOI] [PubMed] [Google Scholar]
Associated Data
This section collects any data citations, data availability statements, or supplementary materials included in this article.