

Abstract
Whole-genome next-generation sequencing (NGS) was used to retrospectively examine 57 isolates from five epidemiologically confirmed community outbreaks (numbered 1 to 5) caused by Salmonella enterica serovar Typhimurium phage type DT170. Most of the human and environmental isolates confirmed epidemiologically to be involved in the outbreaks were either genomically identical or differed by one or two single nucleotide polymorphisms (SNPs), with the exception of those in outbreak 1. The isolates from outbreak 1 differed by up to 12 SNPs, which suggests that the food source of the outbreak was contaminated with more than one strain while each of the other four outbreaks was caused by a single strain. In addition, NGS analysis ruled in isolates that were initially not considered to be linked with the outbreak, which increased the total outbreak size by 107%. The mutation process was modeled by using known mutation rates to derive a cutoff value for the number of SNP difference to determine whether or not a case was part of an outbreak. For an outbreak with less than 1 month of ex vivo/in vivo evolution time, the maximum number of SNP differences between isolates is two or four using the lowest or highest mutation rate, respectively. NGS of S. Typhimurium significantly increases the resolution of investigations of community outbreaks. It can also inform a more targeted public health response by providing important supplementary evidence that cases of disease are or are not associated with food-borne outbreaks of S. Typhimurium.
INTRODUCTION
Salmonella enterica serovar Typhimurium is the most common serovar isolated from humans and animals in Australia. Traditionally, surveillance and outbreak investigations of S. Typhimurium rely upon phage typing, which is based on the susceptibility of isolates to a set of bacteriophages. Phage type DT170 has been increasing steadily over the last decade in Australia and became the most frequent phage type in 2004. Therefore, phage typing has limited resolution for outbreak detection. More recently, multilocus variable-number tandem-repeat (VNTR) analysis (MLVA) has been adopted in public health reference laboratories across Australia for epidemiological typing because of its relatively high discriminatory power and ability to be harmonized (1). MLVA has also been used as a standardized method for outbreak detection in Europe (2, 3).
In New South Wales (NSW), Australia, all Salmonella isolates from public and private pathology providers are routinely referred to the NSW Enteric Reference Laboratory, Institute for Clinical Pathology and Medical Research (ICPMR), Westmead Hospital, for serotyping and MLVA typing using five VNTR loci (MLVA-5) (1). Prospective MLVA typing of S. Typhimurium has been useful for identifying outbreak clusters (1). In our current practice, recovery of five or more geographically clustered isolates of the same MLVA profile from patients with diarrhea within a 4-week period (cases in the same household are counted as one episode) signals that an outbreak has occurred and usually triggers an outbreak investigation by relevant public health units (1, 3). However, MLVA may not be sufficiently discriminatory for endemic MLVA profiles such as DT170, which accounted for up to 40% of the S. Typhimurium isolations from human patients in NSW (1), and similar MLVA profiles can potentially be found in epidemiologically unlinked cases.
Whole-genome next-generation sequencing (NGS) has been increasingly employed to prospectively identify outbreaks and characterize transmission events (4–7). It has major advantages over other pathogen characterization methods, as it promises a universal solution with high throughput and quality and a “future-proof” data format amenable to exchange and harmonization between laboratories. NGS complements existing epidemiological tools by allowing reconstruction of recent transmission chains and identification of sequential acquisitions and otherwise unrecognized epidemiological links (4). Investigations of hospital outbreaks of methicillin-resistant Staphylococcus aureus (7) and Clostridium difficile (5) by NGS allowed discrimination between apparently similar isolates collected within a short time frame. Recent studies have shown that NGS of bacterial genomes can detect superspreaders, predict the existence of undiagnosed cases and intermediates in transmission chains, suggest likely directionality of transmission, and identify unrecognized risk factors for onward transmission (8, 9). NGS has been used to distinguish outbreak isolates from nonoutbreak isolates of a few Salmonella serovars, including S. Typhimurium (10–13). However, changes at the genomic level between epidemiologically unrelated but genotypically similar isolates have not been fully elucidated.
This study aimed to examine the utility and resolution of NGS for molecular epidemiology of S. Typhimurium by sequencing isolates from five distinct and epidemiologically point source S. Typhimurium DT170 outbreaks in NSW. These outbreaks were detected by MLVA typing and have been previously investigated by the public health unit. The discriminatory power of NGS was (i) tested by determining its abilities to identify outbreak-related isolates and differentiate them from those unlinked to the outbreaks and (ii) compared by default to that of our current practice of prospective MLVA typing of S. Typhimurium to detect community outbreaks.
MATERIALS AND METHODS
Genome sequencing and assembly.
In total, 57 isolates from five outbreaks were sequenced. Five additional nonoutbreak isolates of the same phage type were also included for sequencing as background isolates (Table 1). These background isolates were selected because they had the same phage type (DT170). Three of five background isolates had MLVA profiles similar (differing by one locus) but not identical to those of the outbreak isolates. The remaining two differed from the other isolates at all five VNTR loci. A 250-bp paired-end library was constructed for each purified DNA sample with the NexteraXT kit (Illumina) and sequenced on the MiSeq (Illumina) platform. Genome sequencing was done in a multiplex of 24. The average number of reads after passing Illumina quality control was 1.6 million per strain, and the average read depth was 59-fold.
TABLE 1.
Epidemiological information for the 52 S. Typhimurium genomes used in this study
| Outbreak or strain | Onset datea | Source sample collection date | Outbreak period (days) | Setting | MLVA profile | No. of cases | Responsible vehicle | No. of isolates sequenced |
|
|---|---|---|---|---|---|---|---|---|---|
| Human | Other | ||||||||
| Outbreaks | |||||||||
| 1 | 11/9/06b | 11/17/06b | 9 | Institution | 3-11-7-12-523 | 47 | Mousse | 13 | 6 |
| 2 | 4/23/12 | 5/3/12 | 11 | Bakery | 3-9-8-12-523 | 27 | Ready-to-eat food | 9 | 2 |
| 3 | 2/15/11 | 3/4/11 | 18 | Restaurant | 3-9-7-14-523 | 6 | Fried ice cream | 6 | 2 |
| 4 | 2/26/12 | 4/11/12 | 46 | Restaurant | 3-9-7-13-523 | 20 | Raw-egg mayonnaise | 7 | 2 |
| 5 | 3/8/12 | 4/19/12 | 43 | Food outlet | 3-10-7-15-523 | 15 | Hommos | 9 | 1 |
| Background strains | |||||||||
| 842 | 3-9-7-12-523 | 1 | |||||||
| 843 | 4-14-14-12-490 | 1 | |||||||
| 844 | 3-9-7-12-523 | 1 | |||||||
| 944 | 4-14-14-0-517 | 1 | |||||||
| 1183 | 3-9-8-13-523 | 1 | |||||||
First human case linked to the outbreak identified or confirmed by genome sequencing in this study.
Month/day/year.
Reads were assembled with VelvetOptimiser (version 2.2.5, available at http://bioinformatics.net.au/software.velvetoptimiser.shtml) and Velvet (version 1.2.10) (14). Contigs were then compared to S. Typhimurium LT2 and reordered with progressiveMauve (version 2.3.1) (15).
Identification of SNPs.
SNPs were identified by read mapping, as well as alignments of de novo-assembled sequences, similar to the approach we used previously (16). Reads were mapped to the S. Typhimurium LT2 chromosomal genome (accession no. NC_003197) with the Burrows-Wheeler Aligner (BWA), version 0.7.5a (17). Raw SNP calls were filtered to ensure a quality score of ≥20, a cutoff of 20 reads covering the SNP site, and that ≥70% of the reads support the SNP. SNPs were also determined by comparison of de novo assembly genomes to the genome of strain LT2 with progressiveMauve. This was done to eliminate the problem with reads that may be mapped to repeats or homologous regions with mismatches being called SNPs. SNPs that were commonly identified by both methods made up the final list. The SNPs were separated into three categories: nonsynonymous, synonymous, and intergenic regions. The genetic distance between isolates from the different outbreaks was illustrated by using minimum spanning trees (MSTs) based on SNP differences (Fig. 1). MSTs were generated with Arlequin v. 3.1 (available at http://cmpg.unibe.ch/software/arlequin3).
FIG 1.

MSTs of S. Typhimurium outbreak isolates based on the number of SNPs among isolates within each outbreak. The numbers in the circles are the isolate identities. The number on each branch is the number of SNP differences.
Prophage and plasmid.
Prophage sequences were identified with PHAST (18), and their identities were confirmed with BLASTn against the GenBank nonredundant nucleotide sequence database. All of the isolates were known to contain pSLT. Reads were mapped to S. Typhimurium LT2 plasmid pSLT (accession no. NC_003277.1) with the BWA. Mapped reads were extracted with BamTools (19) and then assembled with VelvetOptimiser and Velvet, version 1.2.10 (14). Contigs were compared to the complete pSLT genome and reordered with progressiveMauve, version 2.3.1 (15).
Phylogenetic analysis.
SNPs identified in repeat regions, insertion sequences, or prophage sequences were excluded from phylogenetic analysis. The remaining SNPs were concatenated, and the maximum-parsimony tree was generated with the PAUP package (20) with a heuristic search based on the tree bisection and reconnection swap method. S. enterica serovar Enteritidis PT4 (NCTC13349) (accession no. AM933172) and S. enterica serovar Choleraesuis strain SC-B67 (accession no. AE017220) were used as outgroups.
A coalescent model of genetic variability of an outbreak.
To model SNP difference between isolates from the same outbreak, we assumed that for a mutation rate μ per genome per time unit and a time period T over which ex vivo/in vivo evolution occurs, the number of mutations between two isolates has a Poisson distribution with the parameter 2μT. The factor of 2 in 2μT accounts for both lineages from the isolates to their common ancestor. The upper limit of the number of SNP differences is computed as the 99th percentile of this distribution. We used three values for the mutation rate (low, intermediate, and high), as described in Results.
The data consist of m = 5 outbreaks. Let nj denote the sample size for the jth outbreak and Si denote the number of SNPs observed in the jth outbreak. We assumed that the standard coalescent model (21) applies to the contaminated source population of S. Typhimurium. Mutation occurs in genomes at a rate of μ per genome per generation, which is scaled in coalescent analysis to give the mutation parameter θ = 2Neμ, where Ne is the effective population size. Under the infinite-sites assumption (22), the probability distribution of the number of segregating sites (SNPs) for a sample of size n is.
We used this expression to obtain the maximum-likelihood estimate (MLE) of θ by using the likelihood function .
Nucleotide sequence accession numbers.
The genomic data obtained in this study were submitted to the GenBank database and assigned accession no. SRX754917 to SRX754973.
RESULTS
Selection of isolates and genomic variations between S. Typhimurium strains within an outbreak.
Five retrospective outbreaks with epidemiologically confirmed environmental sources were selected for this study, and both human and environmental isolates from sources of bacterial contamination were available for analysis (Table 1). These outbreaks were caused by S. Typhimurium DT170, but each was due to a different MLVA profile.
Outbreak 1 occurred in a residential college in November 2006, when 16 cases of severe gastroenteritis were diagnosed among students and staff over 2 days (23). S. Typhimurium DT170 with MLVA profile 3-11-7-12-523 was recovered from stool samples from all of the cases. The public health investigation suggested chocolate mousse as a possible common food source. The matching MLVA isolates were subsequently recovered from samples of leftover chocolate mousse. Thirteen human isolates and six isolates collected from chocolate mousse were retrieved for whole-genome sequencing.
Eight isolates, three from patients and five from chocolate mousse, were identical as the main genome type (Fig. 1). The remaining 11 isolates differed from the main type by 1 to 12 unique SNPs. Four human isolates and one mousse isolate differed from the main type by one SNP. Three human isolates differed from the main type by two SNPs, and one each differed by four or five SNPs. One human isolate differed by 12 SNPs, suggesting that more than one strain contaminated the food source. None of the SNPs was shared among those that differed from the main type, except on one occasion. Two human isolates shared an intergenic SNP but differed from each other by one nonsynonymous SNP.
In total, there were 31 SNPs among these isolates; 27 of which were found in coding regions, including 7 synonymous and 20 nonsynonymous SNPs. Two of the 20 nonsynonymous SNPs resulted in a stop codon in two different genes (see Table S1 in the supplemental material) and were present in two different isolates. There were no patterns indicating which genes were more prone to mutation, as all of the mutations occurred in different genes. There were two occasions when two SNPs were located in genes adjacent to each other (STM0639 and STM0640); one pair resulted in synonymous mutations, while the other had nonsynonymous mutations (STM2924 and STM2925). However, these four SNPs were not from the same isolates.
Outbreak 2 occurred in April 2012 and included 27 patients diagnosed with salmonellosis following the consumption of a ready-to-eat food from the same bakery in metropolitan Sydney (24). A public health inspection of the premises suggested cross-contamination of food prepared with equipment contaminated with raw eggs and led to the collection of several environmental swabs from which S. Typhimurium was subsequently recovered. All of the isolates had MLVA profile 3-9-8-12-523. We investigated nine isolates with the same MLVA profile and recovered from patients diagnosed with salmonellosis at the time of the outbreak and residing in the same geographical part of Sydney. One isolate each from a boot swab and a dirty eggshell rinse from the bakery was also examined. Of the nine human cases, only four were confirmed to be part of the outbreak on the basis of descriptive case series, four were deemed to be epidemiologically unrelated following the public health investigation, and one's association with the outbreak was unknown because the patient failed to attend the public health interview. Genome sequencing of all 11 isolates was performed. Eight isolates were found to be identical, including six from humans and the two isolates from the boot swab and dirty eggshell rinse. Of the eight identical human isolates, two had been regarded as epidemiologically unrelated. The remaining two epidemiologically unrelated isolates had only one SNP difference from the other eight human isolates (see Table S2 in the supplemental material). The isolate with no known epidemiological link to the outbreak had five SNP differences from the epidemiologically confirmed outbreak isolates. This isolate was collected the earliest, 13 days prior to the outbreak-associated isolates, suggesting that it may not have been part of the outbreak, although this case was within the 2-week window of the outbreak and thus was suspected to be part of the outbreak initially.
Outbreak 3 was associated with the consumption of fried ice cream at a restaurant in February 2011 (25). Eight isolates, six from patients, one from ice cream balls, and one from an ice cream container, were sequenced. All of the isolates had MLVA profile 3-9-7-14-523. One of the human cases had no apparent epidemiological links to the outbreak, while two others were not investigated by the public health unit, but these cases were temporally and spatially close to the outbreak. NGS demonstrated that the five isolates from the epidemiologically confirmed cases were identical. One of the two isolates with an unknown epidemiological link to the outbreak differed by one synonymous SNP, while the other was identical to the outbreak-related isolates, suggesting that these two isolates belonged to the outbreak. One isolate that was confirmed as unrelated showed 21 SNP difference from the other isolates in the set (see Table S3 in the supplemental material).
Outbreak 4 involved patients with S. Typhimurium gastroenteritis diagnosed in February 2012 and environmental isolates recovered from the implicated café in Sydney (26). The public health investigation traced back the source of infection to contaminated aioli and mayonnaise. Nine isolates, including seven from human cases and one each from aioli and mayonnaise samples, were obtained for NGS. All, except one of human isolates, were recovered from cases with confirmed epidemiological links to the café. All of the isolates had MLVA profile 3-9-7-13-523. Only seven of the eight outbreak-related isolates were found to be identical by NGS. Interestingly, the human isolate from a case that had no established links to the point source of S. Typhimurium contamination but was clustered with the outbreak by space and time had the same genome sequence as the other seven outbreak-related isolates, establishing its association with the outbreak (see Table S4 in the supplemental material).
Outbreak 5 occurred in March 2012 and was associated with a kebab food outlet in Sydney (26). Following the notification of human cases, public health investigation led to the recovery of S. Typhimurium from hommos. All of the cases occurred in the same geographical area of metropolitan Sydney within a 4-week period. Nine isolates from nine human cases were sequenced. Of the nine cases, one was confirmed to be linked to the source of contamination, seven showed no conclusive epidemiological links, and one isolate was deemed unrelated to the outbreak after epidemiological assessment. All nine human isolates and the isolate cultured from hommos had MLVA profile 3-10-7-15-523 and were subjected to NGS. The only human isolate known to be related to the outbreak was identical to the food isolate from hommos. Six of the seven isolates with unknown links were also identical to the outbreak-related isolates (see Table S5 in the supplemental material). Therefore, it was most likely that all of these isolates included in the analyses belonged to the same outbreak.
Genomic diversities and phylogenetic relationships of outbreak isolates.
Phylogenetic relationships of the 62 DT170 isolates were inferred from a maximum-parsimony tree generated with SNPs (Fig. 2). Only SNPs located in the “core” genes previously defined by Leekitcharoenphon et al. (27) were included in the phylogenetic analysis. We used 17 publicly available S. Typhimurium genomes, including 6 S. Typhimurium genomes previously reported by us (16). Only one tree was produced. All of the outbreak-related isolates clustered together with a bootstrap value of at least 90% and were clearly separated from the background isolates and isolates from other outbreaks. There were unique SNPs that grouped epidemiologically linked isolates into their respective outbreak clusters (Fig. 2). Five S. Typhimurium DT170 isolates with MLVA profiles that differed from MLVA profiles associated with the five outbreaks were examined as background isolates. Three of the five isolates had MLVA profiles similar (differing by one locus) but not identical to those of the outbreak isolates, while the remaining two differed from the other isolates at all five loci. None of these isolates were grouped with any of the outbreak isolates. The two background isolates that were more divergent by MLVA belonged to different lineages than the majority, which is not surprising, as we previously showed that DT170 (also known as DT108) is distinguished into three different lineages (16).
FIG 2.

Maximum-parsimony tree of S. Typhimurium genomes based on SNPs identified by mapping to the reference chromosome of S. Typhimurium LT2. Only SNPs in the “core” genome were included (27). The number on each branch is the number of SNP differences. Isolates representing each outbreak are demarcated with curly brackets followed by the outbreak numbers. The isolate source, either human (orange, epidemiologically confirmed; green, unknown epidemiological link; yellow, no epidemiological link) or environmental (blue), is noted next to the isolate number. In parentheses are the GenBank accession numbers of the publicly available genomes. The unit of the scale bar is the number of SNPs.
Modeling of SNP variation of an outbreak.
The isolates from the five outbreaks studied varied by 1 to 21 SNPs. This observation raised two important questions. First, if an outbreak is caused by a single strain introduced into food, how many SNPs should be used as a cutoff for a case to be attributed to the same outbreak if no epidemiological evidence is available? Second, if an outbreak is caused by more than one strain introduced into food, how many SNPs should be used as a cutoff to determine that there is more than one strain in the food source? To address these two questions, we modeled the SNP differences between isolates assuming a Poisson process of mutation (21). The number of SNP difference between two isolates within an outbreak, if they are derived from the same strain, depends on the elapsed time between the initial introduction of the strain into food to the time when the isolate was isolated from a human or food source during the outbreak and the mutation rate. There are three different mutation rates reported for S. Typhimurium; the lowest rate is 1.9 × 10⁻⁷ substitutions per site per year estimated from ST313 causing invasive infections in Africa (28), the intermediate rate is 3.4 × 10⁻⁷ substitutions per site per year from epidemic DT104 infections (29), and the highest rate is 12 ×10−7 substitutions per site per year from a DT135a outbreak (11). These rates gave low and high estimates of the upper limit of the observable SNP differences based on the 99th percentile of SNP differences under the Poisson mutation model (Fig. 3). The SNP differences depend on the elapsed time, which includes the time the organism spent (multiplying) in the food (ex vivo time) and the time it spent in the human host during infection (in vivo time). We refer to the sum of these two times as the ex vivo/in vivo evolution time. However, the time since the introduction (contamination) of the strain into food is almost always unknown and could vary from less than a day to several months. Therefore, we modeled the ex vivo/in vivo evolution time as 30 to 120 days (Fig. 3). For an outbreak with less than 1 month of ex vivo/in vivo evolution time, the upper limit, based on the 99th percentile of the number of SNP differences, is two or four SNPs at the lowest or highest mutation rate, respectively. However, if contaminated food is stored for up to 3 months (assuming that the bacteria replicated in the food during storage), the maximum number of SNPs is three or nine SNPs at the lowest or highest mutation rate, respectively. A 1-month period for ex vivo/in vivo evolution is generally the minimum, since our MLVA-based cluster detection of an outbreak used a 4-week window. Therefore, for outbreaks 2 and 3, a SNP difference of four as a cutoff ruled out isolate 1845 with 5 SNP difference and isolate 1833 with 21 SNPs differences as being linked with outbreaks 2 and 3, respectively. For outbreak 1, using a difference of four SNPs as a cutoff ruled out the possibility that the outbreak was caused by a single strain. It is likely that there were three strains in the food that caused the outbreak, with isolate 1695, differing by 5 SNPs, and isolate 1690, differing by 12 SNPs, belonging to different strains but closely related to the strain that caused the majority of the cases.
FIG 3.
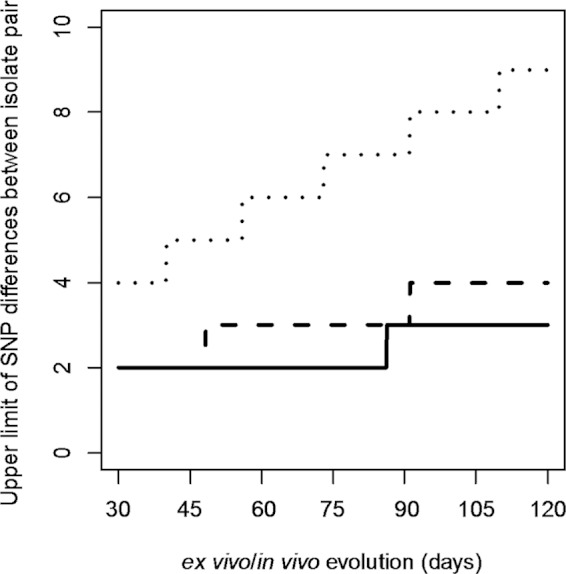
The number of SNP differences (99th percentile) between isolates under a Poisson process of mutation. The expected number of SNP differences observable between two isolates from the same outbreak equals the mutation rate times twice the total time the pathogen spent in the food and in the host when isolates were isolated (ex vivo/in vivo evolution time). We used three mutation rates and up to 120 days of ex vivo/in vivo evolution time to model the expected number of SNPs. The ex vivo/in vivo evolution time is defined as the period of time from when the strain was introduced into (contaminated) the food to the time when an isolate was obtained from either the human or food source during the outbreak. The three mutation rates used were 1.9 × 10⁻⁷ (28), 3.4 × 10⁻⁷ (29), and 12 ×10−7 (11) substitutions per site per year, which generated the low, intermediate, and high upper limits of the number of SNP differences between a pair of isolates of the same lineage; these are shown as solid, dashed, and dotted lines, respectively. Note that the lines are ladder-like because of sampling from a discrete distribution.
Additionally, the total number of SNPs observed among the isolates in an outbreak varies depending on the sample size and the time span of the outbreak if the source of the outbreak is a single strain. We modeled the probability distribution of the total number of SNPs in a sample of a given size under the coalescent model to enable prediction of the number of SNPs in a future outbreak sample, and their central 95% intervals can be predicted when a sample size (n) is given. The estimated sample sizes of the outbreaks were 17, 10, 7, 9, and 10 (in the order of outbreaks 1 to 5), and the estimated numbers of SNPs observed were 14, 2, 1, 1, and 2. The MLE of the population mutation parameter θ, which is proportional to the effective population size and the mutation rate (θ = 2Neμ), was 1.37 per generation (Fig. 4A). Using this θ estimate, the distribution of the SNP numbers for a sample size of eight can be calculated (Fig. 4B). The average number of SNPs, depending on the size of the sample, ranged from one to five for sample sizes of 2 to 20 with the lower and upper limits of the central 95% number of SNPs predicted by using the point estimate for θ, as shown in Fig. 4C.
FIG 4.

MLE of SNP variation of S. Typhimurium outbreaks. (A) Likelihood of the population mutation parameter θ. The MLE is 1.37 per generation. (B) Range of expected numbers of SNPs under the coalescent model assuming a sample size of eight. The central 95% are orange. The expected umber of SNPs was 3.56. (C) Mean and central 95% of the expected number of SNPs for sample sizes ranging from 2 to 20. The 0.025 and 0.975 quantiles are shown as dotted and dashed lines, respectively. The mean is shown as a blue line.
DISCUSSION
In this study, we have sequenced 57 isolates representing five point source community outbreaks caused by S. Typhimurium DT170 in Sydney, as well as five background isolates (Table 1). Our results demonstrated that the genomic diversity of isolates from the same outbreak was low, unless the food source of the outbreak was likely to be contaminated with more than one S. Typhimurium strain, which was observed in outbreak 1. We modeled the mutation process to derive a cutoff value for the number of SNP differences to decide whether a case was or was not part of an outbreak and to determine whether an outbreak was caused by more than one strain.
Since outbreak 1 occurred in a short period of time and in a confined community and all of the isolates obtained from affected individuals, as well as contaminated mousse, were confirmed to be epidemiologically linked, it was unexpected that the S. Typhimurium isolates from this outbreak would show high genomic diversity, with differences seen within and between food and human isolates. The difference in 12 SNPs between one human isolate and other human or food isolates involved in the outbreak caused by a single exposure strongly suggests that the food source was contaminated with another strain that was not sampled from the food source and must have diverged in the initial source and was not likely to have evolved in the mousse. This may also be the case for the human isolate differing by five SNPs from the main genome type on the basis of our modeling. This outbreak (i) exemplifies the need for samples from contaminated sources to make inferences about outbreaks based on genomic data alone and (ii) shows that epidemiologic and genomic data complement each other in investigations of outbreaks, particularly those caused by more than one strain.
Unlike outbreak 1, the other community outbreaks investigated in this study occurred over longer time spans with up to 2 weeks since the first case of S. Typhimurium gastroenteritis was confirmed by laboratory testing and the outbreak was detected by the spatiotemporal clustering of the same MLVA profile. It is noteworthy that the genetic diversity of isolates in these outbreaks remained characteristically low where the outbreak isolates were identical (outbreaks 2 to 4) or differed by one SNP (outbreak 5), in comparison to outbreak 1. Genome sequencing of human and environmental isolates suggested that the food source of outbreaks 2 to 5 was contaminated with a single S. Typhimurium strain. Our observations obtained from epidemiologically well-defined point source community clusters of S. Typhimurium gastroenteritis further strengthen the use of genomic data for the reconstruction of transmission pathways and the identification of sources of outbreaks.
For outbreaks 2 to 5, the human isolates with unknown epidemiological links to the outbreaks were also included in the analysis. In general, these isolates were from patients who were diagnosed within a 2-week period and who resided in the same or neighboring suburbs but were not interviewed by the public health unit at the time of the investigation. All of the isolates had the same MLVA profiles as the outbreak-related isolates. There were 11 isolates with this unknown status across the five outbreaks. Two of the 11 isolates had one SNP difference from the respective outbreak-related isolates, suggesting that they may have been genuinely associated with the outbreaks. Only 1 of the 11 isolates was likely to be unrelated, as it differed from the main type by five SNPs. Therefore, the remaining 10 isolates were likely to be part of the outbreak clusters. Similarly, of the six isolates confirmed to be epidemiologically unrelated by public health investigation, two were genomically indistinguishable from the outbreak-related isolates and three differed from the outbreak-related isolates by a single SNP each. Only one isolate was significantly different, with 21 SNPs. It is most likely that these six unrelated isolates were part of the outbreaks. The size of the outbreak clusters thus increases from 14 to 29 human cases (207%) if the isolates with unknown links are included. This demonstrates another significant benefit of NGS data in outbreak investigations—the ability to identify unsuspected epidemiological links and indirectly validate the completeness of epidemiological investigations.
Using NGS, we can infer the minimum outbreak period from the date of confirmation of the first outbreak-linked human case by genomic data to the date of source sample collection (Table 1). The shortest was 9 days for outbreak 1, and the longest was 46 days for outbreak 4, with an average of 25 days. Considering that the infecting source must have been continually present in the source environment before public health investigation and intervention, there must have been many more unidentified infections during this period. Therefore, the current practice of using at least five geographically clustered isolates with the same MLVA profile within a 4-week period to detect an outbreak can be improved by using genomic data. NGS could potentially be used to detect an impending outbreak much earlier by reducing the minimum number of clustered cases required to trigger an outbreak investigation, as NGS is much better able than MLVA to identify linked cases.
The threshold for the maximum SNP difference between isolates to be considered part of the outbreak has not been defined. We used three mutation rates and various ex vivo/in vivo evolution times to model the number of SNP differences observable between two isolates from the same contaminated food source via either clinical cases or the food source itself. In the scenario of an ex vivo/in vivo evolution time of 30 days, we found that a SNP difference of two or four with the lowest or highest mutation rate reported can be used to decide whether or not an isolate belongs to the outbreak. Since the highest mutation rate available was estimated from an actual outbreak caused by DT135a, we prefer to use this rate and thus a SNP difference of four as a cutoff. Future studies may obtain a better estimate of the mutation rate to derive an optimal cutoff. The ex vivo/in vivo evolution time is difficult to quantify and requires further studies. The in vivo evolution time is relatively short, as the incubation period for Salmonella infection is generally 24 to 48 h. The ex vivo evolution time does not simply equal the time the organism spent in the food and varies depending on food storage conditions since Salmonella multiplies at different rates at different temperatures (30, 31). Nevertheless, our study demonstrates that our modeling approach can generally be used to solve the dilemma of how many SNPs define whether or not a case is part of the outbreak. However, isolates that arose from mutator mutations (32) will carry more SNPs, which would need to be taken into account. None of our isolates seemed to carry mutator mutations.
Additionally, in food-borne outbreaks, it is always possible that more than one strain was introduced into the food causing the outbreak, as we observed in outbreak 1. We propose the same SNP difference cutoff to determine if there were one or multiple strains causing the outbreak provided there is firm epidemiological evidence. If there is any outbreak-related isolate that has a higher number of SNPs than the cutoff, then this divergent isolate belongs to a different strain than the majority type and the outbreak was caused by more than one strain. In contrast, if the outbreak-related isolates differ by a number of SNPs lower than the cutoff, then the outbreak was caused by a single strain.
One should note that the outbreaks in our study were short-lived, as they were promptly identified and contained and no cases of secondary transmission were suspected. In contrast, previous studies focused on relatively large community outbreaks or epidemic clones (29). Leekitcharoenphon et al. (13) showed that the SNP differences between isolates within the same outbreak ranged from 2 to 12 in five outbreaks (S. Typhimurium phage types U292, DT135, DT3, DT104, and DT120), with the exception of one outbreak caused by DT12, where the number of SNPs ranged from 3 to 30. In that study, the outbreak isolate collection dates were 2 days to 27 months apart and one would expect more SNPs in the prolonged outbreaks, although that study found that the lengths of the outbreaks showed no correlation with the number of SNP differences. Hawkey et al. (11) analyzed eight S. Typhimurium phage type DT135a isolates from five different outbreaks in 2005 to 2008. Unfortunately, only two outbreaks were represented by more than one isolate. The isolates in the two outbreaks differed by one to five SNPs. In our study, the SNP differences between isolates, with the exception of outbreak 1, were fewer within an outbreak than between outbreaks, as well as the background isolates. This was similar to the reports of both Leekitcharoenphon et al. (13) and Hawkey et al. (11).
In the event that a single strain/clone contaminates a food source to cause an outbreak, the total number of SNPs observed is correlated with the number of isolates obtained from human cases and the food source and also depends on the mutation rate and the length of an outbreak. We modeled the expected number of SNPs and its 95% intervals by using a coalescent model. Using the S. Typhimurium data from the five outbreaks, the expected number of SNPs is 3.56 for a sample size of 8, for example (Fig. 4). Our model did not incorporate sampling at different times, and it is expected that the longer the outbreak is, the more SNPs will be observed. However, the length of the outbreak can be incorporated into the model in further analysis. It would be interesting to see whether the estimate of the mutation parameter θ is relatively constant in a given species or clone. The outbreaks reported by Leekitcharoenphon et al. (13) and Hawkey et al. (11) cannot be used to get an estimate of the mutation parameter θ, as too few cases were sequenced in those studies.
The SNPs observed in this study were random events with no apparent adaptive roles. In total, there were 37 SNPs in the five outbreaks, with the majority in the outbreak 1 isolates. There were no SNPs that occurred across different outbreaks. The mutations were spread across the genome. Of the 37 SNPs, 21 were nonsynonymous, 20 of which were detected in outbreak 1. The significance of these nonsynonymous SNPs is unknown, as all of them appeared to be random mutations.
Other than SNP changes, there was no notable difference between isolates within the same outbreak or from different outbreaks, suggesting their homogeneity. All of the DT170 isolates analyzed in this study contained prophages Gifsy-1, Gifsy-2, and ST64B and a novel prophage with high similarity to P22-like phage SPN9CC (data not shown). All of the isolates in this study contained plasmid pSLT.
Conclusion.
This study showed the added value of genome sequencing in the investigation of point source community outbreaks of S. Typhimurium gastroenteritis. Our findings demonstrate that NGS provides the resolution that can clearly define outbreaks, identify the source of an outbreak, suggest unsuspected epidemiological links, and indirectly validate the completeness of epidemiological investigations. Our data show that public health investigations of S. Typhimurium outbreaks relying on MLVA typing may underestimate the size of the outbreaks.
Supplementary Material
ACKNOWLEDGMENTS
We thank the Enteric Team of the Communicable Disease Branch, the NSW Ministry of Health, and the NSW Enteric Reference Laboratory, ICPMR, Westmead, for their assistance in this study.
This study was supported by a grant from National Health and Medical Research Council (1050227).
Footnotes
Supplemental material for this article may be found at http://dx.doi.org/10.1128/JCM.03235-14.
REFERENCES
- 1.Sintchenko V, Wang Q, Howard P, Ha CW, Kardamanidis K, Musto J, Gilbert GL. 2012. Improving resolution of public health surveillance for human Salmonella enterica serovar Typhimurium infection: 3 years of prospective multiple-locus variable-number tandem-repeat analysis (MLVA). BMC Infect Dis 12:78. doi: 10.1186/1471-2334-12-78. [DOI] [PMC free article] [PubMed] [Google Scholar]
- 2.Larsson J, Torpdahl M, Petersen R, Sørensen G, Lindsted B, Nielsen E. 2009. Development of a new nomenclature for Salmonella Typhimurium multilocus variable number of tandem repeats analysis (MLVA). Eurosurveillance 14:pii=19174 http://www.eurosurveillance.org/ViewArticle.aspx?ArticleId=19174. [PubMed] [Google Scholar]
- 3.Torpdahl M, Sørensen G, Lindstedt B-A, Nielsen EM. 2007. Tandem repeat analysis for surveillance of human Salmonella typhimurium infections. Emerg Infect Dis 13:388. doi: 10.3201/eid1303.060460. [DOI] [PMC free article] [PubMed] [Google Scholar]
- 4.Bryant JM, Schurch AC, van Deutekom H, Harris SR, de Beer JL, de Jager V, Kremer K, van Hijum SA, Siezen RJ, Borgdorff M, Bentley SD, Parkhill J, van Soolingen D. 2013. Inferring patient to patient transmission of Mycobacterium tuberculosis from whole genome sequencing data. BMC Infect Dis 13:110. doi: 10.1186/1471-2334-13-110. [DOI] [PMC free article] [PubMed] [Google Scholar]
- 5.Eyre DW, Golubchik T, Gordon NC, Bowden R, Piazza P, Batty EM, Ip CL, Wilson DJ, Didelot X, O'Connor L, Lay R, Buck D, Kearns AM, Shaw A, Paul J, Wilcox MH, Donnelly PJ, Peto TE, Walker AS, Crook DW. 2012. A pilot study of rapid benchtop sequencing of Staphylococcus aureus and Clostridium difficile for outbreak detection and surveillance. BMJ Open 2:pii=e001124. doi: 10.1136/bmjopen-2012-001124. [DOI] [PMC free article] [PubMed] [Google Scholar]
- 6.Köser CU, Ellington MJ, Cartwright EJ, Gillespie SH, Brown NM, Farrington M, Holden MT, Dougan G, Bentley SD, Parkhill J, Peacock SJ. 2012. Routine use of microbial whole genome sequencing in diagnostic and public health microbiology. PLoS Path 8:e1002824. doi: 10.1371/journal.ppat.1002824. [DOI] [PMC free article] [PubMed] [Google Scholar]
- 7.Köser CU, Holden MT, Ellington MJ, Cartwright EJ, Brown NM, Ogilvy-Stuart AL, Hsu LY, Chewapreecha C, Croucher NJ, Harris SR, Sanders M, Enright MC, Dougan G, Bentley SD, Parkhill J, Fraser LJ, Betley JR, Schulz-Trieglaff OB, Smith GP, Peacock SJ. 2012. Rapid whole-genome sequencing for investigation of a neonatal MRSA outbreak. N Engl J Med 366:2267–2275. doi: 10.1056/NEJMoa1109910. [DOI] [PMC free article] [PubMed] [Google Scholar]
- 8.Nübel U, Strommenger B, Layer F, Witte W. 2011. From types to trees: reconstructing the spatial spread of Staphylococcus aureus based on DNA variation. Int J Med Microbiol 301:614–618. doi: 10.1016/j.ijmm.2011.09.007. [DOI] [PubMed] [Google Scholar]
- 9.Snitkin ES, Zelazny AM, Thomas PJ, Stock F, Henderson DK, Palmore TN, Segre JA. 2012. Tracking a hospital outbreak of carbapenem-resistant Klebsiella pneumoniae with whole-genome sequencing. Sci Transl Med 4:148ra116. doi: 10.1126/scitranslmed.3004129. [DOI] [PMC free article] [PubMed] [Google Scholar]
- 10.Allard MW, Luo Y, Strain E, Li C, Keys CE, Son I, Stones R, Musser SM, Brown EW. 2012. High resolution clustering of Salmonella enterica serovar Montevideo strains using a next-generation sequencing approach. BMC Genomics 13:32. doi: 10.1186/1471-2164-13-32. [DOI] [PMC free article] [PubMed] [Google Scholar]
- 11.Hawkey J, Edwards DJ, Dimovski K, Hiley L, Billman-Jacobe H, Hogg G, Holt KE. 2013. Evidence of microevolution of Salmonella typhimurium during a series of egg-associated outbreaks linked to a single chicken farm. BMC Genomics 14:800. doi: 10.1186/1471-2164-14-800. [DOI] [PMC free article] [PubMed] [Google Scholar]
- 12.Hoffmann M, Zhao S, Pettengill J, Luo Y, Monday SR, Abbott J, Ayers SL, Cinar HN, Muruvanda T, Li C, Allard MW, Whichard J, Meng J, Brown EW, McDermott PF. 2014. Comparative genomic analysis and virulence differences in closely related Salmonella enterica serotype Heidelberg isolates from humans, retail meats, and animals. Genome Biol Evol 6:1046–1068. doi: 10.1093/gbe/evu079. [DOI] [PMC free article] [PubMed] [Google Scholar]
- 13.Leekitcharoenphon P, Nielsen EM, Kaas RS, Lund O, Aarestrup FM. 2014. Evaluation of whole genome sequencing for outbreak detection of Salmonella enterica. PLoS One 9:e87991. doi: 10.1371/journal.pone.0087991. [DOI] [PMC free article] [PubMed] [Google Scholar]
- 14.Zerbino DR, Birney E. 2008. Velvet: algorithms for de novo short read assembly using de Bruijn graphs. Genome Res 18:821–829. doi: 10.1101/gr.074492.107. [DOI] [PMC free article] [PubMed] [Google Scholar]
- 15.Darling AE, Mau B, Perna NT. 2010. progressiveMauve: multiple genome alignment with gene gain, loss and rearrangement. PLoS One 5:e11147. doi: 10.1371/journal.pone.0011147. [DOI] [PMC free article] [PubMed] [Google Scholar]
- 16.Pang S, Octavia S, Feng L, Liu B, Reeves PR, Lan R, Wang L. 2013. Genomic diversity and adaptation of Salmonella enterica serovar Typhimurium from analysis of six genomes of different phage types. BMC Genomics 14:718. doi: 10.1186/1471-2164-14-718. [DOI] [PMC free article] [PubMed] [Google Scholar]
- 17.Li H, Durbin R. 2009. Fast and accurate short read alignment with Burrows-Wheeler transform. Bioinformatics 25:1754–1760. doi: 10.1093/bioinformatics/btp324. [DOI] [PMC free article] [PubMed] [Google Scholar]
- 18.Zhou Y, Liang Y, Lynch KH, Dennis JJ, Wishart DS. 2011. PHAST: a fast phage search tool. Nucleic Acids Res 39:W347–W352. doi: 10.1093/nar/gkr485. [DOI] [PMC free article] [PubMed] [Google Scholar]
- 19.Barnett DW, Garrison EK, Quinlan AR, Stromberg MP, Marth GT. 2011. BamTools: a C++ API and toolkit for analyzing and managing BAM files. Bioinformatics 27:1691–1692. doi: 10.1093/bioinformatics/btr174. [DOI] [PMC free article] [PubMed] [Google Scholar]
- 20.Swofford DL. 2003. PAUP*: phylogenetic analysis using parsimony (* and other methods), version 4. http://paup.csit.fsu.edu/Cmd_ref_v2.pdf..
- 21.Wakeley J. 2009. Coalescent theory: an introduction. vol 1 Roberts & Company Publishers, Greenwood Village, CO. [Google Scholar]
- 22.Tavaré S. 1984. Line-of-descent and genealogical processes, and their applications in population genetics models. Theor Popul Biol 26:119–164. doi: 10.1016/0040-5809(84)90027-3. [DOI] [PubMed] [Google Scholar]
- 23.Wang Q, Kong F, Jelfs P, Gilbert GL. 2008. Extended phage locus typing of Salmonella enterica serovar Typhimurium, using multiplex PCR-based reverse line blot hybridization. J Med Microbiol 57:827–838. doi: 10.1099/jmm.0.47766-0. [DOI] [PubMed] [Google Scholar]
- 24.OzFoodNet Working Group. 2012. Monitoring the incidence and causes of diseases potentially transmitted by food in Australia: annual report of the OzFoodNet network, 2012. http://www.ozfoodnet.gov.au/internet/ozfoodnet/publishing.nsf/content/reports-1 Department of Health, Office of Health Protection, Canberra, Australia. [Google Scholar]
- 25.OzFoodNet Working Group. 2011. Monitoring the incidence and causes of diseases potentially transmitted by food in Australia: annual report of the OzFoodNet network, 2011. http://www.ozfoodnet.gov.au/internet/ozfoodnet/publishing.nsf/content/reports-1 Department of Health, Office of Health Protection, Canberra, Australia. [Google Scholar]
- 26.OzFoodNet Working Group. 2012. OzFoodNet—enhancing foodborne disease surveillance across Australia. First quarter summary, 2012, NSW/Hunter New England OFN sites combined. http://www.health.nsw.gov.au/Infectious/diseases/Documents/1st_quarterly_ofn_report_2012.pdf Department of Health, Office of Health Protection, Canberra, Australia. [Google Scholar]
- 27.Leekitcharoenphon P, Lukjancenko O, Friis C, Aarestrup FM, Ussery DW. 2012. Genomic variation in Salmonella enterica core genes for epidemiological typing. BMC Genomics 13:88. doi: 10.1186/1471-2164-13-88. [DOI] [PMC free article] [PubMed] [Google Scholar]
- 28.Okoro CK, Kingsley RA, Connor TR, Harris SR, Parry CM, Al-Mashhadani MN, Kariuki S, Msefula CL, Gordon MA, de Pinna E, Wain J, Heyderman RS, Obaro S, Alonso PL, Mandomando I, MacLennan CA, Tapia MD, Levine MM, Tennant SM, Parkhill J, Dougan G. 2012. Intracontinental spread of human invasive Salmonella Typhimurium pathovariants in sub-Saharan Africa. Nat Genet 44:1215–1221. doi: 10.1038/ng.2423. [DOI] [PMC free article] [PubMed] [Google Scholar]
- 29.Mather AE, Reid SW, Maskell DJ, Parkhill J, Fookes MC, Harris SR, Brown DJ, Coia JE, Mulvey MR, Gilmour MW, Petrovska L, de Pinna E, Kuroda M, Akiba M, Izumiya H, Connor TR, Suchard MA, Lemey P, Mellor DJ, Haydon DT, Thomson NR. 2013. Distinguishable epidemics of multidrug-resistant Salmonella Typhimurium DT104 in different hosts. Science 341:1514–1517. doi: 10.1126/science.1240578. [DOI] [PMC free article] [PubMed] [Google Scholar]
- 30.McQuestin OJ, Musgrove MT, Tamplin ML. 2010. Kinetics of growth and inactivation of Salmonella enterica serotype Typhimurium DT104 in pasteurised liquid egg products. Food Microbiol 27:396–402. doi: 10.1016/j.fm.2009.11.013. [DOI] [PubMed] [Google Scholar]
- 31.Mitchell GA, Brocklehurst TF, Parker R, Smith AC. 1994. The effect of transient temperatures on the growth of Salmonella typhimurium LT2. I: cycling within the growth region. J Appl Bacteriol 77:113–119. [DOI] [PubMed] [Google Scholar]
- 32.LeClerc JE, Li B, Payne WL, Cebula TA. 1996. High mutation frequencies among Escherichia coli and Salmonella pathogens. Science 274:1208–1211. doi: 10.1126/science.274.5290.1208. [DOI] [PubMed] [Google Scholar]
Associated Data
This section collects any data citations, data availability statements, or supplementary materials included in this article.