Abstract
The ubiquitously expressed transcriptional regulator serum response factor (SRF) is controlled by both Ras/MAPK (mitogen-activated protein kinase) and Rho/actin signaling pathways, which are frequently activated in hepatocellular carcinoma (HCC). We generated SRF-VP16iHep mice, which conditionally express constitutively active SRF-VP16 in hepatocytes, thereby controlling subsets of both Ras/MAPK- and Rho/actin-stimulated target genes. All SRF-VP16iHep mice develop hyperproliferative liver nodules that progresses to lethal HCC. Some murine (m)HCCs acquire Ctnnb1 mutations equivalent to those in human (h)HCC. The resulting transcript signatures mirror those of a distinct subgroup of hHCCs, with shared activation of oncofetal genes including Igf2, correlating with CpG hypomethylation at the imprinted Igf2/H19 locus. Conclusion: SRF-VP16iHep mHCC reveal convergent Ras/MAPK and Rho/actin signaling as a highly oncogenic driver mechanism for hepatocarcinogenesis. This suggests simultaneous inhibition of Ras/MAPK and Rho/actin signaling as a treatment strategy in hHCC therapy. (Hepatology 2015;61:979–989)
Human hepatocellular carcinoma (hHCC) belongs to the five most lethal cancers worldwide.1 Liver cirrhosis, alcohol abuse, or chronic hepatitis virus infection, and type 2 diabetes-associated nonalcoholic steatohepatitis predispose to HCC. Despite their extreme heterogeneity, hHCCs could be classified (G1-G6, or S1-S3) based on gene expression signatures, genomic and epigenetic alterations.2–4 Aberrant activation of WNT/β-catenin, Jak/STAT, PI-3K/Akt signaling pathways, and activation of the Ras/MAPK (mitogen-activated protein kinase) and Rho/actin cascades cause HCC formation.3,5–7 Both Ras/MAPK and Rho/actin cascades regulate cell proliferation and differentiation.6 Rho/actin signaling additionally determines polarity, adhesion, and mechanosensory and migratory activities of normal and cancerous cells.8,9 Activation of Rho/actin signaling in hHCC is frequently elicited by deletion of Rho/Rac/Cdc42-inhibiting tumor suppressors, e.g., DLC1.7,8,10 DLC1 encodes a Rho inhibitor with Rho-GAP function and is deleted in up to 50% of liver cancers.7,10 Synergistic oncogenic crosstalk of Ras/MAPK and Rho/actin signaling has been described,11,12 but their joint impact on target gene expression remains unclear.
The transcription factor SRF (serum response factor) is activated by both Ras/MAPK and Rho/actin signaling, engaging distinct target gene profiles and involving alternative cofactors (ternary complex factors [TCFs], myocardin related transcription factors [MRTFs])13,14 (Fig. 1A). Elevated expression of SRF was reported in high-grade hHCCs.15,16 SRF was activated by the X and core proteins of hepatitis B virus (HBV) and C virus (HCV), respectively.17 DLC1-deleted HCC cells revealed activation of Rho/actin signaling and associated nuclear localization of SRF cofactors MRTF-A/B (MKL1/2).18 Furthermore, antiproliferative, prosenescence effects on HCC xenografts were obtained upon down-regulation of MRTFs/MKLs.19 Collectively, this implies SRF contributions to hHCC formation. We provide here the first in vivo evidence supporting this concept. We generated the SRF-VP16iHep mouse line, permitting conditional expression of the SRF-VP16 protein in hepatocytes upon Cre-mediated deletion of a STOP-flox cassette.20 SRF-VP16 carries the VP16 transcriptional activation domain of Herpes simplex virus, thereby eliciting constitutive SRF activity.21
Figure 1.
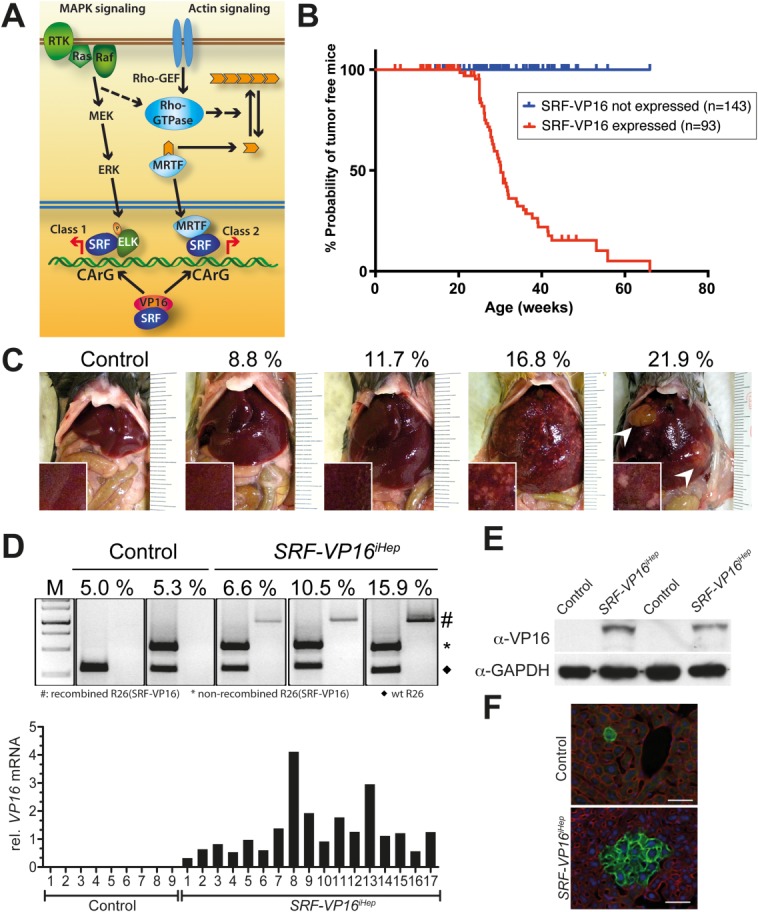
Murine hepatocyte-specific expression of SRF-VP16 leads to hepatocarcinogenesis. (A) Ras/MAPK and Rho/actin signaling target the SRF-cofactor module. Constitutively active SRF-VP16 acts independent of upstream signaling. (B) Kaplan-Meier survival curves of Alfp-CreERT2 mice, expressing (red) SRF-VP16 or not (blue). (C) SRF-VP16iHep livers show increasing numbers and sizes of premalignant nodules, as well as HCCs (arrowheads), correlating with increasing LBWR (%). (D) Rosa26(SRF-VP16) genomic PCR identifies Cre recombination-mediated loss of the STOP-flox cassette (upper). SRF-VP16 RNA expression: qRT-PCR (17 liver samples, increasing LBWR) (lower). (E) Western blotting identifying SRF-VP16 protein. (F) mT/mG-Cre indicator mice reveal spontaneous activation of Alfp-CreERT2 in livers of both control (upper) and SRF-VP16iHep (lower) mice (10 weeks old), the latter displaying proliferative cell expansion (scale bars = 50 μm).
In SRF-VP16iHep mice, conditional activation of SRF-VP16 elicited broad changes in hepatocellular gene expression resulting in hyperproliferative nodules, followed by rapid progression to HCC. Importantly, SRF-VP16iHep HCCs share molecular features with distinct subgroups of hHCCs, including overlapping gene expression signatures,2,22 activating Ctnnb1 mutations,23 and hypomethylation of Igf2/H19 oncofetal genes.22 Thus, SRF-VP16iHep mice identify the SRF-mediated convergence of sustained MAPK and Rho/actin signaling as an oncogenic driver of HCC.
Materials and Methods
Stochastic Hepatocyte-Specific Expression of SRF-VP16
Stop-floxed SRF-VP16 mice (Gt(ROSA)26Sortm1(SRF-VP16)Antu mice)20 were bred with Srf-flex1 (floxed Srf exon 1)24 and Alfp-CreERT2 animals (Supporting Fig. 1A) to obtain triple transgenic mice, Srfflex1/wt::SRF-VP16+/-::Alf-CreERT2+/– (termed SRF-VP16iHep; for polymerase chain reaction [PCR] genotyping: Supporting Materials and Methods). Liver specificity of CreERT2 activity (Supporting Fig. 1B), its tamoxifen-inducible activation (Supporting Fig. 1B), and its spontaneous activity (Supporting Fig. 1B,C) are evidenced. Animal housing and handling was in accordance with the Federation of European Laboratory Animal Science Associations and approved by local ethics committees (Regierungspräsidium Tübingen).
The Supporting Materials and Methods describe experimental details for the following: histological analysis, immunoblot analyses, and antibodies for immunoblotting and immunohistochemistry; analysis of genomic mutations of mHCCs; quantitative high-resolution DNA methylation analysis of murine samples; methylation profiling of hHCCs; expression profiling of hHCCs; genomic DLC1 status of hHCCs; CTNNB1 mutational analysis of hHCCs; expression profiling of murine samples; quantitative real-time PCR; isolation and analysis of murine intrahepatic immune cells (IHICs); statistical analysis.
Results
Constitutively Active SRF Causes Liver Expansion in SRF-VP16iHep Mice
Mice carrying the conditional Rosa26(SRF-VP16) allele20 were bred with animals expressing tamoxifen-inducible hepatocyte-specific CreERT2 (Alfp-CreERT2 mice) (Supporting Fig. 1A,B) to get SRF-VP16iHep mice. Treatment of SRF-VP16iHep mice with tamoxifen caused efficient induction of SRF-VP16 expression. However, marginal spontaneous activity of Cre-recombinase was observed in the absence of tamoxifen, leading to SRF-VP16 expression in a few hepatocytes. Employing the Cre-responsive mT/mG reporter allele (Supporting Materials and Methods), we quantified this spontaneous CreERT2 activation to generate per liver, within the first 10 weeks of age, an accumulated total of 0.38% ± 0.08% hepatocytes (n = 9) (Supporting Fig. 1C,D).
Spontaneous CreERT2 activation in SRF-VP16iHep mice caused hyperproliferation of effected hepatocytes, leading to multiple premalignant nodules throughout the livers, accompanied by age-dependent increases in liver mass reaching a liver weight-to-body weight ratio (LBWR) of up to 33% (Fig. 1C, Supporting Fig. 2). 80% of all animals developed HCC within 25-40 weeks of age (n > 93) (Fig. 1B,C; Supporting Fig. 2). Mice lacking either SRF-VP16 or CreERT2 alleles, or both, never developed increased LBWR or HCC during this time (n > 143). In livers of SRF-VP16iHep mice, but not of control animals, recombination and expression of SRF-VP16 was observed at DNA, RNA, and protein levels (Fig. 1D,E).
SRF-VP16iHep livers with LBWR greater than 15% displayed many macroscopically visible premalignant nodules (Fig. 1C), each likely derived from clonal expansion of an individual SRF-VP16-expressing hepatocyte. In support, we crossed the mT/mG Cre reporter allele into SRF-VP16iHep mice and identified, at the age of 10 weeks, multiple green nodules representing colonies of hepatocytes with CreERT2 activity (Fig. 1F, lower). Alfp-CreERT2 control animals lacking the SRF-VP16 allele, displayed multiple individual green cells rather than cell colonies (Fig. 1F, upper). Thus, spontaneous CreERT2-mediated activation of SRF-VP16 expression in a subset of hepatocytes caused their hyperproliferation, leading to premalignant nodules followed by progression to HCC.
Liver Expansion Upon Hyperproliferation of SRF-VP16-Expressing Hepatocytes
Liver histology of SRF-VP16iHep mice revealed foci of small hepatocytes in the perivenular parenchyma indicating hepatocellular proliferation. These foci rapidly expanded to hyperproliferative nodules composed of small basophilic hepatocytes with slightly enlarged nuclei, all strongly expressing the proliferation-associated SRF target gene Egr1 (Fig. 2A, upper). Increases in nodule size correlated with increasing LBWR (Fig. 2A, upper, 2B). All Egr1-positive nodules showed proliferative activity, displaying an average of 15% Ki67-positive cells (Fig. 2A, lower, 2C). While these nodules initially showed a clear demarcation to surrounding nonneoplastic parenchyma (Fig. 2D, left), in some lesions atypia developed and individual cells infiltrated into the surrounding parenchyma (Fig. 2D, right).
Figure 2.
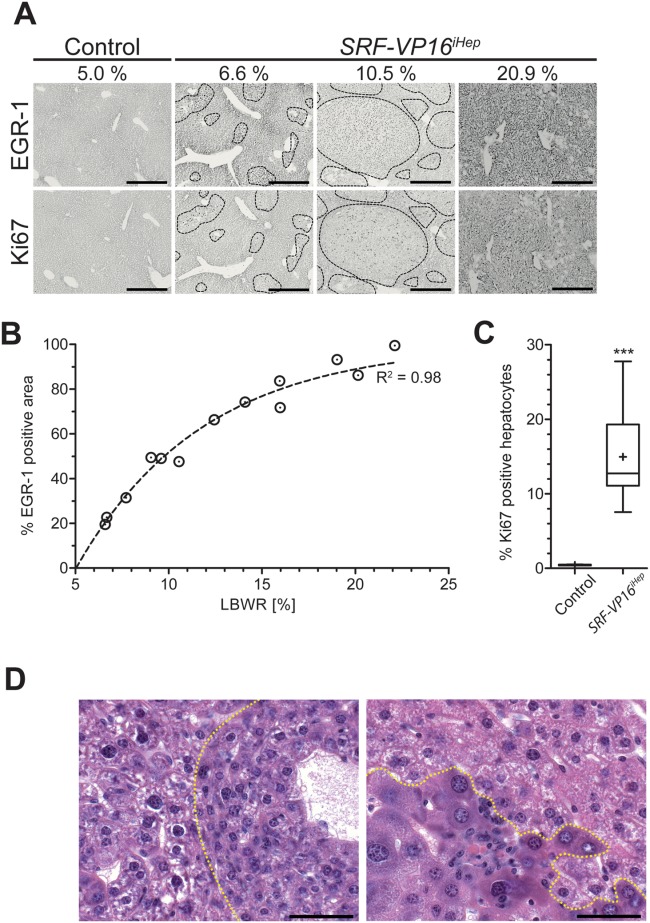
SRF-VP16 drives hepatocyte hyperproliferation and premalignant nodule formation. (A) Increasing LBWR (%) correlates with expanding premalignant nodules of Egr1-positive (upper) and Ki67-positive (lower) hyperproliferative hepatocytes. Scale bar = 500 μm. (B) Increasing LBWR correlates with sizes (EGR1-positive area) of hyperproliferative nodules (one-phase association: R2 = 0.977). (C) Quantitation of Ki67-positive hepatocyte nuclei in control (0.4 ± 0.03%) versus SRF-VP16iHep animals (7.5 to 27.5%; mean 15% ± 3%) (n = 11). (D) Hematoxylin and eosin (H&E) staining of SRF-VP16iHep livers with LBWR of 7.3% (left) and 10.8% (right). Hyperproliferative nodules display small-cell dysplasia of SRF-VP16 expressing hepatocytes (left panel, right of dotted line). Later stages show severe nuclear atypia, focal inflammatory cell infiltration, and single-cell invasion into the nonneoplastic tissue (right panel, below dotted line). Scale bar = 50 μm.
Progression From Hyperproliferative Nodules to HCC
All SRF-VP16iHep livers containing multiple hyperproliferative nodules displayed solid micro-trabecular growth of small basophilic hepatocytes (Fig. 3A,A′,D), expressing the polarity marker DPP IV of nontransformed hepatocytes.25 Above 20 weeks of age, the majority of animals (n = 51) harbored one to several macroscopically visible tumors (Fig. 3A-C) with pseudo-glandular and irregular trabecular growth patterns (Fig. 3E,F) as unequivocal characteristics of HCC. Tumor cells lost expression of DPP IV (Fig. 3E, right). Together, SRF-VP16iHep livers revealed progression from premalignant, hyperproliferative nodules to HCC, as initiated by sporadic hepatocyte-specific expression of SRF-VP16.
Figure 3.
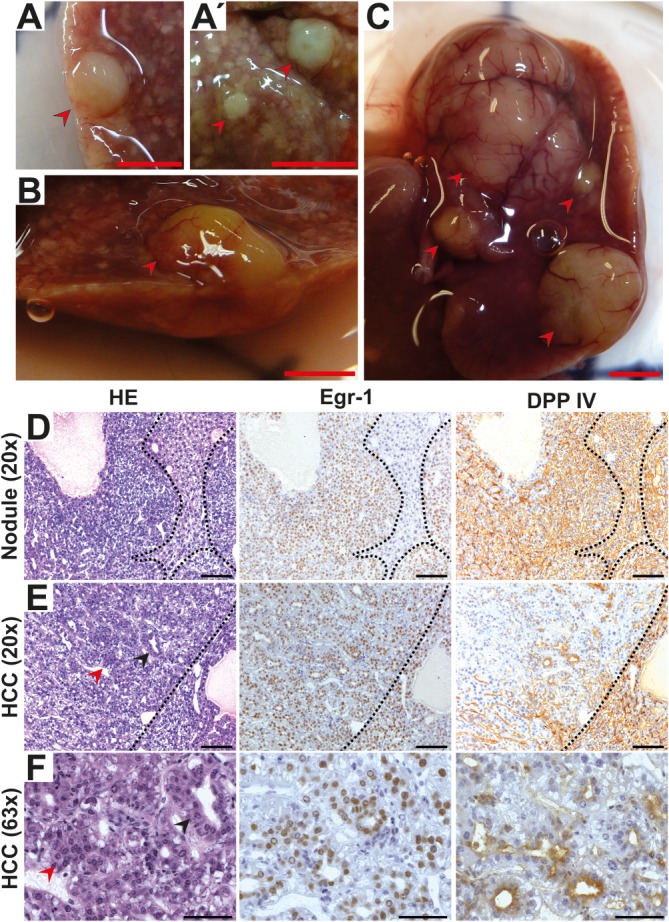
Malignant transformation to HCC. HCCs of small (0.2-0.5 cm) (A,A′), intermediate (B), or large (>2.5 cm) (C) size. Scale bar = 1 cm. Histology of livers containing premalignant nodules (D) or mHCC tissue (E,F). Scale bars = (D,E) 100 μm, (F) 50 μm. Hyperproliferative nodules are composed of small, basophilic hepatocytes showing a microtrabecular growth (D, left), express the SRF target gene Egr1 (D, middle), and the polarization marker DPP IV (D, right). HCC tissue characterized by nuclear and architectural atypia in the form of pseudoglandular (black arrowhead) and irregular solid-trabecular growth patterns (red arrowhead) (E, left; F, left). Nuclear Egr1 expression is high throughout the tumor (E, middle; F, middle), residual DPP IV expression is restricted to luminal membranes of pseudoglands (E, right; F, right).
Senescent Hepatocytes and Infiltrating Lymphocytes in SRF-VP16iHep Livers
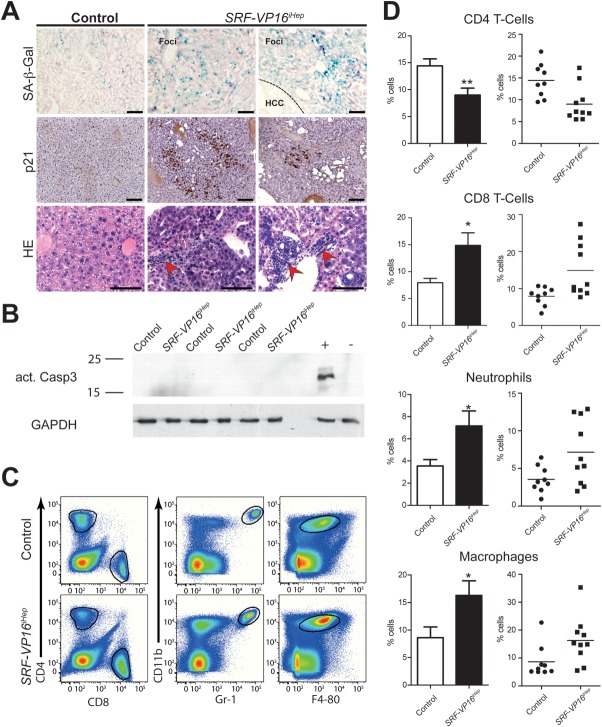
We estimated up to 100,000 hyperproliferative nodules per liver (Figs. 1C, 2A), a high number contrasted with the lower number (less than 5) of HCCs within one liver (Fig. 3A-C). Thus, progression from premalignant nodules to HCC was rare, possibly impaired by cellular tumor-suppressive mechanisms. SRF-VP16iHep livers displayed elevated numbers of β-galactosidase/p21-positive senescent cells (Fig. 4A, upper and middle),26 unaccompanied by activated caspase 3-mediated apoptotic activity (Fig. 4B). Further, tumor tissue displayed nests of infiltrating immune cells (Fig. 4A), with elevated levels of neutrophils (CD11bhighGr-1+), macrophages (CD11b+F4/80+), and CD8+ T cells, but not CD4+ T cells (Fig. 4C,D).
Figure 4.
Premalignant nodules harbor senescent hepatocytes and infiltrating lymphocytes. (A) Senescent hepatocytes in premalignant nodules of SRF-VP16iHep mice express SA-β-galactosidase (upper) and p21 (middle), and display foci of infiltrating immune cells (red arrowheads, lower). No β-bal signal is seen in HCC (upper, right). Scale bar = 100 μm. (B) Western blotting of activated Caspase 3, including positive (+) and negative (–) protein controls. (C,D) Immunophenotyping (flow cytometry) identifies neutrophil (CD11bhighGr-1+) infiltration into nodular livers, macrophages (CD11b+F4/80+), and CD8+ T cells, while CD4+ T cells are decreased. *P < 0.05 and **P < 0.01. Values represent mean ± SEM.
SRF-VP16-Triggered HCC Progression May Associate With β-Catenin Mutations
In hHCC, activating mutations of the CTNNB1 are frequently observed.3 We sequenced the Ctnnb1 gene of 26 separately dissected SRF-VP16iHep mHCCs. Twelve samples (46%) carried Ctnnb1 missense mutations affecting codons 32, 34, 37, or 41 (Supporting Table S1), representing frequently mutated codons of CTNNB1 in human cancers.23 Ha-Ras (codon 61) and B-Raf (codon 600) mutations, were not found (not shown).
Expression of Candidate SRF Target Genes
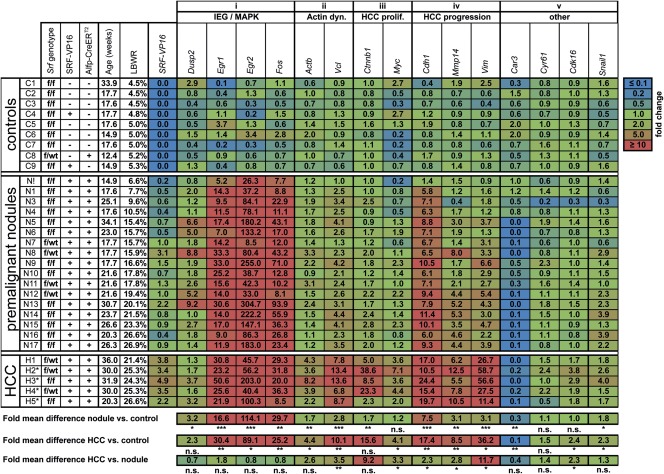
Quantitative real time PCR (qRT-PCR) of candidate gene transcripts from nine control, 17 SRF-VP16iHep nodular (LBWR, ranging from 6.6 to 26.9%), and five SRF-VP16iHep mHCC tissues (Fig. 5) revealed dramatic up-regulation of the proliferation-associated, Ras/MAPK-stimulated immediate-early genes (IEGs) Egr1, Egr2, and c-fos in both nodular and HCC tissue (column (i)). The β-actin and Vinculin genes, normally regulated by Rho/actin signaling, were also up-regulated in nodular and mHCC tissues (column (ii)). Tumor proliferation genes (Ctnnb1, c-Myc) were prominently up-regulated in mHCCs (column (iii)). Carcinoma progression genes (Cdh1, Mmp14, and Vim) showed significant up-regulation in nodules and mHCC (column (iv)). Collectively, in SRF-VP16iHep mice, liver tissues display up-regulation of direct SRF target genes normally stimulated by either MAPK or Rho/actin signaling.
Figure 5.
SRF-VP16iHep liver tissues display altered gene expression profiles. Expression of candidate genes in liver tissue of control mice (C1-C9), and premalignant nodular tissue (F1-F17) and mHCCs (H1-H5) of SRF-VP16iHep mice. Genotype abbreviations: f, Srf-flex1; wt, wild-type; SRF-VP16 +, positive; SRF-VP16 –, negative; Alfp-CreERT2 +, positive; Alfp-CreERT2 –, negative). Functional grouping of candidate genes and relative expression levels (q-RT-PCR) (numerical and by heat-map coloring) is indicated. Tissue samples are arranged by increasing LBWR (%), tumors by size (H1 and H2: 1.0 cm, H3: 2.0 cm, H3-H5: 2.5 cm).
Genome-Wide Gene Expression Profiling of Murine Tumor Tissues
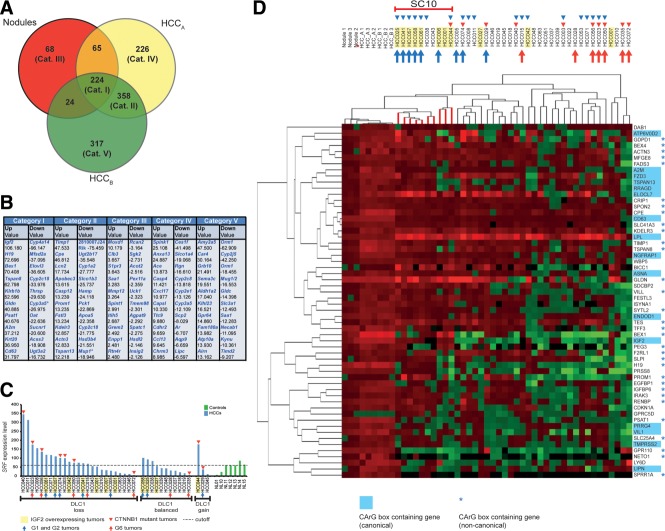
In genome-wide RNA expression profiling we compared control livers (n = 3) with premalignant nodular liver tissue (n = 3) and HCC tissues carrying either wild-type Ctnnb1 (mHCCA tumors) (n = 3) or mutated Ctnnb1 (mHCCB tumors) (n = 3). Altogether, about 1,330 transcripts were found differentially expressed in nodular and HCC tissues (Table S2). RT-PCR validation was obtained for all genes investigated (including those studied in Fig. 5, plus eight others). Many genes carrying identified CArG-boxes were up-regulated (e.g., Bcl-2, Ctgf, Egr1, Egr2, Flna, c-fos, Myh9, Tagln2, Tgfb2, Thbs1, Tpm1, Tuft1, Vcl1, Vim, Vil1, and Zyx).27 The Venn diagram (Fig. 6a) revealed 224 dysregulated transcripts shared by all three types of liver tissue (Category I, Table S3) and a distinct set of 358 transcripts dysregulated in HCCs but not nodules (Category II, Table S4). In all, 68 (Category III, Table S5), 226 (Category IV, Table S6) and 317 transcripts (Category V, Table S7) were dysregulated exclusively in nodular tissue, mHCCA, and mHCCB, respectively. For each category, the 10 most strongly up- and down-regulated genes are displayed (Fig. 6B). The 25 most strongly up-regulated transcripts of Categories I and II represented oncofetal genes (Igf2, H19, Bex1), and genes involved in proliferation/survival (Cpe, Gldn, Fstl3, Psat1, Igf2, Cd63, Lcn2, Plat1, Tspan8, Tspan13, Timp1), cytoskeletal activities (Actn3, Krt20, Vim, Vil1), immune-regulation (Ly6d, Klrb1a) and lipid metabolism (Scd2, Ly6d, Akr1c18, Lpl2). The Ctnnb1-mutated HCCB tumors (Category V) selectively showed up-regulation of proto-oncogenes c-fos, and c-Jun, as well as Wnt signaling components (Fzd3, Lef1, Tcf7, Axin2). Down-regulated transcripts of Categories I and II included the tumor suppressor genes Sdha, Ndrg2 and Igfals.22,28
Figure 6.
SRF-VP16-triggered mHCCs share expression profiles with G1/G2 subgroups of hHCCs. (A) Venn diagram depicting differentially expressed transcripts in all three types of tissue (Category I), mHCCs (Category II), nodular tissue (Category III), mHCCs without Ctnnb1 mutation (HCCA; Category IV), and mHCCs with Ctnnb1 mutation (HCCB; Category V). (B) Listing of 10 most strongly up- or down-regulated transcripts per category (x-fold differential expression). (C) Cohort of 40 hHCCs grouped according to genomic DLC1 status (X-axis) and SRF mRNA expression levels (Y-axis). IGF2 RNA overexpression status (yellow box), CTNNB1 mutation status (red triangle), Boyault class (G1 and G2, blue arrow; G6, red arrow). (D) Combined unsupervised hierarchical clustering of the 58 most strongly up-regulated transcripts in SRF-VP16-triggered nodular/mHCC tissue against 40-membered hHCC cohort (blue triangles: SRF overexpressing tumors, other symbols as in (C)). The "subcluster of 10" hHCCs (SC10) cluster close to the mHCCs. Murine genes contain a canonical (blue box) or noncanonical CArG-box (blue asterisks).
Shared Gene Expression Signatures of Murine and hHCCs
Cross-species comparison of our murine samples was performed with a cohort of 40 human HCCs,22 which was analyzed for genomic DLC1 deletions, SRF mRNA expression, and CTNNB1 mutation status (Fig. 6C). 60% hHCCs displayed genomic DLC1 loss and 50% displayed SRF mRNA overexpression (Fig. 6C). Tumors overexpressing SRF either displayed elevated IGF2 expression or clustered with CTNNB1 mutations (Fig. 6C,D, upper). Further, hHCC subclasses (G1 to G6) were assigned according to Boyault classification.2 Combined unsupervised hierarchical clustering of gene expression profiles from murine and hHCCs was performed, applying a gene set of the SRF-VP16-derived “58 most strongly up-regulated transcripts.” A strong murine/human expression overlap with a subgroup of 10 hHCCs, henceforth called “subcluster of 10” (SC10), was observed (Fig. 6D). SC10 hHCCs displayed a stronger relatedness to the murine specimen than to any of the other 30 hHCCs and were enriched for IGF2-overexpressing tumors. 70% of the G1 or G2 tumors belonged to SC10, while none of the G6 tumors did (Fig. 6D). In close agreement, upon applying the murine gene set of “50 most dysregulated (up or down) transcripts in the unsupervised hierarchical clustering,” a subcluster of eight human tumors (SC8) was identified (not shown). All tumors of SC8 are contained in SC10. Individual genes specifying the mHCC/hHCC overlap included the imprinted or developmentally expressed genes Igf2, H19, Bex1, Peg3, and Cd133/Prom1. Additional development-regulated transcripts dysregulated in SRF-VP16 tissues included oncofetal genes Afp, Epcam, Gpc3, Igf2bp3, Plaur, Sox4, Sox9, Vil1, and Vim. In summary, comparative expression profiling identified high relatedness between SRF-VP16-derived mHCCs and hHCCs, particularly the G1/G2-enriched SC10 subset. The commonality included dysregulation of oncofetal gene expression.
Epigenetic Dysregulation of Igf2/H19 in Both Murine and Human HCCs
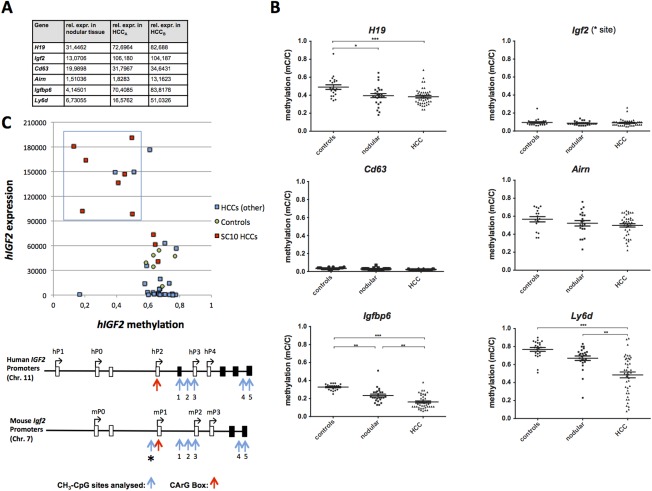
Overexpression of the normally imprinted Igf2/H19 genes in both SRF-VP16-derived mHCCs (Fig. 7A) and G1 subclass hHCC2 suggested common epigenetic alterations. CpG methylation of the Igf2/H19 imprinting control region (DMR), investigated in 40 independent SRF-VP16-triggered mHCCs, indeed revealed hypomethylation in both nodules and tumors (Fig. 7B), correlating with elevated H19 gene expression. Regarding the highly expressed Igf2 gene in murine HCCs, no differences to constitutive low control levels of CpG methylation were seen upstream of the mP1 promoter (site *, Fig. 7B) nor around the mP2 promoter (sites 1-3, Fig. S3), similar to the highly expressed Cd63 gene (Fig. 7B). Promoter-associated CpG sites of the imprinted Airn gene, encoding an antisense regulator of Igf2r, showed a trend towards demethylation, which might be hyperproliferation-associated, but this failed to reach statistical significance. Also, the Meg3 and Peg3 genes, usually subject to imprinting control, were strongly overexpressed in SRF-VP16-triggered mHCC (Table S3). Other highly expressed genes, Igfbp6 and Ly6d, displayed significant CpG hypomethylation (Fig. 7B). Collectively, this indicates SRF-VP16-triggered mHCC formation being linked to epigenetic alterations of both imprinted and nonimprinted genes.
Figure 7.
Genomic methylation profiles of selected sites in murine and human HCCs. (A) Selected transcript expression in SRF-VP16iHep mice. (B) Genomic CpG methylation ratios (mC/C) at the indicated gene loci of murine tissues. H19 locus investigated at imprinting control region (Igf2/H19 DMR), other genes investigated at promoter. (C) 40-membered hHCC cohort: averaged methylation ratio of CpG sites 1-3 of human IGF2 hP3 promoter blotted versus corresponding hIGF2 mRNA expression levels. Boxed: hHCC subgroup with reduced CpG methylation and concomitantly elevated IGF2 expression. Lower: 5′ regions of the human IGF2 gene (hP0 to hP4 promoters) and the murine Igf2 gene (mP0 to mP3 promoters).
Since elevated hIGF2 expression is frequent in human G1-type HCCs,2 we investigated the cohort of 40 human HCCs regarding hIGF2 expression and CpG methylation. We focused on three CpG dinucleotides around the hP3 promoter (sites 1-3; Fig. 7C, lower), previously implicated in tumor-associated hP3 promoter activation.29 25% of hHCC specimens, including the majority of G1/G2 tumors and the SC10 tumors, showed both high hIGF2 gene expression and promoter hP3 hypomethylation (Fig. 7C, upper). Thus, the SC10 subtype of hHCC display hIGF2 promoter hypomethylation congruent with SRF-VP16-triggered mHCC.
Discussion
SRF-VP16iHep mice provide the first in vivo evidence for dysregulated, constitutive activity of the transcription factor SRF to trigger cancer. Constitutive SRF-VP16 activity elicited gene expression profiles, which mirrored, in part, SRF activity stimulated by combined Ras/MAPK and Rho/actin signaling (Fig. 1A),13,14 pathways frequently activated in cancer cells.6,12 A comparable scenario was revealed for oncogenic human Ets proteins in mimicking Ras/MAPK signaling.30
In SRF-VP16iHep mice, within 10 weeks, spontaneous hepatocellular activation of CreERT2 generated an SRF-VP16-overexpressing cell population constituting ∼0.4% of all hepatocytes. The single molecular event of induced SRF-VP16 expression elicited high proliferative activity, leading to rapid hepatocyte expansion and formation of premalignant dysplastic lesions (nodules). Subsequently, from these numerous nodules progression to a small number of malignant HCC occurred. The SRF-VP16iHep mouse model therefore permits the study of molecular events associated with both initiation and progression of cancer. Close to 50% of murine SRF-VP16-triggered tumors displayed activating point mutations in the Ctnnb1 gene, mapping to codons equivalent to those mutated in hHCCs.
The profile of dysregulated genes in SRF-VP16iHep mHCCs encompasses a subgroup of 182 entries shared with the 960-membered set of direct SRF target genes mediating the serum response of transformed fibroblasts27 (Table S8). This strong overlap attests to SRF-VP16 indeed impacting efficiently CArG-box containing genes in hepatocytes of SRF-VP16iHep mice. Elevated expression of the IEGs Egr1, Egr2, and c-fos, well-known proliferation-associated SRF target genes,31 was seen at the onset of nodule formation (at 6.6% LWBR) (Fig. 5). Nodular activation of Igf2 likely also contributed to SRF-VP16-mediated hepatocellular expansion, and overexpression of IGF2 has long been known to contribute to HCC formation.2,32
Expression profiles of SRF-VP16-triggered mHCCs revealed striking overlap with Boyault classified G1 and G2 subclasses of hHCC.2 This molecular resemblance rested on overlap regarding the subset of 58 most strongly overexpressed genes in mHCCs, which included oncofetal genes. Oncofetal/developmental genes were also strongly overexpressed in the HB hepatoblast-like subtype of hHCC,33 sharing characteristics with G1 hHCCs. The expression overlap between SRF-VP16-triggered mHCCs and hHCCs suggests that, in human cancer patients, hyperactivated SRF contributes to HCC formation of G1/G2 (and HB) subtypes. Consistently, the cohort of 40 hHCCs analyzed here shows enrichment of G1/G2 tumors among the hHCC subset displaying elevated SRF expression (Fig. 6C,D).
Molecular congruence between SRF-VP16-elicited mHCCs and G1/G2 hHCCs was also found regarding loss of imprinting and dysregulation of promoter CpG methylation. Based on the analysis of 40 SRF-VP16-triggered mHCCs, loss of CpG methylation at the DMR of the imprinted Igf2/H19 locus was observed (Fig. 7B), as similarly reported for G1 subtype hHCCs.2 Furthermore, the hHCC cohort studied here revealed CpG hypomethylation at the human IGF2 hP3 promoter in the majority of SC10/(G1/G2) hHCCs. This correlated with elevated hIGF2 expression (Fig. 7C) and reflected the constitutively low CpG methylation at mIgf2 promoters in murine tissues (Fig. S3). Yet the precise mechanism leading to the massive deregulation of the Igf2/H19 locus in the SRF-VP16-triggered mHCCs remains to be elucidated.
Within an individual SRF-VP16iHep liver, only few isolated mHCC lesions develop from thousands of premalignant nodules (Fig. 1), indicating tumor suppressor mechanisms preventing malignant transformation to occur more frequently. The presence of senescent hepatocytes within and surrounding the premalignant nodules, plus the presence of infiltrating leukocytes (Fig. 4), suggested tumor suppression by senescence-associated immune surveillance26,34 to govern the mouse model.
In conclusion, the SRF-VP16iHep mouse model, which is shown to display, in part, gene expression profiles elicited upon combined oncogenic Ras/MAPK and Rho/actin signaling, identifies SRF target genes to fulfill oncogenic driver functions in HCC. SRF activation by virally expressed HBV and HCV proteins17 adds a clinically relevant component to SRF's suggested role in liver carcinogenesis. The molecular relationship between SRF-VP16-triggered mHCCs and G1/G2 hHCCs strengthens our suggestion of SRF playing a crucial role in liver carcinogenesis. Simultaneous molecular targeting of both Ras/MAPK and Rho/actin signaling pathways, including direct inhibition of SRF, is suggested as a therapeutic strategy for treatment of human HCC.
Author names in bold designate shared co-first authorship.
Acknowledgments
We thank T.W. Kang, M. Günter, J. Mahr, M. Seehawer, D. Strobel, Oliver Mücke, and E. Zabinsky for experimental support. H. Land, N. Malek, L. Zender and H.-G. Rammensee provided valuable discussion.
Abbreviations
- HCC
hepatocellular carcinoma
- LBWR
liver weight-to-body weight ratio
- MAPK
mitogen-activated protein kinase
- MRTF
myocardin related transcription factor
- SRF
serum response factor
Footnotes
Author names in bold designate shared co-first authorship.
Supporting Information
Additional Supporting Information may be found at onlinelibrary.wiley.com/doi/10.1002/hep.27539/suppinfo.
Supplementary Information
References
- Jemal A, Bray F, Center MM, Ferlay J, Ward E, Forman D. Global cancer statistics. CA Cancer J Clin. 2011;61:69–90. doi: 10.3322/caac.20107. [DOI] [PubMed] [Google Scholar]
- Boyault S, Rickman DS, de Reynies A, Balabaud C, Rebouissou S, Jeannot E, et al. Transcriptome classification of HCC is related to gene alterations and to new therapeutic targets. Hepatology. 2007;45:42–52. doi: 10.1002/hep.21467. [DOI] [PubMed] [Google Scholar]
- Guichard C, Amaddeo G, Imbeaud S, Ladeiro Y, Pelletier L, Maad IB, et al. Integrated analysis of somatic mutations and focal copy-number changes identifies key genes and pathways in hepatocellular carcinoma. Nat Genet. 2012;44:694–698. doi: 10.1038/ng.2256. [DOI] [PMC free article] [PubMed] [Google Scholar]
- Hoshida Y, Nijman SM, Kobayashi M, Chan JA, Brunet JP, Chiang DY, et al. Integrative transcriptome analysis reveals common molecular subclasses of human hepatocellular carcinoma. Cancer Res. 2009;69:7385–7392. doi: 10.1158/0008-5472.CAN-09-1089. [DOI] [PMC free article] [PubMed] [Google Scholar]
- Calvisi DF, Ladu S, Gorden A, Farina M, Conner EA, Lee JS, et al. Ubiquitous activation of Ras and Jak/Stat pathways in human HCC. Gastroenterology. 2006;130:1117–1128. doi: 10.1053/j.gastro.2006.01.006. [DOI] [PubMed] [Google Scholar]
- Whittaker S, Marais R, Zhu AX. The role of signaling pathways in the development and treatment of hepatocellular carcinoma. Oncogene. 2010;29:4989–5005. doi: 10.1038/onc.2010.236. [DOI] [PubMed] [Google Scholar]
- Xue W, Krasnitz A, Lucito R, Sordella R, Vanaelst L, Cordon-Cardo C, et al. DLC1 is a chromosome 8p tumor suppressor whose loss promotes hepatocellular carcinoma. Genes Dev. 2008;22:1439–1444. doi: 10.1101/gad.1672608. [DOI] [PMC free article] [PubMed] [Google Scholar]
- Lahoz A, Hall A. DLC1: a significant GAP in the cancer genome. Genes Dev. 2008;22:1724–1730. doi: 10.1101/gad.1691408. [DOI] [PMC free article] [PubMed] [Google Scholar]
- Sahai E, Marshall CJ. RHO-GTPases and cancer. Nat Rev Cancer. 2002;2:133–142. doi: 10.1038/nrc725. [DOI] [PubMed] [Google Scholar]
- Durkin ME, Yuan BZ, Zhou X, Zimonjic DB, Lowy DR, Thorgeirsson SS, et al. DLC-1:a Rho GTPase-activating protein and tumour suppressor. J Cell Mol Med. 2007;11:1185–1207. doi: 10.1111/j.1582-4934.2007.00098.x. [DOI] [PMC free article] [PubMed] [Google Scholar]
- Sahai E, Olson MF, Marshall CJ. Cross-talk between Ras and Rho signalling pathways in transformation favours proliferation and increased motility. EMBO J. 2001;20:755–766. doi: 10.1093/emboj/20.4.755. [DOI] [PMC free article] [PubMed] [Google Scholar]
- Xia M, Land H. Tumor suppressor p53 restricts Ras stimulation of RhoA and cancer cell motility. Nat Struct Mol Biol. 2007;14:215–223. doi: 10.1038/nsmb1208. [DOI] [PubMed] [Google Scholar]
- Olson EN, Nordheim A. Linking actin dynamics and gene transcription to drive cellular motile functions. Nat Rev Mol Cell Biol. 2010;11:353–365. doi: 10.1038/nrm2890. [DOI] [PMC free article] [PubMed] [Google Scholar]
- Posern G, Treisman R. Actin' together: serum response factor, its cofactors and the link to signal transduction. Trends Cell Biol. 2006;16:588–596. doi: 10.1016/j.tcb.2006.09.008. [DOI] [PubMed] [Google Scholar]
- Bai S, Nasser MW, Wang B, Hsu SH, Datta J, Kutay H, et al. MicroRNA-122 inhibits tumorigenic properties of hepatocellular carcinoma cells and sensitizes these cells to sorafenib. J Biol Chem. 2009;284:32015–32027. doi: 10.1074/jbc.M109.016774. [DOI] [PMC free article] [PubMed] [Google Scholar]
- Park MY, Kim KR, Park HS, Park BH, Choi HN, Jang KY, et al. Expression of the serum response factor in hepatocellular carcinoma: implications for epithelial-mesenchymal transition. Int J Oncol. 2007;31:1309–1315. [PubMed] [Google Scholar]
- Kato N, Yoshida H, Ono-Nita SK, Kato J, Goto T, Otsuka M, et al. Activation of intracellular signaling by hepatitis B and C viruses: C-viral core is the most potent signal inducer. Hepatology. 2000;32:405–412. doi: 10.1053/jhep.2000.9198. [DOI] [PubMed] [Google Scholar]
- Muehlich S, Hampl V, Khalid S, Singer S, Frank N, Breuhahn K, et al. The transcriptional coactivators megakaryoblastic leukemia 1/2 mediate the effects of loss of the tumor suppressor deleted in liver cancer 1. Oncogene. 2012;31:3913–3923. doi: 10.1038/onc.2011.560. [DOI] [PubMed] [Google Scholar]
- Hampl V, Martin C, Aigner A, Hoebel S, Singer S, Frank N, et al. Depletion of the transcriptional coactivators megakaryoblastic leukaemia 1 and 2 abolishes hepatocellular carcinoma xenograft growth by inducing oncogene-induced senescence. EMBO Mol Med. 2013;5:1367–1382. doi: 10.1002/emmm.201202406. [DOI] [PMC free article] [PubMed] [Google Scholar]
- Sandstrom J, Heiduschka P, Beck SC, Philippar U, Seeliger MW, Schraermeyer U, et al. Degeneration of the mouse retina upon dysregulated activity of serum response factor. Mol Vis. 2011;17:1110–1127. [PMC free article] [PubMed] [Google Scholar]
- Schratt G, Weinhold B, Lundberg AS, Schuck S, Berger J, Schwarz H, et al. Serum response factor is required for immediate-early gene activation yet is dispensable for proliferation of embryonic stem cells. Mol Cell Biol. 2001;21:2933–2943. doi: 10.1128/MCB.21.8.2933-2943.2001. [DOI] [PMC free article] [PubMed] [Google Scholar]
- Neumann O, Kesselmeier M, Geffers R, Pellegrino R, Radlwimmer B, Hoffmann K, et al. Methylome analysis and integrative profiling of human HCCs identify novel protumorigenic factors. Hepatology. 2012;56:1817–1827. doi: 10.1002/hep.25870. [DOI] [PubMed] [Google Scholar]
- Bamford S, Dawson E, Forbes S, Clements J, Pettett R, Dogan A, et al. The COSMIC (Catalogue of Somatic Mutations in Cancer) database and website. Br J Cancer. 2004;91:355–358. doi: 10.1038/sj.bjc.6601894. [DOI] [PMC free article] [PubMed] [Google Scholar]
- Wiebel FF, Rennekampff V, Vintersten K, Nordheim A. Generation of mice carrying conditional knockout alleles for the transcription factor SRF. Genesis. 2002;32:124–126. doi: 10.1002/gene.10049. [DOI] [PubMed] [Google Scholar]
- Stecca BA, Nardo B, Chieco P, Mazziotti A, Bolondi L, Cavallari A. Aberrant dipeptidyl peptidase IV (DPP IV/CD26) expression in human hepatocellular carcinoma. J Hepatol. 1997;27:337–345. doi: 10.1016/s0168-8278(97)80180-8. [DOI] [PubMed] [Google Scholar]
- Kang TW, Yevsa T, Woller N, Hoenicke L, Wuestefeld T, Dauch D, et al. Senescence surveillance of pre-malignant hepatocytes limits liver cancer development. Nature. 2011;479:547–551. doi: 10.1038/nature10599. [DOI] [PubMed] [Google Scholar]
- Esnault C, Stewart A, Gualdrini F, East P, Horswell S, Matthews N, et al. Rho-actin signaling to the MRTF coactivators dominates the immediate transcriptional response to serum in fibroblasts. Genes Dev. 2014;28:943–958. doi: 10.1101/gad.239327.114. [DOI] [PMC free article] [PubMed] [Google Scholar]
- Marquardt JU, Seo D, Andersen JB, Gillen MC, Kim MS, Conner EA, et al. Sequential transcriptome analysis of human liver cancer indicates late stage acquisition of malignant traits. J Hepatol. 2014;60:346–353. doi: 10.1016/j.jhep.2013.10.014. [DOI] [PMC free article] [PubMed] [Google Scholar]
- Silviera ML, Smith BP, Powell J, Sapienza C. Epigenetic differences in normal colon mucosa of cancer patients suggest altered dietary metabolic pathways. Cancer Prev Res (Phila) 2012;5:374–384. doi: 10.1158/1940-6207.CAPR-11-0336. [DOI] [PMC free article] [PubMed] [Google Scholar]
- Hollenhorst PC, Ferris MW, Hull MA, Chae H, Kim S, Graves BJ. Oncogenic ETS proteins mimic activated RAS/MAPK signaling in prostate cells. Genes Dev. 2011;25:2147–2157. doi: 10.1101/gad.17546311. [DOI] [PMC free article] [PubMed] [Google Scholar]
- Pritchard MT, Malinak RN, Nagy LE. Early growth response (EGR)−1 is required for timely cell-cycle entry and progression in hepatocytes after acute carbon tetrachloride exposure in mice. Am J Physiol Gastrointest Liver Physiol. 2011;300:G1124–1131. doi: 10.1152/ajpgi.00544.2010. [DOI] [PMC free article] [PubMed] [Google Scholar]
- Schirmacher P, Held WA, Yang D, Chisari FV, Rustum Y, Rogler CE. Reactivation of insulin-like growth factor II during hepatocarcinogenesis in transgenic mice suggests a role in malignant growth. Cancer Res. 1992;52:2549–2556. [PubMed] [Google Scholar]
- Lee JS, Heo J, Libbrecht L, Chu IS, Kaposi-Novak P, Calvisi DF, et al. A novel prognostic subtype of human hepatocellular carcinoma derived from hepatic progenitor cells. Nat Med. 2006;12:410–416. doi: 10.1038/nm1377. [DOI] [PubMed] [Google Scholar]
- Guo X, Keyes WM, Papazoglu C, Zuber J, Li W, Lowe SW, et al. TAp63 induces senescence and suppresses tumorigenesis in vivo. Nat Cell Biol. 2009;11:1451–1457. doi: 10.1038/ncb1988. [DOI] [PMC free article] [PubMed] [Google Scholar]
Associated Data
This section collects any data citations, data availability statements, or supplementary materials included in this article.
Supplementary Materials
Supplementary Information


