

Abstract
Objective
Autoimmune-mediated anti–α-amino-3-hydroxy-5-methyl-4-isoxazolepropionic acid receptor (AMPAR) encephalitis is a severe but treatment-responsive disorder with prominent short-term memory loss and seizures. The mechanisms by which patient antibodies affect synapses and neurons leading to symptoms are poorly understood.
Methods
The effects of patient antibodies on cultures of live rat hippocampal neurons were determined with immunostaining, Western blot, and electrophysiological analyses.
Results
We show that patient antibodies cause a selective decrease in the total surface amount and synaptic localization of GluA1- and GluA2-containing AMPARs, regardless of receptor subunit binding specificity, through increased internalization and degradation of surface AMPAR clusters. In contrast, patient antibodies do not alter the density of excitatory synapses, N-methyl-D-aspartate receptor (NMDAR) clusters, or cell viability. Commercially available AMPAR antibodies directed against extracellular epitopes do not result in a loss of surface and synaptic receptor clusters, suggesting specific effects of patient antibodies. Whole-cell patch clamp recordings of spontaneous miniature postsynaptic currents show that patient antibodies decrease AMPAR-mediated currents, but not NMDAR-mediated currents. Interestingly, several functional properties of neurons are also altered: inhibitory synaptic currents and vesicular γ-aminobutyric acid transporter (vGAT) staining intensity decrease, whereas the intrinsic excitability of neurons and short-interval firing increase.
Interpretation
These results establish that antibodies from patients with anti-AMPAR encephalitis selectively eliminate surface and synaptic AMPARs, resulting in a homeostatic decrease in inhibitory synaptic transmission and increased intrinsic excitability, which may contribute to the memory deficits and epilepsy that are prominent in patients with this disorder.
There are several recently identified paraneoplastic autoimmune encephalitides in which patients develop autoantibodies against cell surface and synaptic proteins,1,2 including N-methyl-D-aspartate receptors (NMDARs)3,4 and anti–α-amino-3-hydroxy-5-methyl-4-isoxazolepropionic acid receptors (AMPARs).5 Patients with anti-AMPAR encephalitis have anti-GluA1 and/or anti-GluA2 antibodies in serum as well as cerebrospinal fluid (CSF). These patients mainly present with limbic dysfunction including confusion, agitation, seizures, and severe short-term memory deficits, which recover with interventions to reduce antibody titer. Despite effective treatments, there is a high rate of relapse,5 and the cellular and synaptic mechanisms that underlie these syndromes are largely unknown.
AMPARs are heterotetramers composed of a combination of subunits, GluA1–4, that are expressed in a region-specific manner6–10 and mediate most of the fast excitatory synaptic transmission in the brain.11 Although AMPARs are widely expressed throughout the central nervous system, GluA1/2 and GluA2/3 levels are exceptionally high in the hippocampus and other limbic regions,12 similar to the distribution of immunoreactivity with patient antibodies.5 AMPARs are essential for basal excitatory transmission as well as expression of long-term potentiation,13–15 a process linked to memory formation. Our previous studies showed that patient antibodies resulted in a decrease in the synaptic localization of AMPAR clusters.5 However, how patient antibodies alter synaptic and neuronal function underlying patients' symptoms is poorly understood. Moreover, genetic manipulations eliminating individual AMPAR subunit expression and thus function result in only limited deficits in memory tasks,13,14,16 inconsistent with the complete loss of short-term memory seen in patients. Recent work suggests that the total surface expression of AMPAR proteins, regardless of subunit type, is important for long-term potentiation (LTP) expression.15 Whether patient antibodies cause decrease of surface AMPAR protein is not known.
Here we report that patient anti-AMPAR antibodies decrease surface protein level and synaptic localization of AMPARs, regardless of receptor subunit binding specificity, without dismantling excitatory synapses. Interestingly, the loss of AMPAR-mediated synaptic transmission results in a compensatory decrease of inhibitory synaptic transmission and an increase in intrinsic excitability. Together, these changes may contribute to the loss of memory and seizures that are hallmarks of this disorder in patients.
Materials and Methods
Cell Culture and Patient Antibody Treatment
Primary rat hippocampal neuron and astrocyte cocultures were prepared from embryonic day 18 to 19 as previously described.17,18 Patient or control CSF was collected and filtered using Millex filters (Millipore, Billerica, MA). High-titer CSF was diluted 1:20–100 to treat neurons in vitro for 24 hours or as stated. Immunoglobulin G (IgG) from the serum of 1 patient (02066) was collected and filtered using protein A/G Sepharose columns as described.18 Treatment with patient IgG (∼20μg/ml) or serum (1:200 dilution) decreased synaptic AMPAR clusters to a similar extent as treatment with CSF (see Results), without side effects to culture health. Patient CSF was used to treat neurons unless otherwise stated. In surface biotinylation experiments, control or patient sera were used to treat neurons (1:200 dilution). Each CSF was tested for antibody reactivity by staining mouse or rat brain sections and human embryonic kidney (HEK) cells expressing GluA1/GluA2 heteromers of the AMPAR as previously described.5
Patient Samples
Control patients were from a previously described tissue bank: 07-238, 09-724, 09-726.5 All patients had idiopathic noninflammatory neuropsychiatric symptoms, without autoantibodies in serum and CSF.
Anti-AMPAR Encephalitis Patients: 04-067, 02-066, 09-276
Case 04-067 is Patient #1 and Case 02-066 is Patient #2 described in previously published work.5 Case 04-067 is GluA1 positive, GluA2 and GluA3 negative; Case 02-066 is GluA2 positive, GluA1 and GluA3 negative. Case 09-276 (not previously reported) is GluA1 positive, GluA2 and GluA3 negative. This patient is a 46-year-old woman who 4 years previously developed a clinical picture of typical paraneoplastic limbic encephalitis associated with breast cancer. She was treated with tumor resection, immunotherapy, and chemotherapy and had a remarkable response to treatment. She is back to work, although she has mild residual memory problems. Table1 shows the usage of patient samples in experiments.
Table 1.
Patient Samples Used in Each Experiment and Specific Antibodies in Each Sample
| Figure | Experiment Treatment | Patient CSF ID (specific antibodies) |
|---|---|---|
| 1A | Hippocampal neuron immunostaining with patient antibodies in CSF | 04067 (GluA1), 02066 (GluA2) |
| 1B–E | Treatment with patient CSF and immunostaining of synaptic AMPAR clusters | 09276 (GluA1), 04067 (GluA1), 02066 (GluA2) |
| 1F, G; 2B, E | Treatment with patient serum and Western analysis | 04067 serum (GluA1), 02066 serum (GluA2) |
| 2A, C, D | Treatment with patient CSF and immunostaining of other synaptic markers | 04067 (GluA1), 02066 (GluA2) |
| 2F, G | Treatment with patient CSF and cell death analysis | 02066 (GluA2) |
| 3 | Treatment with patient CSF and internalization assay | 02066 (GluA2) |
| 5 | Treatment with patient CSF and recording of AMPAR- and NMDAR-mediated mEPSCs | 04067 (GluA1), 02066 (GluA2) |
| 6 | Treatment with patient CSF and GABAAR-mediated mIPSC analysis | 02066 (GluA2) |
| 7A–D | Treatment with patient CSF and cell excitability | 02066 (GluA2) |
| 7E–G | Treatment with patient CSF and cell spontaneous firing | 04067 (GluA1) |
AMPAR = anti–α-amino-3-hydroxy-5-methyl-4-isoxazolepropionic acid receptor; CSF = cerebrospinal fluid; GABAAR = γ-aminobutyric acid (GABA)A receptor; mEPSC = miniature excitatory postsynaptic current; mIPSC = miniature inhibitory postsynaptic current; NMDAR = N-methyl-D-aspartate receptor.
Biotinylation of Surface Proteins and Analysis by Western Blot
Neurons were treated with patient serum with anti-GluA1 or anti-GluA2 antibodies for 1 day. Procedures for total protein, intracellular fraction, and surface fraction collection were performed as described previously.18 Briefly, neuron cultures were washed with phosphate-buffered saline (PBS)-based rinsing buffer and incubated for 30 minutes at 4°C with 1mg/ml Sulfo-NHS-Biotin (Thermo Fisher Scientific, Waltham, MA) in rinsing buffer. Neurons were then lysed in radioimmunoprecipitation assay buffer (150mM NaCl, 1mM ethylenediaminetetraacetic acid, 100mM Tris-HCl, 1% Triton X-100,1% sodium deoxycholate, 0.1% sodium dodecyl sulfate [SDS], pH 7.4), supplemented with 1:500 protease inhibitor mixture III (Calbiochem, San Diego, CA) at 4°C for 1 hour. Lysates were cleared of debris by centrifugation at 12,400 × g for 20 minutes. An aliquot of the supernatant was taken for the total protein, and a second aliquot was incubated with avidin-linked agarose beads (Immobilized Monomeric Avidin, Thermo Fisher Scientific) overnight at 4°C to absorb surface fraction. After centrifugation, the supernatant was removed for the intracellular fraction. The beads were subsequently washed and eluted for surface protein. Protein samples were separated on 4 to 15% SDS–polyacrylamide gel electrophoresis gel and transferred to nitrocellulose membranes. Surface fractions were probed with antibodies against GluN1 (rabbit, 1:1,000; Chemicon, Temecula, CA; AB1516; replaced by Millipore AB9864, similar results obtained with both), GluA1 (rabbit, 1:200, Millipore AB1504), GluA2/3 (rabbit, 1:200, Chemicon AB1506), stargazin (rabbit, 1:500, Millipore AB9876), γ-aminobutyric acid (GABA)B1 receptors (GABAB1Rs; guinea pig, 1:200, Millipore AB2256), GABAA receptor (GABAAR) β2/3 (mouse 1:200, Millipore, 05-474), vesicular GABA transporter (vGAT; guinea pig, 1:1,000, synaptic systems 131-004), and β-actin (chicken, 1:1,000; Abcam, Cambridge, MA; ab13822). Intracellular fractions were used to probe for intracellular GluA1, GluA2/3, actin, and vGAT. Total lysate protein fractions were used to probe for total GluA1. Microtubule associated protein 2 (MAP2), actin, and GABAARs were used as loading controls for intracellular, total, and surface fractions, respectively. Blots were incubated with alkaline phosphatase–conjugated goat antimouse or goat antirabbit secondary antibodies (1:3,000; Cell Signaling Technology, Danvers, MA), and signals were visualized using the Western-Star chemiluminescent detection system (Applied Biosystems, Carlsbad, CA). All quantified images were in the linear exposure range and were digitally scanned in the ChemiDoc XRS+ system (Bio-Rad Laboratories, Hercules, CA), and signals were quantified using Image Lab software (Bio-Rad Laboratories).
Whole-Cell Electrophysiological Recordings
Whole-cell voltage clamp recordings were performed from 17 to 21 days in vitro hippocampal pyramidal neurons at room temperature (22–25°C), using a HEKA (Bellmore, NY) EPC 10 patch clamp amplifier and PATCHMASTER multichannel data acquisition software. Briefly, neurons were incubated in extracellular physiology solution (in millimoles): for miniature excitatory postsynaptic currents (mEPSCs) or miniature inhibitory postsynaptic currents (mIPSCs), recordings were performed in 119 NaCl, 5 KCl, 2 CaCl2, 2MgCl2, 30 glucose, 10 N-2-hydroxyethylpiperazine-N′-2-ethanesulfonic acid (HEPES), pH = 7.4; NMDAR-mediated mEPSC recordings were performed with 0 MgCl2 and 1 glycine; action potential recordings were performed in 140 NaCl, 3 KCl, 0.6 MgCl2, 2.5 CaCl2, 10 HEPES, 10 glucose. Voltage-clamp recordings were made using borosilicate glass microelectrodes (resistance = 4–6MΩ) filled with intracellular solution (in millimoles): mEPSCs recording was performed with 100 cesium gluconate, 0.2 ethyleneglycoltetraacetic acid (EGTA), 5 MgCl2, 2 adenosine triphosphate, 0.3 guanosine triphosphate, 40 HEPES, pH = 7.2; mIPSCs and action potential recording were performed with 140 KCl, 2 MgCl2, 11 EGTA, 10 HEPES, 7 glucose, pH = 7.3. mEPCSs and mIPCSs were recorded at −70mV in the presence of combinations of the following drugs to isolate desired currents: tetrodotoxin (TTX; 1μM), picrotoxin (PTX; 10μM), DL-2-amino-5-phosphonopentanoic acid (APV; 50μM), and 6-cyano-7-nitroquinoxaline-2,3-dione (CNQX; 10μM). Action potentials were recorded in current clamp mode. Pipette voltage offset was neutralized before the formation of a gigaohm seal. Membrane resistance, series resistance, and membrane capacitance were determined from current transients elicited by a 5mV depolarizing step from a holding potential of −80mV, using the whole-cell application of PATCHMASTER software. Criteria for cell inclusion in the data set included a series resistance ≤ 30MΩ and stability throughout the recording period. Currents were amplified, and sampled at 20kHz, then miniature current recording traces were digitally low-pass filtered at 2.5kHz, and events were detected and analyzed using MiniAnalysis (Synaptosoft, Leonia, NY).
Immunostaining for Surface AMPARs, Pre- and Postsynaptic Components
To stain surface AMPAR clusters, control or treated neurons were washed in NB plus B27 (Life Technologies, Grand Island, NY) and were incubated with commercial anti-GluA1 (rabbit,1:10; Calbiochem PC246; immunogen is a synthetic peptide [RTSDSRDHTRVDWKR] corresponding to amino acids 271–285 of rat GluA1) or anti-GluA2 (1:500; Millipore MAB397; immunogen is recombinant fusion protein with putative N-terminal portion of GluA2 from AA 175–430) antibodies directed against an extracellular epitope for 30 minutes, washed, incubated with appropriate fluorescently conjugated secondary antibodies for 30 minutes, and washed in PBS. Neurons were then fixed in 4% paraformaldehyde, 4% sucrose in PBS, pH = 7.4 for 15 minutes, permeabilized with cold 0.25% Triton X-100 for 5 minutes, and blocked in 5% normal goat serum (Invitrogen, Carlsbad, CA) for 1 hour at room temperature. Additional immunostaining was performed with various combinations of primary antibodies: anti-GluN1 (rabbit, 1:1000; Chemicon AB1516; replaced by Millipore AB9864, similar results obtained with both), anti-GluA1 against an intracellular epitope (rabbit, 1:200; Millipore AB1504), anti-GluA2/3 (rabbit, 1:100; Millipore AB1506), anti–PSD-95 (mouse, 1:500; Fisher Thermo Scientific MA1-045), antistargazin (rabbit, 1:500; Chemicon AB9876), anti-SV2 (mouse, 1:200; Developmental Studies Hybridoma Bank, Iowa City, IA), and anti-VGLUT1 (guinea pig, 1:5,000; Chemicon AB5905). Antibodies were visualized after staining with the appropriate fluorescently conjugated secondary antibodies (1:200; Jackson ImmunoResearch, West Grove, PA or Invitrogen).
To pulse label surface AMPAR and chase the subsequent internalization, neurons were incubated with commercial anti-GluA1 (rabbit, 1:100; Calbiochem) antibodies for 2 hours. This antibody does not induce significant reduction of surface AMPARs. After 2 hours, unbound antibodies were washed off, and neurons where treated with control or patient CSF for 24 hours. Remaining surface AMPARs were labeled live with conjugated secondary antibodies. In experiments measuring internalized AMPAR clusters, remaining surface AMPAR epitopes were preblocked by nonfluorescent antirabbit secondary antibodies (0.2mg/ml, Jackson ImmunoResearch).19 After fixation and permeabilization, internalized AMPARs were visualized by applying fluorescently conjugated secondary antibodies.
Confocal Imaging, Image Analysis, and Statistical Analysis
Randomly selected hippocampal pyramidal neurons, identified by morphology were confocally imaged18,20 (TCS 4D system, Leica Microsystems, Wetzlar, Germany). Images were thresholded automatically using an iterative thresholding technique,21 and the number and area of individual immunostained pre- or postsynaptic clusters were determined using interactive software (custom-written ImageJ macros). Clusters with pixel overlap of pre- and postsynaptic markers were considered colocalized and thus synaptic. Cluster density was compared among conditions using the Kruskal–Wallis nonparametric analysis of variance test followed by Dunn pairwise multiple comparison test, unless otherwise indicated. All values are presented as mean ± standard error of the mean.
Results
Patient Anti-GluA1 or Anti-GluA2 Antibodies Decrease Surface AMPAR Protein and Synaptic Localization
Previous work showed that anti-AMPAR encephalitis patients had antibodies against GluA1 and GluA2 antibodies in their CSF.5 Because some patients with autoimmune encephalitis had antibodies against multiple antigens,5,22 we selected patients with only GluA1 or GluA2 antibodies to eliminate effects from other antibodies. To further confirm the specificity of antibody binding, we incubated patient CSF with control HEK 293 cells or cells expressing GluA1/GluA2 AMPARs to deplete these specific antibodies. The control depleted patient CSF still stained neuronal surface AMPAR clusters as previously reported,5 whereas patient CSF depleted by incubation with GluA1/GluA2-expressing HEK cells showed little immunostaining (Fig 1A). This result confirms that patient antibodies in CSF samples are predominantly anti-GluA1/GluA2 antibodies.
Figure 1.
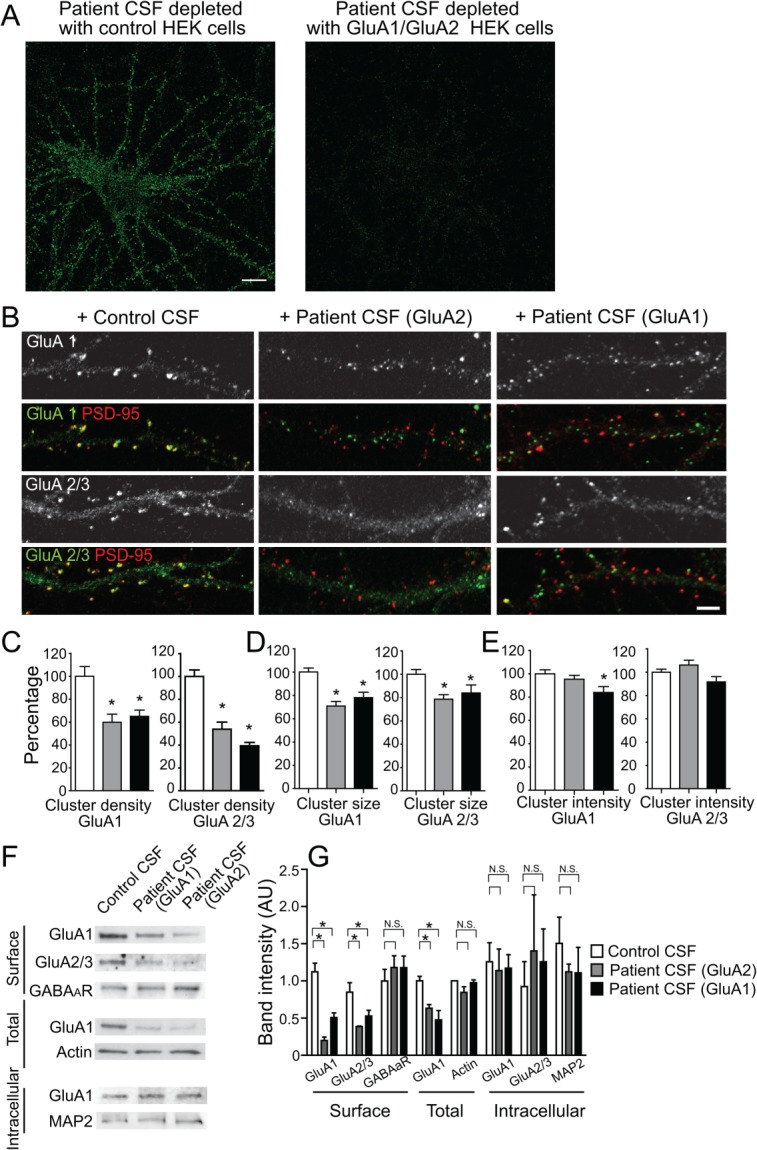
Patient anti-GluA1 or anti-GluA2 antibodies selectively decrease surface AMPAR clusters. (A) Hippocampal neurons immunostained with patient antibodies in cerebrospinal fluid (CSF). Patient CSF was preincubated with control human embryonic kidney (HEK) cells, or HEK cells expressing GluA1/GluA2 for 45 minutes, 6 times to deplete anti-GluA1/GluA2 antibodies. Control depleted patient CSF showed strong immunoreactivity with neuronal surface antigens; GluA1/GluA2 HEK cell-depleted patient CSF showed little immunoreactivity (1 anti-GluA1 patient [04067], 1 anti-GluA2 patient [02066]). Scale bar = 10μm. (B) Hippocampal neurons immunostained for GluA1- or GluA2-containing AMPAR clusters and postsynaptic PSD-95. Synaptic AMPAR clusters appear yellow due to colocalization of green GluA1 or GluA2/3 subunits and red PSD-95. Anti-GluA2 (middle panel) or anti-GluA1 (right panel) patient CSF treatment for 24 hours reduced synaptic GluA2 as well as GluA1 cluster density without affecting PSD-95 density (2 anti-GluA1 patients [04067, 09276], 1 anti-GluA2 patient [02066], 2 control patients [07238, 09724]; n = 18–24 neurons from 3 independent experiments). Scale bar = 5μm. (C) Quantification of synaptic GluA1 (left plot) or GluA2/3 (right plot) cluster density defined as the colocalization between GluA1 or GluA2/3 and PSD-95 clusters per 20μm dendrite length from neurons treated with control, anti-GluA1, or anti-GluA2 patient CSF. Asterisks indicate significant difference (compared with control, for synaptic GluA1 clusters, anti-GluA2 patient CSF treatment = 60 ± 7%, anti-GluA1 patient CSF treatment = 65 ± 5%, 1-way analysis of variance [ANOVA], p = 0.001; for synaptic GluA2 clusters, GluA2 patient CSF treatment = 54 ± 6%, GluA1 patient CSF treatment = 39 ± 3%, 1-way ANOVA, p < 0.0001). (D) Quantification of GluA1 (left plot) and GluA2/3 (right plot) cluster size (area of individual cluster measured in thresholded image) from neurons treated with control, anti-GluA1, or anti-GluA2 patient CSF. Asterisks indicate significant difference (compare to control, for GluA1 clusters, anti-GluA2 patient CSF treatment = 71 ± 4%, anti-GluA1 patient CSF treatment = 78 ± 5%, 1-way ANOVA, p < 0.0001; for synaptic GluA2 clusters, GluA2 patient CSF treatment = 79 ± 4%, GluA1 patient CSF treatment = 84 ± 7%, 1-way ANOVA, p = 0.01). (E) Quantification of GluA1 (left plot) and GluA2/3 (right plot) cluster intensity (average pixel intensity of individual cluster) from neurons treated with control, anti-GluA1, or anti-GluA2 patient CSF. Asterisk indicates significant difference (compared to control, GluA1 clusters, anti-GluA1 patient CSF treatment = 84 ± 5%, 1-way ANOVA, p = 0.03). (F) Western blot analyses of surface biotinylated (upper), total (middle), and intracellular (bottom) AMPAR protein. Patient antibody treatment for 1 day reduces surface and total AMPAR subunits, but not intracellular AMPARs. Surface γ-aminobutyric acidA receptor (GABAAR) and intracellular microtubule associated protein 2 (MAP2) were used as loading control; n = 3 independent experiments. (G) Quantification of band intensity of surface, total, and intracellular AMPAR protein after treatment with serum from anti-GluA1 or anti-GluA2 patients, showing a decrease in surface GluA1 and GluA2/3 protein in both patient antibody-treated neurons compared to control serum-treated neurons. Asterisks indicate significant difference (surface GluA1 band intensity, control = 1 ± 0.1, anti-GluA2 treated = 0.2 ± 0.05, anti-GluA1 treated = 0.1 ± 0.06, 1-way ANOVA, followed by Dunnett multiple comparison test, p < 0.0001; surface GluA2 band intensity, control = 0.9 ± 0.1, anti-GluA2 treated = 0.4 ± 0.01, anti-GluA1 treated = 0.5 ± 0.08, p < 0.05; total GluA1 band intensity, control = 1.0 ± 0.06, anti-GluA2 treated = 0.5 ± 0.1, anti-GluA1 treated = 0.6 ± 0.05, p < 0.05); N.S. indicates no significant difference in intracellular GluA1 or GluA2/3 protein (1-way ANOVA, followed by Dunnett multiple comparison test, p > 0.1).
Previous work showed that the antibodies from a single patient with anti-AMPAR encephalitis selectively decreased synaptic AMPAR clusters, and after antibody removal, AMPAR cluster density recovered back to control levels.5 Patients with anti-AMPAR encephalitis could be subdivided into 2 groups depending on the specificity of the antibodies present in the patient's CSF (GluA1 or GluA2). Previous studies knocking out the expression of GluA1 or GluA2 AMPAR subunits suggested that there could be compensatory expression of the other remaining subunits.13,14,16 We investigated whether patient anti-GluA1 or anti-GluA2 antibodies had similar effects on the localization of AMPAR subunits. Specifically, we assessed whether anti-GluA1 patient antibodies affected only GluA1-containing AMPARs or both GluA1- and GluA2-containing AMPARs. Hippocampal neurons were incubated for 1 to 3 days with patient CSF containing anti-GluA1 or anti-GluA2 antibodies, followed by immunochemical analyses of synaptic and surface GluA1 or GluA2/3 clusters.
Patient anti-GluA1 and anti-GluA2 antibodies significantly decreased both GluA1- and GluA2/3-containing synaptic AMPAR cluster density, for example, the number of AMPAR clusters per 20μm of dendrite (Fig 1B, C). Similar results were obtained using purified IgG prepared from the same patient's CSF sample (compared to control, AMPAR cluster density in purified patient IgG-treated neurons decreased to 11 ± 4%, p < 0.01), suggesting that the patient antibodies alone caused the decrease of synaptic AMPAR cluster density. In addition, patient antibodies also decreased the size and fluorescence intensity of AMPAR clusters (Fig 1D), suggesting that antibodies also cause declustering. Furthermore, surface biotinylation followed by Western blot analysis of GluA1 or GluA2 subunits showed a decrease of surface protein levels of both GluA1 and GluA2, treated by either anti-GluA1 or anti-GluA2 patient CSF (Fig 1F, G) compared to CSF from control patients. In addition, Western blots from treated and control neurons showed that the amount of intracellular AMPARs was not different and thus the total amount of AMPARs decreased (Fig 1F, G), consistent with degradation of internalized receptors. However, there was neither a significant compensatory increase in GluA2/3-containing receptors within synapses (Fig 1B–E), nor of surface or intracellular GluA2/3 protein levels (Fig 1F, G) when treated with anti-GluA1 patient antibodies or vice versa. These data suggest that patient antibodies directed against either subunit GluA1 or GluA2 have similar effects on GluA1- and GluA2-containing AMPARs, the main subunits comprising AMPARs in hippocampus.8,12
Patient Antibodies Do Not Alter Glutamatergic Synapse Density and Cell Viability
Because AMPARs interact with many other synaptic proteins and are major components of mature synapses,10,23 we examined whether patient anti-AMPAR antibodies also affected excitatory synapse density and/or the density of other postsynaptic components. Hippocampal neurons were cultured with CSF or serum containing anti-GluA1 or anti-GluA2 antibodies for 1 to 3 days, followed by immunostaining or Western blot analyses of synaptic proteins, including presynaptic vesicular glutamate transporter (vGlut), postsynaptic PSD-95, the AMPAR-interacting protein stargazin,24,25 the NMDAR obligate subunit GluN1, inhibitory GABAAR, and/or GABAB1Rs.
Patient antibodies did not alter the density of excitatory synapses, presynaptic vGlut clusters, postsynaptic PSD-95, GluN1, and stargazin clusters, compared to control CSF (Fig 2A, C, D), or the amount of surface GluN1, stargazin, or GABAB1R protein (Fig 2B, E). These data suggest that patient anti-AMPAR antibodies do not significantly alter the major components of synapses.
Figure 2.

Patient anti-GluA1 or anti-GluA2 antibodies do not alter other synaptic proteins. (A) Hippocampal neurons immunostained for the presynaptic marker vesicular glutamate transporter (vGlut) or the postsynaptic markers PSD-95, GluN1, or stargazin. Anti-GluA2 patient CSF treatment for 24 hours does not reduce vGlut, PSD-95, GluN1, and stargazin cluster density (1 anti-GluA1 patient [02066], 1 anti-GluA2 patient [04067], 2 control patients [07238, 09724], n = 12–36 neurons from 2–3 independent experiments). Scale bar = 10μm. (B) Western blot analyses of surface biotinylated stargazin, GABAB1R, and GluN1 protein (n = 3–6 experiments). (C) Quantification excitatory synapse density defined as the colocalization between postsynaptic PSD-95 and presynaptic vGlut density per 20μm dendrite length from neurons treated with control or patient CSF (control = 16 ± 1, patient = 13± 2, Mann–Whitney U test, p = 0.1). (D) Quantification of PSD-95 cluster density (control = 17 ± 1, patient = 15 ± 1, Mann–Whitney U test, p = 0.16), vGlut cluster density (control = 10 ± 1, patient = 9 ± 1, Mann–Whitney U test, p = 0.16), GluN1 cluster density (control = 17 ± 1, patient = 16 ± 1, Mann–Whitney U test, p = 0.57), and stargazin cluster density (control = 18 ± 1, patient = 20 ± 1.8, Mann–Whitney U test, p = 0.33) per 20μm dendrite length from neurons treated with control or patient CSF. (E) Quantification of surface GluN1, GABABR, and stargazin protein after treatment with serum from anti-GluA1 or anti-GluA2 patients, showing no significant changes in these surface proteins (1-way ANOVA, p > 0.1 for all tests). (F) Quantification of the density of dissociated hippocampal cells in vitro after 1 day of treatment with control or patient CSF (untreated = 21 ± 2, control [Con.] treated = 20 ± 2, patient [Pt.] treated = 20 ± 2, neurons per 750μm2, control 10501, patient 02066, n = 12 fields from 2 independent experiments; Kruskal–Wallis test, p = 0.9). (G) Quantification of the percent of terminal deoxynucleotide transferase–mediated deoxyuridine triphosphate nick-end labeling (TUNEL)–positive neurons in vitro (apoptotic cells). These measures were not significantly different among untreated, control, or patient CSF treatment (untreated = 0.005 ± 0.005, control treated = 0.01 ± 0.01, patient treated = 0.005 ± 0.005, neurons per 750μm2, n = 12 fields [750μm2], 1 patient sample [02066] and 1 control sample [10501], 2 independent experiments; Kruskal–Wallis test, p = 0.7).
To examine whether the patient antibodies affected neuronal viability, the density of neurons on coverslips was assayed by staining with 4′,6-diamidino-2-phenylindole and MAP2 to label nuclei and neuron dendritic arbors, respectively. After 24 hours of treatment, the density of neurons treated with patient CSF was comparable with the density in control or untreated conditions (Fig 2F), suggesting that patient anti-AMPAR antibodies did not cause significant neuronal loss. Consistently, the percentage of terminal deoxynucleotide transferase–mediated deoxyuridine triphosphate nick-end labeling–positive apoptotic neurons was very low (<1%) in all conditions (Fig 2G), suggesting that patient anti-AMPAR antibodies did not induce significant neuronal apoptosis. This is consistent with lack of significant neuronal loss and frequently observed patient recovery to predisease baseline.5
Together, our data suggest that the loss of surface and synaptic localization caused by patient antibodies was specific to AMPARs without widespread effects on most other synaptic components or neuronal viability.
Patient Antibodies Increase the Net Internalization of AMPAR Clusters
The decrease of synaptic AMPARs following patient antibody treatment was accompanied by the appearance of AMPAR-positive clusters that were nonsynaptic (see Fig 1A, green GluA1 or GluA2 clusters that were not colocalized with red PSD-95 clusters in patient's antibody treatment, compared to yellow clusters in control treatment). To determine whether the reduction of surface AMPARs resulted from receptor internalization, surface AMPARs were labeled by a commercial anti-GluA1 antibody (comGluA1), followed by treatment with control or patient CSF for 1, 4, and 24 hours.
Control treated neurons showed a decrease of surface GluA1 AMPARs by 24 hours (Fig 3A, C; 40.5% decrease by 24 hours). This suggested that under basal conditions, GluA1-containing AMPARs undergo a relatively slow rate of turnover. In contrast, neurons treated with patient CSF showed a significantly decreased surface cluster density by 24 hours (Fig 3A, C; 88.6% decrease, Mann–Whitney U test, compared to control treated at 24 hours, p = 0.002). This suggests that patient anti-AMPAR antibodies cause a rapid internalization of surface AMPARs.
Figure 3.

Patient antibodies increase the internalization of AMPAR clusters. Hippocampal neurons were labeled live for surface AMPARs using commercial anti-GluA1 (comGluA1) for 1 hour, then treated with control (09724) or patient (02066) CSF for 1, 4 or 24 hours, followed by immunostaining for the remaining surface comGluA1 in live neurons. In experiments examining internalized comGluA1, before fixation, neurons were pretreated with an excess of unconjugated secondary antibodies, then fixed, permeabilized, and immunostained for internal comGluA1 (n = 23 neurons from 3 separate experiments). (A) Top and middle panels: Representative dendrites from neurons treated with control or patient CSF respectively for 1, 4, or 24 hours and stained for surface comGluA1. Patient CSF treatment caused a greater decrease in surface GluA1 over a 24-hour time period than control. Bottom image: dendrites preblocked with excessive nonfluorescent secondary antibodies and then stained with fluorescent secondary antibody against comGluA1, showing complete elimination of surface staining signal. Scale bar = 10μm. (B) Representative dendrites from neurons treated with control (top) or patient CSF (bottom) for 1, 4, or 24 hours and stained for intracellular comGluA1. Patient CSF treatment increased intracellular comGluA1 at 1 and 4 hours compared to controls. Scale bar = 10μm. (C) Quantification of surface comGluA1 clusters from neurons treated with patient CSF for 1 hour compared with control neurons (per 20μm dendrite length, control treated 1 hour = 20 ± 1, 4 hours = 20 ± 1, 24 hours = 12 ± 1; patient CSF treated 1 hour = 20 ± 1, 4 hours = 14 ± 2, 24 hour = 2 ± 1; Mann–Whitney U test, 1 hour p = 0.3, 4 hours p = 0.04, 24 hours p = 0.002). (D) Quantification of the density of intracellular comGluA1 clusters from neurons treated with control or patient CSF. Control treated 1 hour = 7 ± 1, 4 hours = 5 ± 0.4; 24 hours = 3 ± 0.3; patient CSF treated 1 hour = 11 ± 1, 4 hours = 14 ± 2, 24 hours = 4 ± 0.2; Mann–Whitney U test, 1 hour p = 0.03, 4 hours p = 0.0003, 24 hours p = 0.007. * indicates p < 0.05, ** p < 0.01, *** p < 0.001. (E) Hippocampal neurons were treated with patient CSF for 4 hours, then surface patient antibodies were pretreated by nonfluorescent secondary antibodies, and then stained for intracellular patient antibodies (green) and the following cell compartment markers (red): EEA for early endosome, Lamp1 for lysosome, or TrfR for recycling endosome. The upper panels show representative images of dendrites, the bottom panels show images of cell bodies (n = 6–7 neurons for each condition). Scale bar = 10μm. (F) Quantification of the percentage of internalized patient antibody clusters colocalized with each cell organelle marker in dendrites (EEA = 7 ± 1%, Lamp1 = 8 ± 2%, TrfR = 13 ± 2%). (G) Quantification of percentage of internalized patient antibody clusters colocalized with each cell organelle marker in cell bodies (EEA = 5 ± 1%, Lamp1 = 42 ± 5%, TrfR = 9 ± 3%).
To specifically quantify internalized AMPARs, neurons were pretreated with an excess of unconjugated secondary antibodies to block the binding of fluorescently conjugated secondary antibodies to comGluA1 antibodies in the immunostaining procedure (Fig 3A, bottom image shows effectiveness preblockade). The total number of internal GluA1-containing AMPARs decreased in control treated neurons over time, but were increased in neurons treated with patient antibodies at 1 hour and 4 hours, consistent with induced internalization of AMPARs (Fig 3B, D; Mann–Whitney U test, 1 hour p = 0.03, 4 hours p = 0.003, 24 hours p = 0.007). By 24 hours, internal GluA1 clusters were low in both conditions (Fig 3B, D), indicating that prelabeled AMPARs underwent degradation rapidly. These data suggest that patient anti-AMPAR antibodies increase the net AMPAR internalization rate, and this loss of surface AMPARs is accompanied by transient accumulation of internalized AMPARs.
Previous studies suggest internalized AMPARs are targeted to the early endosome, then either recycled back to the surface, or transferred to late endosome and lysosome for degradation.19 To examine the compartmentalization of AMPAR clusters internalized by patient antibodies, neurons were treated with patient antibodies for 4 hours, a time point when internalized AMPARs were ample, then stained for intracellular patient antibodies as well as early endosome (EEA1), late endosome/lysosome (Lamp1), or recycling endosome (transferrin receptor [TrfR]) markers (Fig 3E, green indicates intracellular AMPARs labeled by patient antibodies, red indicates cell compartment marker). A small percentage of intracellular patient antibody-bound AMPARs (Fig 3E, F; around 10% or less) were colocalized with the early endosome marker EEA1 or recycling endosome marker TrfR in dendrites and cell bodies. In contrast, in the cell body, 42 ± 5% of these intracellular AMPAR clusters were colocalized with the lysosome marker Lamp1. A similar colocalization of intracellular AMPAR clusters with Lamp1 was observed in cells treated with control CSF (not significantly different; p = 0.18; data not shown).
These results suggest that the patient antibodies increase net internalization rate of surface AMPARs and that internalized AMPARs are degraded in lysosomes.
Commercial Anti-AMPAR Antibodies Do Not Result in Receptor Internalization
We next examined whether commercially available anti-AMPAR antibodies have similar effects on synaptic AMPAR clusters. After 1 day of treatment with a commercial anti-GluA1 antibody (Calbiochem) or anti-GluA2 antibody (Millipore), the synaptic localization of AMPAR clusters was unchanged (Fig 4A, B), across a wide range of antibody concentrations. When the GluA1 antibody concentration was high (dilution = 1:20, 1:50), AMPAR cluster staining increased, most likely due to an increased association of commercial antibodies with surface receptors in the absence of increased internalization (Fig 4C; treatment with GluA1 at 1:50 dilution does not increase AMPAR internalization). Interestingly, when a secondary antibody was included to crosslink the primary antibody in neurons treated with anti-GluA2 antibodies, a significant decrease of synaptic AMPAR cluster density was observed (Fig 4A, B).
Figure 4.

Commercial antibodies do not have the same effects as patient antibodies. (A) Neurons were treated with phosphate-buffered saline (PBS), commercial (comm.) anti-GluA2, or anti-GluA1 antibodies directed against extracellular epitopes, with and without secondary antibodies to crosslink the primary antibodies, or secondary antibodies alone for 24 hours. Neurons were immunostained with an anti-GluA1 antibody against an intracellular epitope (if treated with anti-GluA2 antibody) or directly with fluorescent secondary (if treated with anti-GluA1) and for the presynaptic marker synapsin. Commercial anti-GluA2 antibodies with secondary antibody treatment for 24 hours decrease synaptic GluA1 cluster density (the colocalized yellow puncta are green labeled GluA1 clusters colocalized with red synapsin clusters, indicating synaptic GluA1). Scale bar = 10μm (n = 6–13 neurons from 3 experiments). (B) Quantification of the percentage of synaptic AMPAR cluster density per 20μm dendrite length from neurons treated with commercial GluA1 antibody or commercial GluA2 antibody compared to neurons treated with PBS (compared to PBS control, GluA1 1:20 = 225 ± 11%, GluA1 1:50 = 238 ± 26%, GluA1 1:100 = 112 ± 12%, GluA1 1:500 = 138 ± 15%, GluA2 1:100 = 78 ± 5%, GluA2 1:500 = 80 ± 6%, GluA2 1:100 + 2nd = 61 ± 5%, GluA2 1:500 + 2nd 1:500 = 44 ± 3%, 2nd only 1:500 = 91 ± 13%, analysis of variance followed by Dunn multiple comparison test, p < 0.0001; *significant decrease, #significant increase). (C) Quantification of internalization of GluA1 clusters prelabeled with a commercial antibody per 20μm dendrite from neurons also treated with a commercial GluA1 antibody, a commercial GluA2 antibody, or patient antibodies (n = 11–13 neurons from 3 experiments, 0 hours = 1 ± 0.3, GluA1 1:100 = 2 ± 0.4, GluA1 1:50 = 2 ± 0.5, GluA2 1:500 4 hours = 4 ± 0.4, GluA2 + 2nd 1:500 = 9 ± 0.8, patient CSF = 17 ± 1; Kruskal–Wallis test, p < 0.0001, *significant difference).
To further confirm that treatment with commercial GluA2 antibodies plus secondary antibodies increased net internalization of AMPARs while decreasing synaptic AMPARs, as observed with patient antibodies, we examined the amount of internalized AMPARs. Neurons prelabeled with GluA1 antibodies were treated with commercial GluA1 antibodies, GluA2 antibodies with or without secondary antibody, or with patient CSF (Fig 4C). The patient CSF-treated neurons had the highest density of internalized AMAPR clusters; neurons treated with commercial GluA2 plus secondary antibody also had a significantly higher density of internalized AMPARs compared to baseline levels. Neurons treated with commercial GluA1 or GluA2 antibodies alone did not show increased accumulation of internalized AMPARs over 4 hours. These results suggest that some commercially available primary-plus-secondary antibody complexes have a similar but less potent effect on internalization of surface AMPARs as patient antibodies, whereas commercial anti-GluA antibodies alone do not alter surface receptor localization.
Patient Antibodies Decrease AMPAR- but Not NMDAR-Mediated Synaptic Transmission
To determine whether patient antibodies reduce AMPAR-mediated synaptic transmission, AMPAR-mediated mEPSCs were measured using whole-cell voltage clamp recordings from neurons treated with patient (anti-GluA1 or anti-GluA2) or control CSF for 24 hours. Recordings were carried out in the presence of TTX, PTX, and APV to block action potentials, GABAAR-mediated inhibitory currents, and NMDAR-mediated currents, respectively.
In neurons treated with control CSF, frequent AMPAR-mediated mEPSCs were observed, with average amplitude of 15 ± 1 pA and average frequency of 8 ± 1Hz (Fig 5A, C, D). In contrast, the AMPAR-mediated mEPSCs in neurons treated with anti-GluA2 patient CSF were significantly smaller and less frequent, with an amplitude of 10 ± 1 pA (Fig 5A, C) and a frequency of 2 ± 1 Hz (Fig 5A, D). Thus, the anti-GluA2 patient antibodies caused a significant decrease in mEPSC amplitude and frequency compared to controls, and this was consistent with another recent report.26 This decrease was also evident by 4 hours after treatment (Fig 5C, D), consistent with immunostaining data demonstrating significant antibody-mediated receptor internalization at this time point. Similar results were observed for neurons treated with anti-GluA1 patient antibody (n = 5), with a 58 ± 1% decrease in mEPSC amplitude and a 21 ± 12% decrease in frequency compared to control treatment after 24 hours. These results suggest that patient anti-GluA1 and anti-GluA2 antibodies decrease the amplitude and frequency of AMPAR-mediated mEPSCs in hippocampal neurons.
Figure 5.
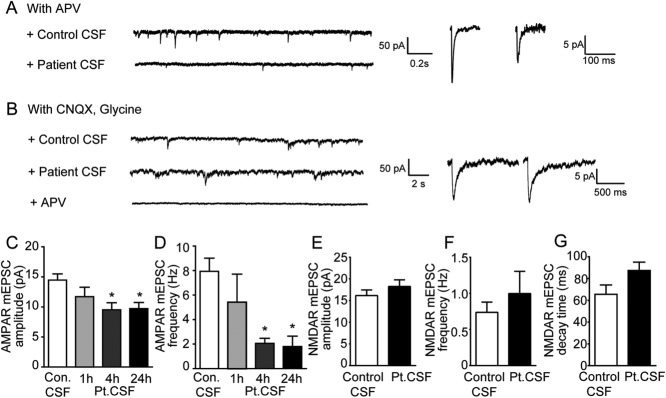
Patient antibodies decrease AMPAR but not NMDAR-mediated synaptic transmission. (A) Miniature excitatory postsynaptic currents (mEPSCs) recorded in physiological saline with TTX, picrotoxin (PTX), and APV to isolate synaptic AMPAR-mediated currents (upper trace); n = 9 neurons treated with control cerebrospinal fluid (CSF), 4 to 7 neurons treated with patient CSF for 1, 4, or 24 hours. Two patient (02066, 04067) and 2 control (09724, 09726) samples were used. Left: Under the same recording conditions, treatment of hippocampal neurons with patient CSF (bottom traces) for 1 day dramatically reduces synaptic AMPAR-mediated currents. Right: Representative average mEPSCs from neurons treated for 1 day with control CSF (left) or patient CSF (right). Neurons treated with patient CSF have smaller AMPAR-mediated synaptic current than neurons treated with control CSF. (B) mEPSCs recorded in physiological saline with TTX, PTX, and CNQX, to isolate synaptic NMDAR-mediated currents, and coagonist glycine. Left: Treatment of hippocampal neurons with control (upper trace) and patient CSF (bottom traces) for 1 day have comparable synaptic NMDAR-mediated currents. Right: Representative average mEPSCs from neurons treated for 1 day with control CSF (left) or patient CSF (right), show comparable synaptic NMDAR-mediated currents; n = 10 neurons treated with control CSF (09724), 9 neurons treated with patient CSF (02066). (C) Effect of patient antibodies on AMPAR-mediated synaptic current amplitude (in picoamperes, control [Con.] = 15 ± 1, patient [Pt.] CSF treated 1 hour = 12 ± 2, patient CSF treated 4 hours = 10 ± 1, patient CSF treated 24 hours = 10 ± 1; *significant difference, 1-way analysis of variance [ANOVA] test, p = 0.01). (D) Effect of patient antibodies on AMPAR-mediated synaptic current frequency (in hertz, control = 8 ± 1, patient CSF treated 1 hour = 5 ± 2, patient CSF treated 4 hours = 2 ± 0.4, patient CSF treated 24 hours = 2 ± 0.8; *significant difference, 1-way ANOVA test, p = 0.0017). (E) Effect of patient antibodies on NMDAR-mediated synaptic current amplitudes (in picoamperes, control = 16 ± 1, patient CSF treated = 18 ± 2; Student t test, p = 0.2). (F) Effect of patient antibodies on NMDAR-mediated synaptic current frequency (in hertz, control = 0.7 ± 0.1, patient CSF treated = 1 ± 0.3; Student t test, p = 0.44). (G) Effect of patient antibodies on NMDAR-mediated synaptic current decay time (in milliseconds, control = 66 ± 9, patient CSF treated = 88 ± 8; Student t test, p = 0.09).
To determine whether the effect of patient antibodies on synaptic currents is specific to AMPARs, NMDAR-mediated currents were also measured. To measure these independently of AMPAR-mediated mEPSCs, recordings were carried out in the presence of TTX, PTX, CNQX (an AMPAR blocker), and glycine to reveal all functional NMDARs.27 The amplitude, frequency and decay time of NMDAR-mediated currents, which can be blocked by APV (Fig 5B, bottom trace), were not significantly different in neurons treated with control or patient CSF (Fig 5B, E–G). This result suggests that the patient antibodies specifically eliminate AMPAR function. Because excitatory synapse density along dendrites assayed by immunostaining was not altered, the proportion of silent synapses without AMPARs was increased. In addition, the observation that the frequency of NMDAR-mediated currents was not affected also suggests that glutamatergic presynaptic release probability is unlikely to be altered by patient antibodies.
These results show that patient antibodies specifically decrease synaptic AMPAR-mediated currents and not NMDAR-mediated currents, consistent with the specific loss of surface, synaptically localized AMPAR clusters. The functional effect of antibody-mediated AMPAR internalization is a weakening of glutamatergic synaptic transmission.
Compensatory Decrease in Inhibition in Neurons Treated with Patient Antibodies
Previous studies showed that chronic pharmacological blockade of AMPAR-mediated transmission led to a homeostatic decrease of inhibitory synapse strength such that neurons maintain their firing rate.28–32 To examine whether similar compensatory changes occurred following the decrease in AMPAR-mediated transmission induced by patient antibodies, mIPSCs were recorded in the presence of TTX, APV, and CNQX. Measurements were done 48 hours after patient CSF treatment, and the decrease of synaptic AMPARs assayed by immunostaining was comparable to 24-hour treatment. The frequency of mIPSCs decreased significantly (Fig 6A–C, Student t test, p = 0.03), whereas the amplitude was comparable between control and patient antibody-treated conditions. To examine the effects of patient antibodies on inhibitory synapses, neurons were immunostained with an inhibitory presynaptic marker, vGAT, and the postsynaptic GABAAR β2/3 (Fig 6D). Patient CSF or CNQX treatment for 48 hours reduced vGAT staining intensity (Fig 6D, F), whereas the density of inhibitory synapses defined by colocalization of vGAT and GABAAR clusters was comparable among conditions. To confirm that the change of vGAT staining intensity was not a direct result of patient's antibodies but rather a reflection of decreased neuronal excitation, coverslips were treated with KCl to depolarize neurons, increasing their activity, with or without patient CSF. In conditions with KCl alone or KCl plus patient CSF, presynaptic vGAT cluster intensity was increased significantly (Fig 6D, F), suggesting that changes in inhibitory tone were determined by the level of neuronal excitation. Together these results suggest that neurons homeostatically decrease inhibitory synaptic strength in response to the reduction in AMPAR-mediated synaptic transmission.
Figure 6.

Homeostatic decrease of GABAAR-mediated synaptic transmission. (A) Miniature inhibitory postsynaptic currents (mIPSCs) recorded in physiological saline with TTX, CNQX, and APV to isolate synaptic GABAAR-mediated currents. Hippocampal neurons treated with patient CSF (bottom left trace) for 1 day have fewer mIPSCs compared to control (upper left trace). The average amplitude of GABAAR-mediated mIPSCs in neurons treated with patient CSF (bottom right trace) was similar to control (bottom left trace); n = 8 control CSF-treated neurons, 6 patient CSF-treated neurons, 1 patient 02066, 2 control samples (09724, 09726). (B) Effect of patient antibodies on GABAAR-mediated mIPSC frequency (in hertz, control [Con.] = 1.6 ± 0.5, patient [Pt.] CSF treated = 0.4 ± 0.2; *significantly different from (B); Student t test, p = 0.03). (C) Effect of patient antibodies on GABAAR-mediated mIPSC amplitudes (in picoamperes, control = 37 ± 2, patient CSF treated = 35 ± 3; Student t test, p = 0.7). (D) Hippocampal neurons immunostained for the inhibitory presynaptic marker vGAT (red) and the postsynaptic marker GABAAR (green). Inhibitory synapses are defined as the colocalization between vGAT and GABAAR staining. Patient CSF or CNQX treatment for 24 hours reduces vGAT staining intensity, whereas patient CSF + KCl (25mM) increases vGAT intensity, compared to neurons treated with control CSF (15–24 neurons from 3 independent experiments). Scale bar = 10μm. (E) Quantification of inhibitory synapse density. Numbers of immunofluorescence labeled puncta per 20μm dendrite were normalized to controls for each trial. Neurons were treated with control CSF, patient CSF, CNQX, patient CSF + KCl (25mM), or KCl (25mM). The density of inhibitory synapses was comparable among conditions (Mann–Whitney U test, p = 0.5). (F) Cumulative distribution of vGAT intensity on neurons treated with control CSF (black solid line), patient CSF (red solid line), CNQX (green solid line), patient CSF + KCl (red dotted line), or KCl (black dotted line). Patient CSF- or CNQX-treated neurons have decreased vGAT staining intensity compared to the control (Kolmogorov–Smirnov test, p < 0.0001), whereas KCl alone or KCl + patient CSF–treated neurons have increased vGAT staining (Kolmogorov–Smirnov test, p < 0.0001).
Patient Antibodies Cause Homeostatic Increase of Intrinsic Excitability and Altered Action Potential Firing
Previous work showed that neural intrinsic properties are also affected by homeostatic scaling.33 Thus, we examined the effect of patient anti-AMPAR antibodies on intrinsic neuronal excitability in the presence of APV, CNQX, and PTX to block synaptic transmission. Neurons rarely spontaneously fire action potentials under such conditions (Fig 7A, control = 0pA), because all synaptic inputs were blocked, but fire upon current injection (Fig 7A). Neuronal excitability was greatly increased after 48 hours of treatment with patient CSF. Neurons fired more action potentials in response to the same amplitude of current injection (Fig 7A, B), and also fired action potentials spontaneously (Fig 7B, current injection = 0 pA, average = 1.7 ± 0.8 spikes per 400-millisecond duration). After treatment with patient antibodies, input resistance was increased, whereas resting potential was not significantly altered (control average = −59 ± 3mV, patient CSF-treated = −52 ± 1mV, Student t test, p = 0.15). These results suggest that after treatment with patient anti-AMPAR antibodies, neurons are more excitable, and tend to fire spontaneously without excitatory input.
Figure 7.
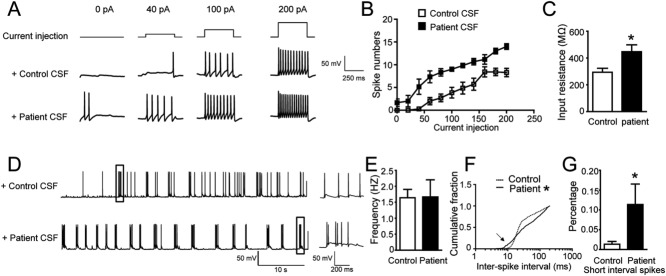
Homeostatic increase of neuronal excitability and patient antibody effects on spontaneous firing. (A) Representative traces of action potential firing during current injection (upper traces, 0pA, 40pA, 100pA, 200pA) in control treated neurons (middle traces), and patient CSF-treated neurons (bottom traces). The recording was done in the presence of APV, CNQX, and picrotoxin to block synaptic transmission; n = 7 control neurons, 6 patient CSF-treated neurons, 1 patient sample (02066) and 1 control sample (09726). (B) Quantification of action potential firing versus current injection, showing significant increase of neuronal excitability in patient CSF-treated neurons (Mann–Whitney U test, p < 0.05 for 0, 40, 60, 80,100, 120, 140, 180, and 200pA). (C) Average input resistance was higher in patient CSF-treated neurons than in controls (in megaohms, control = 294 ± 29, patient CSF-treated = 448 ± 51, *significant difference, Student t test, p = 0.04). (D) Representative traces of spontaneous action potential firing in control (upper trace) or patient CSF-treated neurons (bottom trace) without synaptic transmission blockers. The boxed segments are shown on a slower time scale on the right; n = 5 control neurons, 6 patient CSF-treated neurons, 1 patient sample (04067) and 1 control sample (09724). (E) Average action potential firing frequency was not significantly different in control or patient CSF-treated neurons (in hertz, control = 1.6 ± 0.3, patient CSF treated = 1.7 ± 0.5, Student t test, p = 0.9). (F) Cumulative distribution of action potential interspike intervals of neurons treated with control CSF (dotted line) or patient CSF (solid line). *Two distributions are significantly different (Kolmogorov–Smirnov test, p < 0.0001). (G) Comparison of percentage of short-interval spikes (with <10-millisecond intervals) in control treated or patient CSF-treated neurons (control treated = 1.3 ± 0.7%, patient treated = 11 ± 5%, *significant difference, Student t test, p = 0.02).
In the absence of synaptic blockers, neurons treated with patient antibodies had a similar average firing rate as control neurons. The maintenance of firing frequency was consistent with previous observations that average firing frequency was usually maintained after blocking excitatory synaptic transmission.33–35 However, although average firing rate was unaffected by patient antibodies, the pattern of firing was substantially altered. The interspike intervals of neurons treated with patient CSF were significantly different from control neurons (Fig 7D, F). Specifically, the percentage of spikes with extremely short interspike intervals (<10 milliseconds) was significantly increased in patient antibody-treated neurons compared to controls (Fig 7G). These results suggest that patient antibody-mediated reduction of surface AMPARs results in significant changes in patterns of action potential firing in hippocampal pyramidal neurons.
Discussion
We examined the effects of autoantibodies from anti-AMPAR encephalitis patients on hippocampal neurons. Patient AMPAR antibodies cause a selective decrease in the surface amount and synaptic localization of AMPARs, due to increased internalization of AMPARs. Consistent with this, patient antibodies caused a decrease in AMPAR- but not NMDAR-mediated excitatory postsynaptic currents. Whereas the average action potential firing frequency was unaffected, loss of surface AMPARs resulted in significant changes in the pattern of action potential firing, likely a result of reduced inhibitory synaptic transmission and an increase in intrinsic neuronal excitability. These results demonstrate patient antibody–induced synaptic and neuronal changes that may contribute to the short-term memory loss and seizures observed in patients with anti-AMPAR encephalitis.
Loss of Surface AMPARs and Deficits in Hippocampal Short-Term Memory
The phenotypes observed in mice lacking expression of individual AMPAR subunits are not conjugate with symptoms observed in patients with anti-AMPAR encephalitis. Spatial learning and memory are largely unaffected in GluA1 knockout mice.13 GluA2 knockout mice show reduced exploration, impaired motor coordination, and abnormal spatial and nonspatial learning but enhanced LTP.16,36 These studies suggest that compensatory mechanisms, including expression of other AMPAR subunits, may blunt the synaptic, circuit, and behavioral effects of loss of a particular receptor subunit. A recent study demonstrated that the surface pool of AMPARs is the critical determinant of LTP, regardless of subunit types.15 This implies that if the total surface AMPAR pool is decreased, memory problems would result. Our observation that the total surface AMPAR pool is decreased in anti-AMPAR encephalitis regardless of the antibody specificity, along with the loss of short-term memory in patients, provides strong support for this hypothesis. Our data show that patient antibodies against either GluA1 or GluA2 have similar effects on the density of both GluA1 and GluA2 subunits, without obvious compensation from the unaffected subunit. This is probably due to hippocampal AMPARs mainly being GluA1/GluA2 heteromers.8 Once the patient antibodies bind to either subunit, they would initiate endocytosis of the entire AMPAR heteromer. Thus, this form of autoimmune encephalitis provides a unique human model, and informs development of potential animal models, for understanding the role of AMPARs in learning and memory.
Another interesting aspect of anti-AMPAR encephalitis is the recovery process. Patient short-term memory can recover after therapeutic intervention to reduce antibody titer. We previously showed that after removal of patient antibodies, normal synaptic AMPAR cluster density is restored within a few days in cultured neurons.5 Our current study showed that inhibitory synaptic transmission and neural intrinsic properties were also altered after AMPAR-mediated synaptic transmission was reduced by treatment with patient antibodies. A number of interesting questions remain about whether and how synapses and neuronal and circuit properties return to their original function during and after recovery. These questions could be explored in longitudinal studies of animal models as well as human subjects before and after treatment to reduce antibody titer.
Internalization of AMPAR Triggered by Patient Antibodies
Antibodies trigger crosslinking and internalization of cell surface protein/antigen in single-cell pathogens,37 blood cells,38 muscle cells in myasthenia gravis,39,40 and neurons in anti-NMDAR encephalitis.18 Pathogenic antibody-induced internalization relies on specific epitopes on antigens. Antibodies from several subgroups of patients with anti-NMDAR encephalitis recognize a common epitope region based on the tertiary structure of amino acid residues that are remote in primary sequence.41 Antibodies from patients with myasthenia gravis also recognize a small immunogenic region of nicotinic acetylcholine receptors.42 Our results show that, in contrast to patient antibodies, 2 commercially available antibodies against the extracellular region in the amino-terminal domain (ATD)43 of AMPAR subunits do not induce internalization of surface AMPARs. One hypothesis is that patient antibodies recognize a specific epitope region, which is not recognized by commercial antibodies. Consistent with this hypothesis, anti-AMPAR encephalitis patient antibodies mainly recognize the bottom lobe of ATD,26 similar to antibodies against the NR1 subunit of the NMDAR in anti-NMDAR encephalitis.41 In contrast, the peptide sequences used to generate the commercial anti-AMPAR antibodies reside in the top lobe of ATD for anti-GluA1 antibody (Calbiochem) and in both lobes for anti-GluA2 antibody (Millipore). In our experiments, the commercial anti-GluA1 did not increase AMPAR internalization, and previous studies, which have used this antibody extensively for surface labeling of AMPARs, have not reported effects on internalization. Interestingly, the addition of a secondary antibody (as a crosslinking agent) during anti-GluA2 treatment caused greater receptor internalization and synaptic localization. These results suggest that enhanced crosslinking of the commercial primary antibody caused increased aggregation of the AMPAR-antibody complex, resulting in receptor internalization. It is tempting to speculate that the differential effects of the commercial antibodies from patient antibodies may be a result of the location of their epitopes on the AMPAR. Future studies will focus on examining whether specific amino acid residues in the bottom lobe of ATD of ionotropic glutamate receptors may be critical for autoimmunity. It also remains possible that different antibody isotypes44 give rise to the difference in AMPAR internalization, because the patient antibodies are mainly but not exclusively IgG, commercial anti-GluA1 is polyclonal IgG, and commercial anti-GluA2 is monoclonal IgG2a. Our experiments cannot rule out this possibility. Due to the limited number and amount of available high-titer patient CSF and serum samples (2 high-titer anti-AMPAR patient samples sufficient for Fab fragments preparation, many fewer than anti-NMDAR patient samples available for experiments), we were unable to directly assess the crosslinking mediated by patient antibodies as in the previous work.18 Preparing Fab fragments exhausts a large amount of patient samples due to protein loss in digestion and purification steps. When additional high-titer patient samples are identified, patient antibody crosslinking of AMPARs can be tested directly.
AMPARs are constantly cycling between the cell membrane and intracellular compartments in normal neurons. Surface AMPARs are internalized, entering early endosomes and sorting to recycling endosomes or late endosomes/lysosomes over a time course of minutes, depending on previous neuronal activity.19,45 These processes also contribute to long-term potentiation and long-term depression,46,47 which are thought to be critical in memory formation. Our results showed that surface AMPAR loss was significant after 4 hours, consistent with a significant decrease of AMPAR-mediated currents observed around the same time. One hour of patient CSF treatment did not show a significant decrease in surface AMPAR clusters but did show a significant increase of internalized AMPAR cluster density, probably due to a remaining large pool of surface AMPAR (high noise compared to signal) but low background from internalized AMPAR clusters (low noise compared to signal) for analysis. Our results do not suggest that the anti-AMPAR patient antibodies slow normal AMPAR recycling, which occurs on a scale of minutes. It is likely that individual AMPARs can be internalized minutes after binding with patient antibodies. It is also likely that some of them recycle back to the surface because about 10% of them colocalize with the recycling endosome marker TrfR. Thus, the initial imbalance between internalization and reinsertion is small. In addition, the binding of patient antibodies with AMPARs does not saturate within minutes, but likely over hours, so the antibodies' effects within the first hour may not be maximal. Together, our results specifically suggest that the balance of internalization and reinsertion is disrupted in the presence of patient antibodies, culminating in the accumulation of internalized AMPARs, which becomes functionally significant after several hours. Our results demonstrate that internalized AMPAR–patient antibody complexes are localized to early endosomes, recycling endosomes, and lysosomes, especially lysosomes in cell bodies; these are the cellular compartments that normally contain constitutively internalized AMPARs.19,45 The observations reported here were made after pretreatment of a population of surface AMPAR for over 2 hours, and examining the distribution of these receptors after 4 hours, and thus represent a significantly greater period of time than previous studies assaying activity-dependent AMPAR cycling.19,45 Our data may reflect a steady-state distribution associated with the extended presence of patient antibodies.
Homeostatic Plasticity Associated with Surface AMPAR Loss Caused by Patient Antibodies
It is a paradox that a decrease of AMPAR-mediated excitatory transmission could lead to seizures as a prominent symptom in patients. Seizures usually result from an imbalance between excitation and inhibition, either via an increase in excitation such as that caused by mutations in voltage-gated sodium channels, or a decrease in inhibition such as that caused by GABAAR dysfunction.48–52 An exception involving a decrease of AMPAR synaptic transmission is the stargazer mutant mouse, which develops absence epilepsy due to reduced AMPAR-mediated synaptic transmission in inhibitory thalamic reticular nucleus neurons, but not in excitatory relay neurons.53 None of these previously reported mechanisms can fully explain the seizures in patients with anti-AMPAR encephalitis. The work we report here suggests that the decrease of excitatory synaptic transmission caused by patient antibodies results in a decrease in inhibitory synaptic transmission and an increase in intrinsic excitability. These compensatory changes are consistent with numerous observations that pyramidal neurons tend to homeostatically maintain firing rate in response to chronic inactivity.33–35 Neurons treated with patient anti-AMPAR antibodies maintained a similar overall firing rate as the control treated neurons, consistent with homeostatic compensation. However, at this new balance point, a neuron might receive less synaptic input from other neurons and fire at a higher intrinsic rate, generating epileptic activity. Patient anti-AMPAR antibodies selectively eliminate surface and synaptic AMPARs, resulting in a homeostatic decrease in inhibitory synaptic transmission and increased intrinsic excitability, which may trigger seizures in patients with this disorder.
Acknowledgments
This work was supported by grants from the NIH: NINDS NS068294; NIMH094741 and a McKnight Neuroscience of Brain Disorders Award to R.J.B.-G and J.D., NIH National Institute of Neurological Disorders and Stroke NS077851 to J.D., and National Research Service Award NS056549 to E.G.H.
We thank M. O. Scott and M. Maronski for technical assistance and L. McCracken for maintaining patient clinical and sample databases.
Authorship
X.P., E.G.H., and E.H.M. designed and executed the experiments; J.D. provided patient samples; X.P. wrote the first draft of the manuscript; R.J.B.-G. and J.D. advised on experiment design, execution, and data analysis and edited the manuscript; T.D.P. advised on the electrophysiological execution and analyses.
Potential Conflicts of Interest
J.D.: grant, Euroimmun. R.J.B.-G.: personal fees, Pfizer.
References
- Lancaster E, Dalmau J. Neuronal autoantigens—pathogenesis, associated disorders and antibody testing. Nat Rev Neurol. 2012;8:380–390. doi: 10.1038/nrneurol.2012.99. [DOI] [PMC free article] [PubMed] [Google Scholar]
- Moscato EH, Jain A, Peng X, et al. Mechanisms underlying autoimmune synaptic encephalitis leading to disorders of memory, behavior and cognition: insights from molecular, cellular and synaptic studies. Eur J Neurosci. 2010;32:298–309. doi: 10.1111/j.1460-9568.2010.07349.x. [DOI] [PMC free article] [PubMed] [Google Scholar]
- Sansing LH, Tüzün E, Ko MW, et al. A patient with encephalitis associated with NMDA receptor antibodies. Nat Clin Pract Neurol. 2007;3:291–296. doi: 10.1038/ncpneuro0493. [DOI] [PMC free article] [PubMed] [Google Scholar]
- Dalmau J, Gleichman AJ, Hughes EG, et al. Anti-NMDA-receptor encephalitis: case series and analysis of the effects of antibodies. Lancet Neurol. 2008;7:1091–1098. doi: 10.1016/S1474-4422(08)70224-2. [DOI] [PMC free article] [PubMed] [Google Scholar]
- Lai M, Hughes EG, Peng X, et al. AMPA receptor antibodies in limbic encephalitis alter synaptic receptor location. Ann Neurol. 2009;65:424–434. doi: 10.1002/ana.21589. [DOI] [PMC free article] [PubMed] [Google Scholar]
- Hollmann M, Hartley M, Heinemann S. Ca2+ permeability of KA-AMPA–gated glutamate receptor channels depends on subunit composition. Science. 1991;252:851–853. doi: 10.1126/science.1709304. [DOI] [PubMed] [Google Scholar]
- Wisden W, Seeburg PH. Mammalian ionotropic glutamate receptors. Curr Opin Neurobiol. 1993;3:291–298. doi: 10.1016/0959-4388(93)90120-n. [DOI] [PubMed] [Google Scholar]
- Lu W, Shi Y, Jackson AC, et al. Subunit composition of synaptic AMPA receptors revealed by a single-cell genetic approach. Neuron. 2009;62:254–268. doi: 10.1016/j.neuron.2009.02.027. [DOI] [PMC free article] [PubMed] [Google Scholar]
- Wenthold RJ, Petralia RS, Blahos J, Jr, Niedzielski AS. Evidence for multiple AMPA receptor complexes in hippocampal CA1/CA2 neurons. J Neurosci. 1996;16:1982–1989. doi: 10.1523/JNEUROSCI.16-06-01982.1996. [DOI] [PMC free article] [PubMed] [Google Scholar]
- Palmer CL, Cotton L, Henley JM. The molecular pharmacology and cell biology of alpha-amino-3-hydroxy-5-methyl-4-isoxazolepropionic acid receptors. Pharmacol Rev. 2005;57:253–277. doi: 10.1124/pr.57.2.7. [DOI] [PMC free article] [PubMed] [Google Scholar]
- Shepherd JD, Huganir RL. The cell biology of synaptic plasticity: AMPA receptor trafficking. Annu Rev Cell Dev Biol. 2007;23:613–643. doi: 10.1146/annurev.cellbio.23.090506.123516. [DOI] [PubMed] [Google Scholar]
- Sprengel R. Role of AMPA receptors in synaptic plasticity. Cell Tissue Res. 2006;326:447–455. doi: 10.1007/s00441-006-0275-4. [DOI] [PubMed] [Google Scholar]
- Zamanillo D, Sprengel R, Hvalby O, et al. Importance of AMPA receptors for hippocampal synaptic plasticity but not for spatial learning. Science. 1999;284:1805–1811. doi: 10.1126/science.284.5421.1805. [DOI] [PubMed] [Google Scholar]
- Meng Y, Zhang Y, Jia Z. Synaptic transmission and plasticity in the absence of AMPA glutamate receptor GluR2 and GluR3. Neuron. 2003;39:163–176. doi: 10.1016/s0896-6273(03)00368-4. [DOI] [PubMed] [Google Scholar]
- Granger AJ, Shi Y, Lu W, et al. LTP requires a reserve pool of glutamate receptors independent of subunit type. Nature. 2013;493:495–500. doi: 10.1038/nature11775. [DOI] [PMC free article] [PubMed] [Google Scholar]
- Jia Z, Agopyan N, Miu P, et al. Enhanced LTP in mice deficient in the AMPA receptor GluR2. Neuron. 1996;17:945–956. doi: 10.1016/s0896-6273(00)80225-1. [DOI] [PubMed] [Google Scholar]
- Kaech S, Banker G. Culturing hippocampal neurons. Nat Protoc. 2006;1:2406–2415. doi: 10.1038/nprot.2006.356. [DOI] [PubMed] [Google Scholar]
- Hughes EG, Peng X, Gleichman AJ, et al. Cellular and synaptic mechanisms of anti-NMDA receptor encephalitis. J. Neurosci. 2010;30:5866–5875. doi: 10.1523/JNEUROSCI.0167-10.2010. [DOI] [PMC free article] [PubMed] [Google Scholar]
- Ehlers MD. Reinsertion or degradation of AMPA receptors determined by activity-dependent endocytic sorting. Neuron. 2000;28:511–525. doi: 10.1016/s0896-6273(00)00129-x. [DOI] [PubMed] [Google Scholar]
- Peng X, Parsons TD, Balice-Gordon RJ. Determinants of synaptic strength vary across an axon arbor. J Neurophysiol. 2012;107:2430–2441. doi: 10.1152/jn.00615.2011. [DOI] [PMC free article] [PubMed] [Google Scholar]
- Bergsman J, Krueger S, Fitzsimonds R. Automated criteria-based selection and analysis of fluorescent synaptic puncta. J Neurosci Methods. 2006;152:32–39. doi: 10.1016/j.jneumeth.2005.08.008. [DOI] [PubMed] [Google Scholar]
- Ohkawa T, Fukata Y, Yamasaki M, et al. Autoantibodies to epilepsy-related LGI1 in limbic encephalitis neutralize LGI1-ADAM22 interaction and reduce synaptic AMPA receptors. J Neurosci. 2013;33:18161–18174. doi: 10.1523/JNEUROSCI.3506-13.2013. [DOI] [PMC free article] [PubMed] [Google Scholar]
- Bassani S, Folci A, Zapata J, Passafaro M. AMPAR trafficking in synapse maturation and plasticity. Cell Mol Life Sci. 2013;70:4411–4430. doi: 10.1007/s00018-013-1309-1. [DOI] [PMC free article] [PubMed] [Google Scholar]
- Chen L, Chetkovich DM, Petralia RS, et al. Stargazin regulates synaptic targeting of AMPA receptors by two distinct mechanisms. Nature. 2000;408:936–943. doi: 10.1038/35050030. [DOI] [PubMed] [Google Scholar]
- Schnell E, Sizemore M, Karimzadegan S, et al. Direct interactions between PSD-95 and stargazin control synaptic AMPA receptor number. Proc Natl Acad Sci U S A. 2002;99:13902–13907. doi: 10.1073/pnas.172511199. [DOI] [PMC free article] [PubMed] [Google Scholar]
- Gleichman AJ, Panzer JA, Baumann BH, et al. Antigenic and mechanistic characterization of anti-AMPA receptor encephalitis. Ann Clin Transl Neurol. 2014;1:180–189. doi: 10.1002/acn3.43. [DOI] [PMC free article] [PubMed] [Google Scholar]
- Wilcox KS, Fitzsimonds RM, Johnson B, Dichter MA. Glycine regulation of synaptic NMDA receptors in hippocampal neurons. J Neurophysiol. 1996;76:3415–3424. doi: 10.1152/jn.1996.76.5.3415. [DOI] [PubMed] [Google Scholar]
- Kilman V, van Rossum MCW, Turrigiano GG. Activity deprivation reduces miniature IPSC amplitude by decreasing the number of postsynaptic GABA(A) receptors clustered at neocortical synapses. J Neurosci. 2002;22:1328–1337. doi: 10.1523/JNEUROSCI.22-04-01328.2002. [DOI] [PMC free article] [PubMed] [Google Scholar]
- Hartman KN, Pal SK, Burrone J, Murthy VN. Activity-dependent regulation of inhibitory synaptic transmission in hippocampal neurons. Nat Neurosci. 2006;9:642–649. doi: 10.1038/nn1677. [DOI] [PubMed] [Google Scholar]
- Swanwick CC, Murthy NR, Kapur J. Activity-dependent scaling of GABAergic synapse strength is regulated by brain-derived neurotrophic factor. Mol Cell Neurosci. 2006;31:481–492. doi: 10.1016/j.mcn.2005.11.002. [DOI] [PMC free article] [PubMed] [Google Scholar]
- Rannals MD, Kapur J. Homeostatic strengthening of inhibitory synapses is mediated by the accumulation of GABA(A) receptors. J Neurosci. 2011;31:17701–17712. doi: 10.1523/JNEUROSCI.4476-11.2011. [DOI] [PMC free article] [PubMed] [Google Scholar]
- Peng Y-R, Zeng S-Y, Song H-L, et al. Postsynaptic spiking homeostatically induces cell-autonomous regulation of inhibitory inputs via retrograde signaling. J Neurosci. 2010;30:16220–16231. doi: 10.1523/JNEUROSCI.3085-10.2010. [DOI] [PMC free article] [PubMed] [Google Scholar]
- Turrigiano G. Too many cooks? Intrinsic and synaptic homeostatic mechanisms in cortical circuit refinement. Annu Rev Neurosci. 2011;34:89–103. doi: 10.1146/annurev-neuro-060909-153238. [DOI] [PubMed] [Google Scholar]
- Burrone J, O'Byrne M, Murthy VN. Multiple forms of synaptic plasticity triggered by selective suppression of activity in individual neurons. Nature. 2002;420:414–418. doi: 10.1038/nature01242. [DOI] [PubMed] [Google Scholar]
- Turrigiano GG, Leslie KR, Desai NS, et al. Activity-dependent scaling of quantal amplitude in neocortical neurons. Nature. 1998;391:892–896. doi: 10.1038/36103. [DOI] [PubMed] [Google Scholar]
- Gerlai R, Henderson JT, Roder JC, Jia Z. Multiple behavioral anomalies in GluR2 mutant mice exhibiting enhanced LTP. Behav Brain Res. 1998;95:37–45. doi: 10.1016/s0166-4328(98)00002-3. [DOI] [PubMed] [Google Scholar]
- Ferrante A, Thong YH. Antibody induced capping and endocytosis of surface antigens in Naegleria fowleri. Int J Parasitol. 1979;9:599–601. doi: 10.1016/0020-7519(79)90018-3. [DOI] [PubMed] [Google Scholar]
- Santoso S, Zimmermann U, Neppert J, Mueller-Eckhardt C. Receptor patching and capping of platelet membranes induced by monoclonal antibodies. Blood. 1986;67:343–349. [PubMed] [Google Scholar]
- Drachman DB. Myasthenia gravis. N Engl J Med. 1994;330:1797–1810. doi: 10.1056/NEJM199406233302507. [DOI] [PubMed] [Google Scholar]
- Drachman DB, Angus CW, Adams RN, et al. Myasthenic antibodies cross-link acetylcholine receptors to accelerate degradation. N Engl J Med. 1978;298:1116–1122. doi: 10.1056/NEJM197805182982004. [DOI] [PubMed] [Google Scholar]
- Gleichman AJ, Spruce LA, Dalmau J, et al. Anti-NMDA receptor encephalitis antibody binding is dependent on amino acid identity of a small region within the GluN1 amino terminal domain. J Neurosci. 2012;32:11082–11094. doi: 10.1523/JNEUROSCI.0064-12.2012. [DOI] [PMC free article] [PubMed] [Google Scholar]
- Tzartos SJ, Barkas T, Cung MT, et al. Anatomy of the antigenic structure of a large membrane autoantigen, the muscle-type nicotinic acetylcholine receptor. Immunol Rev. 1998;163:89–120. doi: 10.1111/j.1600-065x.1998.tb01190.x. [DOI] [PubMed] [Google Scholar]
- Sobolevsky AI, Rosconi MP, Gouaux E. X-ray structure, symmetry and mechanism of an AMPA-subtype glutamate receptor. Nature. 2009;462:745–756. doi: 10.1038/nature08624. [DOI] [PMC free article] [PubMed] [Google Scholar]
- Chuntharapai A, Dodge K, Grimmer K, et al. Isotype-dependent inhibition of tumor growth in vivo by monoclonal antibodies to death receptor 4. J Immunol. 2001;166:4891–4898. doi: 10.4049/jimmunol.166.8.4891. [DOI] [PubMed] [Google Scholar]
- Lee SH, Simonetta A, Sheng M. Subunit rules governing the sorting of internalized AMPA receptors in hippocampal neurons. Neuron. 2004;43:221–236. doi: 10.1016/j.neuron.2004.06.015. [DOI] [PubMed] [Google Scholar]
- Van der Sluijs P, Hoogenraad CC. New insights in endosomal dynamics and AMPA receptor trafficking. Semin Cell Dev Biol. 2011;22:499–505. doi: 10.1016/j.semcdb.2011.06.008. [DOI] [PubMed] [Google Scholar]
- Fernández-Monreal M, Brown TC, Royo M, Esteban JA. The balance between receptor recycling and trafficking toward lysosomes determines synaptic strength during long-term depression. J Neurosci. 2012;32:13200–13205. doi: 10.1523/JNEUROSCI.0061-12.2012. [DOI] [PMC free article] [PubMed] [Google Scholar]
- Baulac S, Huberfeld G, Gourfinkel-An I, et al. First genetic evidence of GABA(A) receptor dysfunction in epilepsy: a mutation in the gamma2-subunit gene. Nat Genet. 2001;28:46–48. doi: 10.1038/ng0501-46. [DOI] [PubMed] [Google Scholar]
- Bowser DN, Wagner DA, Czajkowski C, et al. Altered kinetics and benzodiazepine sensitivity of a GABAA receptor subunit mutation [gamma 2(R43Q)] found in human epilepsy. Proc Natl Acad Sci U S A. 2002;99:15170–15175. doi: 10.1073/pnas.212320199. [DOI] [PMC free article] [PubMed] [Google Scholar]
- Thind KK, Yamawaki R, Phanwar I, et al. Initial loss but later excess of GABAergic synapses with dentate granule cells in a rat model of temporal lobe epilepsy. J Comp Neurol. 2010;518:647–667. doi: 10.1002/cne.22235. [DOI] [PMC free article] [PubMed] [Google Scholar]
- Escayg A, Goldin AL. Sodium channel SCN1A and epilepsy: mutations and mechanisms. Epilepsia. 2010;51:1650–1658. doi: 10.1111/j.1528-1167.2010.02640.x. [DOI] [PMC free article] [PubMed] [Google Scholar]
- Gibbs JW, Sombati S, DeLorenzo RJ, Coulter DA. Physiological and pharmacological alterations in postsynaptic GABA(A) receptor function in a hippocampal culture model of chronic spontaneous seizures. J Neurophysiol. 1997;77:2139–2152. doi: 10.1152/jn.1997.77.4.2139. [DOI] [PubMed] [Google Scholar]
- Menuz K, Nicoll RA. Loss of inhibitory neuron AMPA receptors contributes to ataxia and epilepsy in stargazer mice. J Neurosci. 2008;28:10599–10603. doi: 10.1523/JNEUROSCI.2732-08.2008. [DOI] [PMC free article] [PubMed] [Google Scholar]