Abstract.
A fluorescence resonance energy transfer (FRET)-based microbubble contrast agent system was designed to experimentally demonstrate the concept of ultrasound-modulated fluorescence (UMF). Microbubbles were simultaneously labeled with donor and acceptor fluorophores on the surface to minimize self-quenching and maximize FRET. In response to ultrasound, the quenching efficiency was greatly modulated by changing the distance between the donor and acceptor molecules through microbubble size oscillations. Both donors and acceptors exhibited UMF on individual microbubbles. The UMF strength of the donor was more significant compared to that of the acceptor. Furthermore, the UMF of the donor was observed from a microbubble solution in a turbid media. This study exploits the feasibility of donor–acceptor labeled microbubbles as UMF contrast agents.
Keywords: ultrasound-modulated fluorescence, microbubble, contrast agent, oscillation, quenching, fluorescence resonance energy transfer
1. Introduction
Ultrasound-modulated fluorescence (UMF) has gained much attention as a hybrid imaging modality since it combines the unique features of ultrasound and fluorescent imaging.1–9 The idea is that the fluorescence photons are modulated by a focused ultrasound beam. By specifically analyzing the modulated fluorescence photons, we can quantify the fluorescent properties at the ultrasound focal volume. Therefore, UMF may provide tissue functional and anatomical information through the choice of appropriate fluorescent markers.10,11 Meanwhile, a high spatial resolution and a large imaging depth can be maintained by choosing an appropriate ultrasound frequency.1–5
The major challenge of UMF is to distinguish the ultrasonically modulated fluorescence photons from a high-level unmodulated fluorescence background. To improve the modulation efficiency (the ratio of the modulated to unmodulated signal), microbubbles have been recently utilized to increase the sensitivity of fluorescence to the ultrasound wave. Yuan et al.3 and Hall et al.4 demonstrated an enhanced modulation efficiency by simply mixing microbubbles with fluorophores. Due to the high compressibility of microbubbles, the large volumetric oscillation of microbubbles leads to a large modulation of the local optical properties and/or fluorophore concentration. Moreover, more sensitive UMF contrast agents based on fluorophore-labeled microbubbles have been developed to significantly improve the modulation efficiency through a quenching effect.7,8,12–15 One research group has designed a microbubble whose phospholipid shell was embedded with a type of lipophilic dye.7,15 Recently, we developed a contrast agent by conjugating a type of NHS-ester-attached fluorophore on the surfaces of amine-functionalized microbubbles.8 In both types of fluorophore-attached microbubbles, the self-quenching efficiency is believed to depend upon the surface concentration of the fluorophore on the bubble’s surface, which can be modulated when the bubble is oscillated in size by an ultrasound wave. In both studies, a single type of dye and its self-quenching effect have been adopted because of the simplicity of bubble-labeling protocols.
Fluorescence resonance energy transfer (FRET) has been well studied during the past decades. The energy transfer efficiency from the donor to the acceptor via FRET depends greatly upon the (average) donor–acceptor distance. When FRET occurs between a single donor and a single acceptor, the transfer efficiency is inversely proportional to the sixth power of the donor–acceptor distance. When donor molecules are randomly mixed with acceptor molecules, the FRET is usually called an ensemble FRET, which means the energy of an excited donor can transfer to multiple surrounding acceptors. Although compared with the FRET between a single donor and a single acceptor, the dependence of the transfer efficiency of the ensemble FRET upon the average donor–acceptor distance degrades, the ensemble FRET still shows significant transfer efficiency if the donor’s and acceptor’s concentrations are optimized. For the purpose of microbubble-based UMF, we speculate that FRET can enhance the modulation efficiency of UMF.
In this study, we are interested in exploiting the feasibility of a donor–acceptor-labeled (D–A) microbubble contrast agent system for UMF and how this donor–acceptor protocol differs from or proves better than the self-quenching protocol. First, microbubbles were simultaneously labeled with donors and acceptors with different concentrations on the surface via a conjugating reaction between amine and NHS ester. The UMF modulation efficiencies of the donor and acceptor were quantitatively studied at these varied initial quenching statuses. In the end, a solution of contrast agents was injected into a polydimethylsiloxane (PDMS) tube and the tube was immersed in a scattering medium (Intralipid solution) for in vitro study of UMF. We chose PDMS because it is easy to mold and create microchannels to mimic blood vessels. In addition, because it is almost optically and ultrasonically transparent, we can observe its microstructure and microbubble flow before adding optical scattering medium and can also minimize unnecessary acoustic distortion.
2. Principle of UMF Via FRET-Based Microbubbles
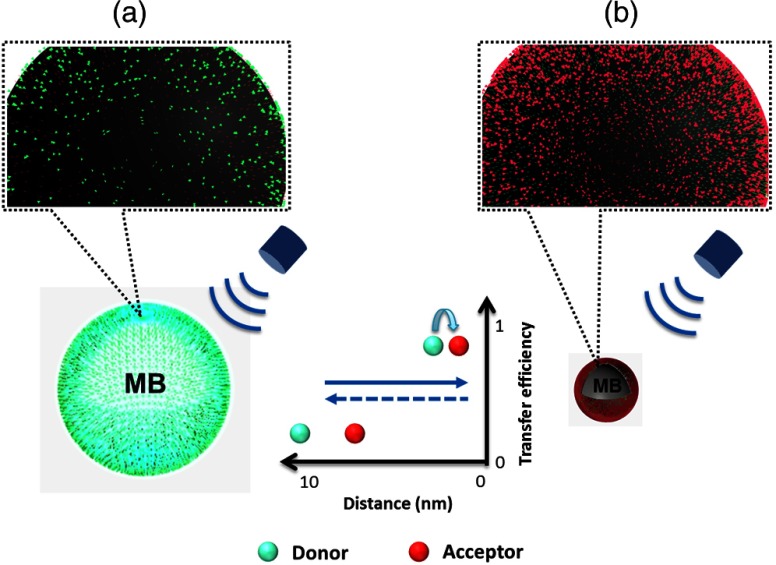
Figure 1 schematically illustrates the principle of UMF based on a donor–acceptor-labeled microbubble. In FRET, an excited donor can transfer its energy to an acceptor when the two have spectral overlap and are in close proximity. The transfer efficiency (or the equivalently called quenching efficiency of the donor) highly depends on the (average) donor–acceptor distance.16–20 Microbubbles were randomly labeled with both donors and acceptors on the surface. Because the distances among donors and acceptors were close enough, ensemble FRET occurred. When the microbubble is expanded during a negative phase of the ultrasonic pressure cycle, the average distance between the donor and acceptor increases. As a result, the quenching efficiency of acceptors to donors (or FRET efficiency from donors to acceptors) is reduced, leading to an obvious increase in the donor’s fluorescence intensity. In contrast, as the microbubble is compressed in a positive ultrasonic pressure cycle, the average distance between the donor and acceptor decreases. This causes a significant quenching of donors by acceptors (or FRET from donors to acceptors), reducing the donor’s intensity and increasing the acceptor’s intensity.
Fig. 1.
The diagram of the ultrasound-modulated fluorescence (UMF) based on fluorescence resonance energy transfer (FRET) between donors and acceptors attached to a microbubble (MB): (a) a negative pressure cycle and (b) a positive pressure cycle.
3. Materials and Methods
3.1. Preparation of FRET Microbubbles
Microbubbles (4 to in diameter) with primary amine lipid groups on the surface were prepared with the same protocol as previously described in the literature.21 In brief, a lipid suspension of 90 mol % DSPE (1,2-distearoyl-sn-glycero-3-phosphoethanolamine, ME-8080, NOF America Corporation) and 10 mol % DSPE-PEG (N-(carbonyl-methoxypolyethyleneglycol 2000)-1,2-distearoyl-sn-glycero-3-phosphoethanolamine, DSPE-020CN, NOF America Corporation) solution was mixed with perfluorobutane gas (APF-N2HP, FluoroMed) to generate microbubbles. ATTO 532-NHS and ATTO 647N-NHS (Sigma-Aldrich) dyes were attached on the bubble surface via the reaction between NHS and amine and were adopted as the donor and acceptor, respectively, for FRET. These two dyes were selected because they have good spectral overlap and high quantum yields. We selected the dye concentration based on the result from our previous study where only one type of dye-NHS (ATTO 532-NHS) was labeled on the amine-microbubble. We found that the fluorescence intensity first increased as the dye loading concentration increased, until it reached to peak when the mole ratio of NHS-to-amine was 0.3.8 This indicated that before reaching the maximum intensity, dye self-quenching did occur and resulted in the lifetime decrease, but the fluorescence intensity still increased due to the increased dye concentration. When the dye concentration was further increased, the intensity started to drop, and the self-quenching effect overwhelmed. Although the self-quenching was not excluded at the ratio of 0.3,8 the fluorescence intensity reached the maximum and can be used as an optimized donor concentration for investigating FRET based UMF. Thus, in the first set of experiments, we maintained the donor NHS-to-amine ratio at 0.3, and varied the acceptor NHS-to-amine ratio from 0 to 0.03 (see Table 1). In addition, we investigated FRET microbubbles using a different donor concentration in order to confirm the occurrence of FRET. In a second set of experiments, the donor NHS-to-amine ratio was maintained at 0.1, and the acceptor NHS-to-amine ratio was varied from 0 to 0.03 (see Table 1). Remember that in this study there are two NHS-to-amine ratios (one for donor and the other one for acceptor), while in the previous study there was only one. The dye and microbubble mixture were reacted in a pH 8.5 PBS buffer solution (Thermo Scientific, adjusted pH with 0.1 M NaOH) for 1 h at room temperature with constant and gentle agitation. Then the unreacted ligands were removed through three times of centrifugal washing with PBS buffer pH 8.5. The purified D–A microbubbles were diluted prior to use.
Table 1.
Configuration of donor-acceptor labelled microbubble solutions.
| Group # (mole ratio) | ATTO 532-NHS group set I | ATTO 532-NHS group set II | ||||||
|---|---|---|---|---|---|---|---|---|
| I1 | I2 | I3 | I4 | II1 | II2 | II3 | II4 | |
| ATTO 647N-NHS | 0 | 0.003 | 0.01 | 0.03 | 0 | 0.003 | 0.01 | 0.03 |
| Amine (on microbubble) | 1 | 1 | 1 | 1 | 1 | 1 | 1 | 1 |
3.2. Characterization of the Fluorescence Intensity and Lifetime of FRET Microbubbles
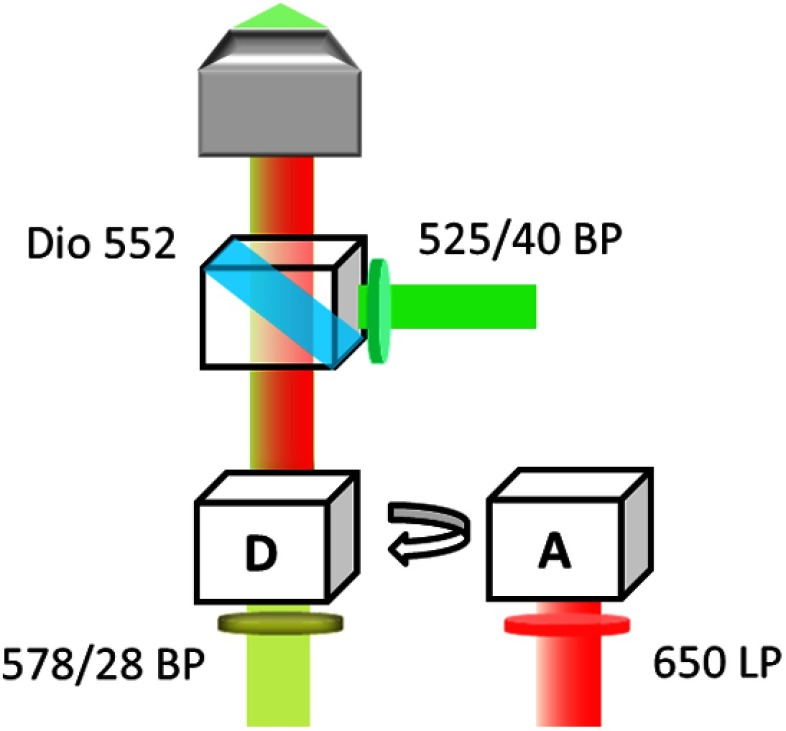
The fluorescence intensities and lifetimes of both donors and acceptors from the labeled microbubbles were measured using a fluorescence lifetime imaging microscope (FLIM) system. The details of the system have been introduced in our previous study.8 Briefly, the system was based on an inverted Nikon microscope. First, a 532-nm ps pulsed laser (Katana, Onefive) was coupled into the microscope as the light source. In the filter set, a bandpass filter (FF02-525/40-25, Semrock) and a 552 nm dichroic mirror (FF552-Di02, Semrock) were used as the excitation and dichroic filters, respectively. This excitation filter was not necessary when the laser was adopted for FLIM because the laser has a very narrow wavelength spectrum. However, it is needed in the following section when a broad-bandwidth lamp is used as the light source for UMF experiments. The dichroic mirror reflected the laser into a objective to illuminate the sample. Then the fluorescence emission was collected by the same objective, passed through the same dichroic filter, and reached the emission filters. The emission filters were switched between a bandpass filter (FF01-572/28-25, Semrock) and a 650 nm long-pass filter (BLP01-633R-25, Semrock) to separate the emissions from the donors and the acceptors. The filter configuration is shown in Fig. 2. Next, we synchronized a gated and intensified charge-coupled camera (ICCD) system (Picostar HR, LaVision) with the laser to detect the fluorescence emissions. The ICCD camera system was set with a gate width of 300 ps and a temporal step size of 100 ps, which were sufficient to image the fluorescence lifetime in a range of nanoseconds (ns). In the end, the images acquired by the ICCD camera were saved and processed with MATLAB to calculate the fluorescence intensities and lifetimes.
Fig. 2.
Optical filter configurations in the microscope for FRET measurement. A bandpass filter and a 552 nm dichroic filter were used as the excitation and dichroic filters for the laser. Emission filters: a bandpass filter for ATTO 532-NHS (D, donor); a 650 nm long-pass filter for ATTO 647N-NHS (A, acceptor).
In each frame, several regions of interest (ROI) were selected, and each ROI has one microbubble. In each ROI, the fluorescence intensity at each pixel was fitted to a single exponential function. Then the fluorescence lifetimes of every pixel were calculated to obtain the lifetime image of the microbubble in that ROI. In addition, the peak fluorescence intensity of the dynamic decay emission of each pixel was used to generate the intensity image of the same microbubble. Finally, the fluorescence lifetime and intensity of that microbubble were defined as the mean lifetime and intensity of all the pixels in that microbubble image. It should be noted that the areas surrounding the microbubble in the selected ROI were ignored due to negligible fluorescence and lifetimes. For statistical analysis purposes, at least 10 bubbles were randomly selected in the population, and the averaged lifetime and intensity of both the donor and acceptor were calculated with a standard deviation based on those microbubbles.8
3.3. UMF Detection From Individual D–A Microbubbles
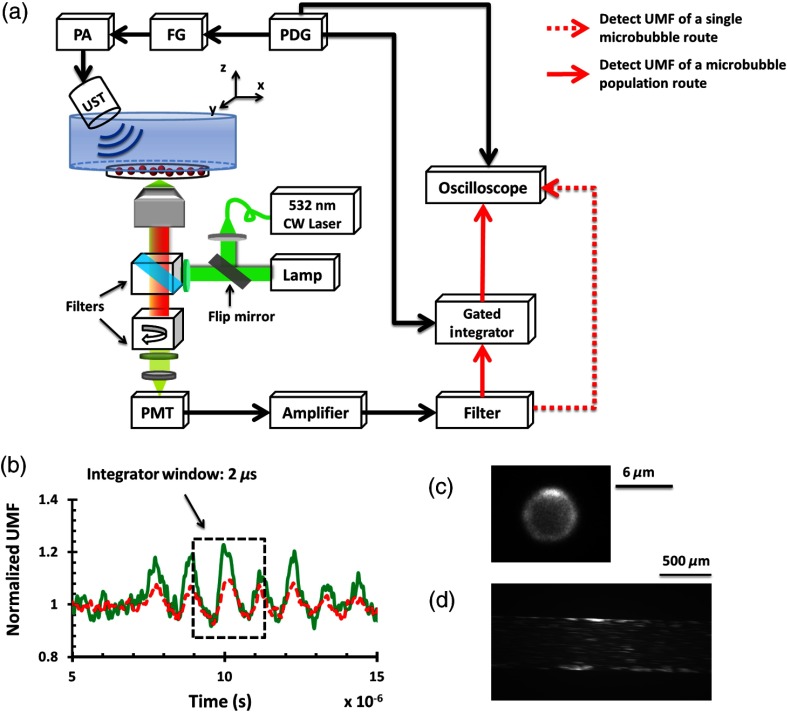
A similar imaging system has been introduced previously.8 Briefly, the optical and acoustic system in Fig. 3(a) was designed to measure the UMF signal from D–A microbubbles. First, the microbubble solution was injected into a water chamber and observed by a objective lens (field of view is 0.12 mm in diameter). Next, a 1 MHz focused transducer (UST, V314, Olympus NDT) was used to oscillate the microbubble sample. The driving signal consisted of a 3-cycle 1 MHz sinusoid electronic wave with a repetition rate of 5 Hz. The signal was generated by a function generator (FG, Agilent 22330A, Agilent Tech.) and then amplified by a power amplifier (PA, 2100L, Electronics & Innovation Ltd.). The ultrasound peak-to-peak pressure was set to be 450 kPa to avoid bubble translation or fragmentation. A metal arc lamp (Lumen 200, Prior Scientific, 20 Watts maximal power) was used to uniformly illuminate the fluorescent microbubbles, and an iris was positioned in front of the lamp to ensure that only one microbubble was illuminated and observed in the field of view. The same filters as those shown in Fig. 2 were used here. Figure 3(c) shows the fluorescent image of a single microbubble. As the microbubble was oscillated, the fluorescence emissions (including UMF and unmodulated signals) from donors and acceptors of the same sample were sequentially detected by a photomultiplier (H10721-20, Hamamatsu). The signals were then amplified by a broadband amplifier (SR445A, Stanford Research Systems) and further filtered by a low-pass filter (BLP-10.7+, Mini-Circuits). An oscilloscope synchronized with the ultrasound pulse was triggered by a pulse delay generator (PDG645, Stanford Research Systems) to acquire and display the fluorescence signal.
Fig. 3.
(a) A schematic diagram of the imaging system. PA, power amplifier; FG, function generator; PDG, pulse delay generator; UST, focused ultrasound transducer; PMT, photomultiplier. (b) A representation of the integrator gate window that was overlaid with the UMF signal. The green line represents the donor and the red dashed line represents the acceptor. (c) A fluorescent image of a single microbubble. (d) A fluorescent image of diluted microbubble solution flowing inside of the polydimethylsiloxane (PDMS) microchannel.
3.4. UMF Measurements From a Population of D–A Microbubbles
Following the characterization of individual microbubbles, the UMF signal from a population of D–A microbubbles was also studied by injecting the microbubble samples into a PDMS microchannel (SynVivo, CFD Research Corporation). The microbubble concentration is , as determined by a hemacytometer (bright-line, Hausser Scientific). Regarding its strong illumination power, a 20-mW continuous-wave 532-nm laser (MGLII532, Dragon Lasers) was used as the excitation light source. Then a objective (working distance is 30 mm and field of view is 3 mm in diameter) was adopted to deliver the excitation light and collect the emission light. As shown in Fig. 3(a), a gated boxcar integrator (SR250, Stanford Research Systems) was employed after the low-pass filter and before the oscilloscope to improve the system sensitivity and extract the weak UMF signal from the large background. The gate window of the integrator was set to , positioned to be overlaid with a 2-cycle UMF signal in response to the ultrasound wave [see Fig. 3(b)]. The UMF signal within the gate window was integrated, and the integrator output a voltage that was proportional to the average of the signal. As one can notice, to get a nonzero output, an asymmetric input signal relative to the baseline was desired. A tissue-mimicking scattering phantom was positioned between the PDMS microchannel sample and the objective lens. The phantom was made of 0.5% intralipid, with , ( is the reduced scattering coefficient, and is the absorption coefficient), and . When the 1-MHz transducer was scanned across the tube, the UMF signal acquired by the gated integrator was displayed on the oscilloscope. Figure 3(d) shows a represented fluorescent image of the diluted microbubble solution flowing inside the PDMS microchannel.
4. Results and Discussion
4.1. Quantification of Fluorescence Lifetime and Intensity of D–A Microbubbles
As listed in Table 1, several groups of microbubbles were studied with different concentrations of ATTO 532-NHS (donor) and ATTO 647N-NHS (acceptor). In group set I, the donor ATTO 532-NHS-to-amine mole ratio was fixed at 0.3. We chose this mole ratio based on our previous results8 considering it has (1) the brightest fluorescence emission that can serve as a good donor and (2) a relatively weak self-quenching effect that can minimize the interference with FRET. Then the acceptor (ATTO 647N-NHS) NHS-to-amine mole ratio was varied to be 0 (group I1, meaning no acceptors), 0.003 (group I2), 0.01 (group I3), and 0.03 (group I4), respectively. In the experiment with group set II, we varied the donor NHS-to-amine mole ratio to 0.1, and changed the acceptor NHS-to-amine mole ratio from 0 (group II1, meaning no acceptors),to 0.003 (group II2), 0.01 (group II3), and 0.03 (group II4).
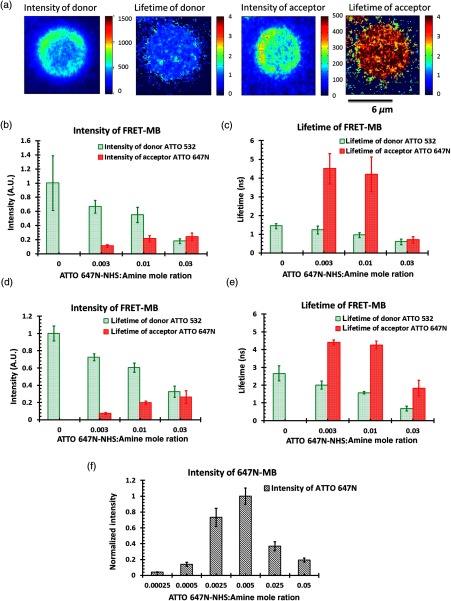
Figure 4(a) shows the fluorescence intensity and lifetime images of both the donor and acceptor of one microbubble from group I3, as listed in Table 1. The fluorescence intensities and lifetimes of both donors and acceptors of individual microbubbles in group set I were analyzed and plotted as a function of the acceptor ATTO 647N-NHS-to-amine mole ratio, as shown in Figs. 4(b) and 4(c). The interfluorophore distance among the donors and the acceptors decreased due to the increased acceptor’s concentration, which in turn induced an increased quenching efficiency. This can be seen from the gradual intensity drop of the donor and the gradual intensity increase of the acceptor illustrated in Fig. 4(b). No fluorescence emission was detected from the acceptor channel when only having the donors (group I1). This indicates that no spectral bleed through from the donor to the acceptor channel was observed in this system. A similar trend was observed in the lifetime results shown in Fig. 4(c). The donor’s lifetimes decreased from the starting lifetime of 1.4 ns in the absence of acceptors, to a minimum of at the maximum acceptor’s concentration, indicating an increased quenching effect between donors and acceptors. It should be pointed out that self-quenching of the donors did exist in the beginning, considering that the natural fluorescence lifetime of the donor (before being labeled on a microbubble) was measured as 3.8 ns. If one wanted to completely avoid self-quenching, the donor’s concentration would have to be greatly decreased, which would lead to a significant reduction in the intensity of the donor emission and, therefore, the degradation of the SNR of UMF. Thus a tradeoff exists between the fluorescence intensity and self-quenching efficiency. Conversely, the average lifetimes of the acceptor were measured as 4.5, 4.1, and 0.7 ns as the concentration increased, as seen in Fig. 4(c). The lifetime changes of the acceptor exhibit more complex mechanisms. The first two lifetimes are longer than the ATTO 647N’s natural lifetime of 3.8 ns. It is common that the acceptor’s lifetime can be prolonged during FRET. Because the acceptors can take energy from the donors via FRET during the entire lifetime period of the excited state of the donors, the fluorescence decay of the acceptor can be protracted,22,23 and this results in the prolonged lifetime of the acceptor. As for the significant lifetime drop to , it can be caused by the self-quenching of the acceptor itself because of the increased concentration. This self-quenching was confirmed by loading microbubbles with ATTO 647N alone, as shown in Fig. 4(f). This indicates that the highest fluorescence intensity occurs when the ATTO 647N-NHS-to-amine ratio is 0.005. After that, a strong self-quenching effect happens and results in a significant fluorescence intensity drop. In comparison, for the ATTO 532-NHS alone labeled microbubbles, the highest fluorescent intensity occurs when the ratio is 0.3 before the self-quenching effect dominates. This fact indicates that the attachment efficiency of ATTO 647N-NHS-to-amine microbubbles is relatively higher than that of ATTO 532-NHS. The reason is currently unclear. Similar trends of fluorescence intensity and lifetime changes for donors and acceptors in group set II were observed, as shown in Figs. 4(d) and 4(e). With the gradual increase of the acceptor concentration, the donor intensity reduced, the acceptor intensity increased, and the donor lifetime decreased (from 2.66 to 0.67 ns). This could be attributed to FRET. In groups II2 and II3, the acceptor presented slightly prolonged lifetimes, akin to the observation in groups I2 and I3. Then the lifetime was shortened significantly to 1.8 ns in group II4, which indicates that besides FRET, self-quenching occurred among acceptors. From those results, it is reasonable to believe that the same mechanisms exist behind these two sets of experiments.
Fig. 4.
(a) Fluorescence intensity and lifetime images of both donor and acceptor of one D–A microbubble from group #3, as listed in Table 1. The scale bar is . (b) The normalized average fluorescence intensity and (c) lifetime of both donors and acceptors on D–A microbubbles as a function of ATTO 647N-NHS-to-amine mole ratio when ATTO 532-NHS-to-amine mole ratio was fixed at 0.3 (Table 1). (d) and (e) Similar to (b) and (c) but ATTO 532-NHS-to-amine mole ratio was fixed at 0.1 (Table 1). (f) The average fluorescence intensity of ATTO 647N-labeled microbubbles as a function of ATTO 647N-NHS-to-amine ratio.
4.2. Quantification of the UMF Signal From Individual D–A Microbubbles
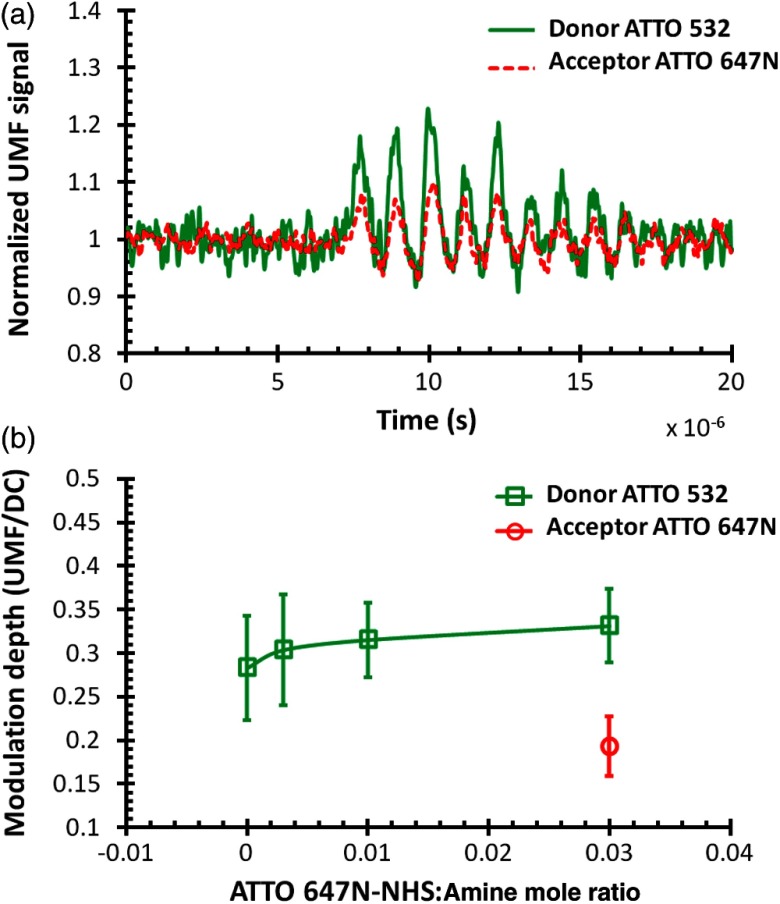
The UMF signal of both donors and acceptors from the same contrast agents was examined. Figure 5(a) shows representative normalized UMF signals of a single microbubble from group #4, where ATTO 532-NHS:ATTO 647N-NHS:amine . The donor and the acceptor present in-phase UMF signals corresponding to the microbubble oscillation when the ultrasound is applied. UMF signals show that the microbubble continues to oscillate for a finite time after the 3-cycle driving force ceases.24,25 The two in-phase UMF signals indicate that there are other quenching mechanisms besides FRET. Four mechanisms may be involved: the FRET effect, the reabsorption–reemission effect, the acceptor’s self-quenching effect, and the donor’s self-quenching effect. (1) The FRET effect causes the intensity and lifetime of the donor to decrease, yet it alone would induce complementary UMF signals from the donor and the acceptor (meaning if the donor’s intensity decreased the acceptor’s intensity increased). (2) Reabsorption–reemission can occur at high dye concentrations where the emitted light from donors can be reabsorbed by the acceptors in the region of the spectral overlap between absorption and emission.26 This effect would explain the observed in-phase UMF signals. (3) The acceptor’s self-quenching effect would also result in the in-phase UMF signals and would explain the lifetime decrease of the acceptor in group #4. (4) The donor’s self-quenching effect may exist in all four groups. For the acceptor’s UMF signal, the FRET and the other three mechanisms functioned oppositely, and the latter three mechanisms might be dominant compared with FRET. Conversely, for the donor’s UMF signal, all four mechanisms function together. Asymmetric oscillations around the baseline were observed from both UMF signals. A similar phenomenon was observed in our previous study.8 The asymmetric oscillation around the baseline is determined by the initial quenching strength of both dyes in group #4. Because the initial quenching efficiency (caused by all the above possible mechanisms) was already very strong, the quenching efficiency could only be enhanced to a limited degree when the bubble was compressed, which led to a relatively small signal decrease. In contrast, when the bubble was expanded, the quenching efficiency could be greatly attenuated, resulting in a more significant signal increase.
Fig. 5.
(a) Normalized UMF signal of both donors and acceptors from one contrast agent (group #4 in Table 1) when ATTO 532-NHS:ATTO 647N-NHS:amine mole ratio is 0.3:0.03:1. (b) UMF modulation depth of both donor and acceptor as a function of ATTO 647N-NHS-to-amine mole ratio, where ATTO 532-NHS-to-amine mole ratio was fixed at 0.3.
The UMF intensity was calculated as peak-to-peak voltage, and the UMF modulation depth was defined as the ratio of the UMF strength to the unmodulated fluorescence, i.e., the DC fluorescence signal when there was no ultrasound. Figure 5(b) shows the modulation depth of both donor and acceptor as a function of ATTO 647N-NHS-to-amine mole ratio. When the ratio increases, the modulation depth of the donor increases accordingly. A maximum of modulation depth is observed. For the acceptor, the UMF signals of the first three groups were too weak to be observed. A modulation depth of was detected at the maximum ratio. This may be explained by the strong self-quenching induced at the acceptor’s high concentration, seen from the lifetime result in Fig. 5(b). As mentioned previously, the acceptor’s UMF may be generated when the other three mechanisms are dominant compared with FRET. When increasing the acceptor’s concentration, in this case the self-quenching effect becomes much stronger.
4.3. UMF Signal From a Population of FRET Microbubbles
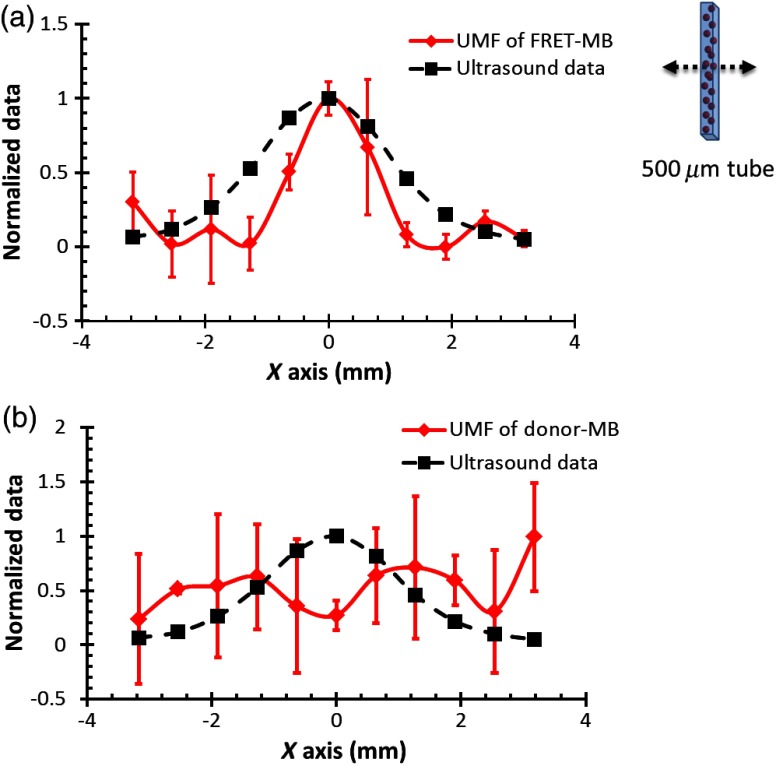
Among the four samples, group #4 exhibited the highest modulation efficiency for both donors and acceptors, but the fluorescence intensities were weak. Instead, groups #2 and #3 presented relatively high UMF modulation depths and strong fluorescence signals. In order to study the UMF signal from a population of FRET microbubbles, we chose to inject group #3 contrast agents into a PDMS micronchannel tube. Group #1 contrast agents with the lowest modulation depth were tested as the control group (considered as donor-only microbubbles). Here, the ultrasound pressure was fixed at 405 kPa to achieve the strongest UMF signal and minimize sample damage. Figure 6 displays the UMF signal strength of donors in these two groups when the ultrasound transducer is scanned across the tube. The signal intensity of the acceptors was too weak to be detected, so results were not presented here. The inset of Fig. 6(a) shows the measurement configuration. The transducer was scanned across the tube with a step size of 0.635 mm. Three scans were conducted and the averaged results were calculated. The UMF signal was normalized and displayed together with the ultrasonic echo recorded based on the conventional pulse-echo method. The results showed that the UMF signals from the control group (group #1) were too weak to correctly represent the tube, shown in Fig. 6(b). In contrast, the UMF signals of the FRET microbubbles showed a similar profile to the ultrasound echo, as shown in Fig. 6(a). The successful detection of UMF signals from group #3 can be attributed to the following facts. First, the presence of acceptors increased the quenching efficiency and the UMF modulation efficiency of the donors. In addition, although the modulation efficiency increase from the control group to group #3 was not significant (from to ), the increased quenching effect also induced the asymmetry of the UMF signals, which is not presented in the figures. An asymmetric signal relative to the baseline was necessary for the detecting system to avoid a zero output. This strong UMF modulation efficiency and the asymmetry of the UMF signal were the keys for UMF imaging in the scattering media using the proposed system. As noticed, the full-width-half-maximum (FWHM) of the UMF signal is slightly smaller than that of the ultrasound (). The possible explanation is that the detecting system has a sensitivity threshold that could not detect the weak signals at the side of the tube. Only the UMF signals from the tube center were detected and, therefore, generated a smaller FWHM.
Fig. 6.
(a) Normalized UMF signal from a PDMS microchannel tube filled with contrast agents (group #3 in Table 1) by scanning the 1 MHz transducer across the tube. (b) Normalized UMF signal from a PDMS microchannel filled with contrast agents (group #1 in Table 1, the control group) by scanning the 1 MHz transducer across the tube.
In addition, we tested group #4 contrast agents that demonstrated the highest modulation efficiency but the lowest fluorescence intensity using the scattering phantom. The UMF signals were too weak to correctly show the tube after passing through the scattering media. To sum up, in order to get the UMF signal from the large nonmodulated light background in the designed system, the following three criteria should be considered: (1) relatively strong UMF modulation efficiency, (2) asymmetric UMF oscillation waveform relative to the baseline if using the gated integrator, and (3) relatively strong fluorescence signal intensity. Therefore, the quantity of donor and acceptor should be carefully designed. In this study, the control group #1 presented a quite high fluorescence intensity but low modulation efficiency and weak signal asymmetry; group #4 presented a fairly strong modulation efficiency and signal asymmetry but weak fluorescence intensity. Thus, neither of them could be used for UMF imaging in the scattering media. Group #3 contrast agents satisfied all these criteria and were proven plausible for UMF imaging. It is reasonable to assume that all contrast agents that fall into these certain criteria range could be used for UMF imaging.
5. Conclusions
In this study, donor–acceptor-labeled microbubbles were designed and characterized as UMF imaging contrast agents for the first time. UMF signals from both donor and acceptor were observed from individual microbubbles. The UMF modulation efficiency of the donor could be improved after introducing the acceptors. However, when we compared the maximum modulation efficiency of individual contrast agents using these two protocols (the donor–acceptor-labeled microbubbles protocol and the self-quenching labeled microbubbles protocol8), a similar maximum modulation depth () was observed at 405 kPa, with no significant difference observed. Results showed that more complex mechanisms besides FRET coexisted in the D–A microbubble system, caused by the random attachment of the fluorophores. To improve the modulation efficiency further, it is necessary to target the donors and acceptors more specifically. For example, the donor and acceptor can be linked prior to being labeled onto the microbubble surface to avoid random attachment. In addition, UMF signals of the donor from a (inner diameter) tube in scattering media were observed with an ultrasound resolution. The strong UMF signal and high modulation depth indicates that those contrast agents can potentially be used for UMF imaging.
Acknowledgments
This work was supported in part by funding from the NIH/NIBIB 7R15EB012312-02 (B. Yuan), the CPRIT RP120052 (B. Yuan), the NSF CBET-1253199 (B. Yuan), the NHARP 13310 (B. Yuan), and the NSF CBET-1133687 (M. Borden).
Biographies
Yuan Liu received her PhD degree from the joint program of the University of Texas at Arlington and the University of Texas Southwestern Medical Center at Dallas in 2014. Her PhD research interests were developing ultrasound-mediated fluorescence imaging techniques and microbubble-based contrast agents for early cancer detection.
Jameel A. Feshitan received his BS degree from the University of Missouri, Columbia, in 2007 and his PhD degree from Columbia University, New York, in 2012, both in chemical engineering. He completed postdoctoral research at the University of Colorado, Boulder, Colorado, where he developed oxygen microbubbles to treat acute respiratory failure caused by severe lung injury. In 2014, he founded the Biotech Company, Advanced Microbubbles Laboratories, which develops microbubble ultrasound contrast agents for research use.
Ming-Yuan Wei received his PhD degree in environmental science from the Chinese Academy of Science in 2009. He worked as a postdoctoral research associate at West Virginia University and then in the Department of Bioengineering, University of Texas at Arlington. His current research interests include the development of contrast agents for ultrasound-switchable fluorescence imaging with thermoresponsive polymer or nanoparticles and environment-sensitive fluorophores.
Mark A. Borden received his PhD in chemical engineering from the University of California Davis in 2003. He is currently an associate professor of mechanical engineering at the University of Colorado, Boulder. His research focus is physicochemical microbubbles and their applications in biomedical imaging, drug delivery, and oxygenation.
Baohong Yuan received his PhD degree in biomedical engineering from the University of Connecticut, Storrs, Connecticut, USA, in 2006. He is currently an associate professor of biomedical engineering at the University of Texas at Arlington, Arlington, Texas, USA. His research interest is to explore and develop new imaging technology, including contrast agents and instruments, for understanding cancer mechanisms, early detecting and diagnosing cancers, and monitoring cancer treatment efficiency.
References
- 1.Yuan B. H., Liu Y., “Ultrasound-modulated fluorescence from rhodamine B aqueous solution,” J. Biomed. Opt. 15(2), 021321 (2010). 10.1117/1.3333546 [DOI] [PubMed] [Google Scholar]
- 2.Kobayashi M., et al. , “Fluorescence tomography in turbid media based on acousto-optic modulation imaging,” Appl. Phys. Lett. 89(18), 181102 (2006). 10.1063/1.2364600 [DOI] [Google Scholar]
- 3.Yuan B. H., et al. , “Microbubble-enhanced ultrasound-modulated fluorescence in a turbid medium,” Appl. Phys. Lett. 95(18), 181113 (2009). 10.1063/1.3262959 [DOI] [Google Scholar]
- 4.Hall D. J., et al. , “Detection of ultrasound-modulated photons and enhancement with ultrasound microbubbles,” Proc. SPIE 7177, 71771L (2009). 10.1117/12.808603 [DOI] [Google Scholar]
- 5.Hall D. J., Sunar U., Farshchi-Heydari S., “Quadrature detection of ultrasound-modulated photons with a gain-modulated, image-intensified, CCD camera,” Open Opt. J. 2(1), 75–78 (2008). 10.2174/1874328500802010075 [DOI] [Google Scholar]
- 6.Jarrett C. W., Caskey C. F., Gore J. C., “Detection of a novel mechanism of acousto-optic modulation of incoherent light,” PLoS One 9(8), e104268 (2014). 10.1371/journal.pone.0104268 [DOI] [PMC free article] [PubMed] [Google Scholar]
- 7.Benchimol M. J., et al. , “Phospholipid/carbocyanine dye-shelled microbubbles as ultrasound-modulated fluorescent contrast agents,” Soft Matter 9(8), 2384–2388 (2013). 10.1039/c2sm26900g [DOI] [PMC free article] [PubMed] [Google Scholar]
- 8.Liu Y., et al. , “Ultrasound-modulated fluorescence based on fluorescent microbubbles,” J. Biomed. Opt. 19(8), 085005 (2014). 10.1117/1.JBO.19.8.085005 [DOI] [PMC free article] [PubMed] [Google Scholar]
- 9.Liu Y., Yuan B., Vignola J., “Effect of fluorescent particle size on the modulation efficiency of ultrasound-modulated fluorescence,” Int. J. Opt. 2012, 1–7 (2012). 10.1155/2012/260709 [DOI] [PMC free article] [PubMed] [Google Scholar]
- 10.Ibsen S., Schutt C. E., Esener S., “Microbubble-mediated ultrasound therapy: a review of its potential in cancer treatment,” Drug Des. Dev. Ther. 7, 375–388 (2013). 10.2147/DDDT [DOI] [PMC free article] [PubMed] [Google Scholar]
- 11.Yuan B., Rychak J., “Tumor functional and molecular imaging utilizing ultrasound and ultrasound-mediated optical techniques,” Am. J. Pathol. 182(2), 305–311 (2013). 10.1016/j.ajpath.2012.07.036 [DOI] [PMC free article] [PubMed] [Google Scholar]
- 12.Yuan B. H., “Ultrasound-modulated fluorescence based on a fluorophore-quencher-labeled microbubble system,” J. Biomed. Opt. 14(2), 024043 (2009). 10.1117/1.3120493 [DOI] [PubMed] [Google Scholar]
- 13.Yuan B. H., “Sensitivity of fluorophore-quencher labeled microbubbles to externally applied static pressure,” Med. Phys. 36(8), 3455–3469 (2009). 10.1118/1.3158734 [DOI] [PubMed] [Google Scholar]
- 14.Yuan B. H., Gamelin J., Zhu Q., “Mechanisms of the ultrasonic modulation of fluorescence in turbid media,” J. Appl. Phys. 104(10), 103102 (2008). 10.1063/1.3021088 [DOI] [PMC free article] [PubMed] [Google Scholar]
- 15.Schutt C. E., et al. , “Ultrasound-modulated fluorescent contrast agent for optical imaging through turbid media,” Proc. SPIE 8165, 81650B (2011). 10.1117/12.894056 [DOI] [Google Scholar]
- 16.Chen R. F., Knutson J. R., “Mechanism of fluorescence concentration quenching of carboxyfluorescein in liposomes—energy-transfer to nonfluorescent dimers,” Anal. Biochem. 172(1), 61–77 (1988). 10.1016/0003-2697(88)90412-5 [DOI] [PubMed] [Google Scholar]
- 17.Hamann S., et al. , “Measurement of cell volume changes by fluorescence self-quenching,” J. Fluoresc. 12(2), 139–145 (2002). 10.1023/A:1016832027325 [DOI] [Google Scholar]
- 18.Zhuang X. W., et al. , “Fluorescence quenching: a tool for single-molecule protein-folding study,” Proc. Natl. Acad. Sci. U. S. A. 97(26), 14241–14244 (2000). 10.1073/pnas.97.26.14241 [DOI] [PMC free article] [PubMed] [Google Scholar]
- 19.Tarsa P. B., et al. , “Detecting force-induced molecular transitions with fluorescence resonant energy transfer,” Angew. Chem. Int. Ed. 46(12), 1999–2001 (2007). 10.1002/(ISSN)1521-3773 [DOI] [PMC free article] [PubMed] [Google Scholar]
- 20.Estep T. N., Thompson T. E., “Energy transfer in lipid bilayers,” Biophys. J. 26(2), 195–207 (1979). 10.1016/S0006-3495(79)85244-3 [DOI] [PMC free article] [PubMed] [Google Scholar]
- 21.Feshitan J. A., et al. , “Theranostic Gd(III)-lipid microbubbles for MRI-guided focused ultrasound surgery,” Biomaterials 33(1), 247–255 (2012). 10.1016/j.biomaterials.2011.09.026 [DOI] [PMC free article] [PubMed] [Google Scholar]
- 22.Shorte S. L., Frischknecht F., Imaging Cellular and Molecular Biological Functions: With 13 Tables, Springer-Verlag Berlin Heidelberg, Berlin, Heidelberg: (2007). [Google Scholar]
- 23.Saremi B., et al. , “Re-evaluation of biotin-streptavidin conjugation in fluorescence resonance energy transfer applications,” J. Biomed. Opt. 19(8), 085008 (2014). 10.1117/1.JBO.19.8.085008 [DOI] [PMC free article] [PubMed] [Google Scholar]
- 24.Pace N. G., Cowley A., Campbell A. M., “Short pulse acoustic excitation of microbubbles,” J. Acoust. Soc. Am. 102(3), 1474–1479 (1997). 10.1121/1.420062 [DOI] [Google Scholar]
- 25.Versluis M., et al. , “Microbubble shape oscillations excited through ultrasonic parametric driving,” Phys. Rev. E 82(2), 026321 (2010). 10.1103/PhysRevE.82.026321 [DOI] [PubMed] [Google Scholar]
- 26.Wurth C., et al. , “Relative and absolute determination of fluorescence quantum yields of transparent samples,” Nat. Protoc. 8(8), 1535–1550 (2013). 10.1038/nprot.2013.087 [DOI] [PubMed] [Google Scholar]


