Abstract
Rationale and Objectives
Geometric analysis of the left atrium and pulmonary veins is important for assessing reverse structural remodeling following cardiac ablation therapy. Most volumetric analysis techniques, however, require laborious manual tracing of image cross-sections. Pulmonary vein diameters are typically measured at the junction between the left atrium and pulmonary veins, called the pulmonary vein ostia, with manually drawn lines on volume renderings or in image slices. In this work, we describe a technique for making semi-automatic measurements of left atrial volume and pulmonary vein diameters from high resolution CT scans and demonstrate its use for analyzing reverse structural remodeling following cardiac ablation therapy.
Methods
The left atrium and pulmonary veins are segmented from high-resolution computed tomography (CT) volumes using a 3D volumetric approach and cut planes are interactively positioned to separate the pulmonary veins from the body of the left atrium. Left atrial volume and pulmonary vein ostial diameters are then automatically computed from the segmented structures. Validation experiments are conducted to evaluate accuracy and repeatability of the measurements. Accuracy is assessed by comparing left atrial volumes computed with the proposed methodology to a manual slice-by-slice tracing approach. Repeatability is assessed by making repeated volume and diameter measurements on duplicated and randomized datasets. The proposed techniques were then utilized in a study of 21 patients from the Catheter Ablation versus Antiarrhythmic Drug Therapy for Atrial Fibrillation Trial (CABANA) pilot study who were scanned both before and approximately three months following ablation therapy.
Results
In the high resolution CT scans the left atrial volume measurements show high accuracy with a mean absolute difference of 2.3±1.9 cm3 between volumes computed with the proposed methodology and a manual slice-by-slice tracing approach. In the intra-rater repeatability study, the mean absolute difference in left atrial volume was 4.7±2.5 cm3 and 4.4±3.4 cm3 for the two raters. Intra-rater repeatability for pulmonary vein diameters ranged from 0.9 to 2.3 mm. The inter-rater repeatability for left atrial volume was 5.8±5.1 cm3 and inter-rater repeatability for pulmonary vein diameter measurements ranged from 1.4 to 2.3 mm. In the patient study, significant (p < .05) decreases in left atrial volume and all four pulmonary vein diameters were observed. The absolute change in LA volume was 20.0 cm3, 95% CI [12.6, 27.5]. The left inferior pulmonary vein diameter decreased 2.1 mm, 95% CI [0.4, 3.7], the left superior pulmonary vein diameter decreased 3.2 mm, 95% CI [1.0, 5.4], the right inferior pulmonary vein diameter decreased 1.5 mm, 95% CI [0.3, 2.7], and the right superior pulmonary vein diameter decreased 2.8 mm, 95% CI [1.4, 4.3].
Conclusions
Using the proposed techniques, we demonstrate high accuracy of left atrial volume measurements as well as high repeatability for left atrial volume and pulmonary vein diameter measurements. Following cardiac ablation therapy, a significant decrease was observed for left atrial volume as well as all four pulmonary vein diameters.
1. Introduction
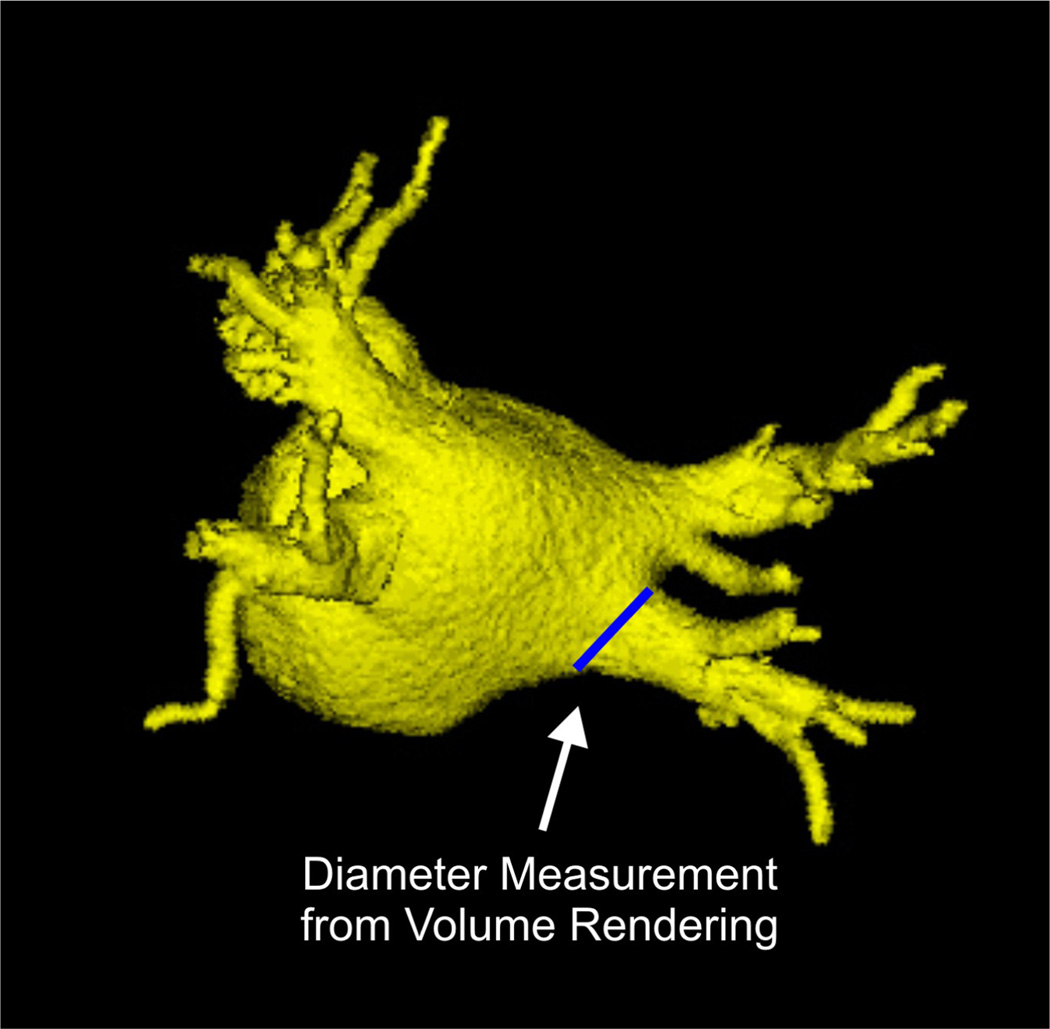
In left atrial fibrillation (AF), the atria of the heart beat rapidly and asynchronously resulting in irregular heartbeats. It has been shown that patients with AF have increased left atrial volumes and pulmonary vein diameters [1, 2], a process termed structural remodeling. Cardiac ablation therapy is a treatment strategy in which catheters are guided into the left atrium and used to created radiofrequency lesions in the myocardial tissue in order to interrupt the aberrant electrical signals causing the arrythmia. Reverse structural remodeling has been shown to occur following ablation therapy with decreases in left atrial volume and pulmonary vein diameters [3, 4, 5, 6, 7]. To date, however, most analysis techniques of left atrial volume require labor intensive manual tracing of image cross-sections [4, 8] or volumetric estimation using line measurements from orthogonal images slices [5, 6, 9]. Pulmonary vein diameters have also typically been measured with manual approaches using line measurements in image slices [2, 6, 10, 11, 12, 13] or on volume renderings [3, 4, 14] as illustrated in Figure 1.
Figure 1.
Example of measuring the right inferior pulmonary vein ostium using lines drawn manually on a volume rendering of the left atrium and pulmonary veins.
In this work, we have developed a semi-automated approach for measuring left atrial volume and pulmonary vein diameters from high resolution CT scans. After extracting the left atrium and pulmonary veins as a single structure from the volumetric data, the pulmonary veins are separated from the body of the left atrium by interactively positioning a 3D cut plane at the pulmonary vein ostia. The cut plane is visualized simultaneously as a 3D plane in a volume view as well as lines in the three orthogonal image views. The oblique image which represents the ostial plane is also shown in an additional window. The combination of these visual cues allows the user to accurately position the plane based on both 3D and 2D anatomical information and the the final diameter measurement is automatically computed in the oblique ostial image plane. The proposed techniques were validated to assess both accuracy against a manual slice-by-slice tracing approach and repeatability across duplicated datasets. We note that preliminary work on the segmentation and validation studies have been previously reported in conference form [15, 16].
The proposed methodologies are utilized to conduct an analysis on a collection on 21 patients from the Catheter Ablation versus Antiarrhythmic Drug Therapy for Atrial Fibrillation Trial (CABANA) pilot study who were scanned both before and approximately three months following ablation therapy. Consistent with previous studies [4, 5, 6, 7], we observed significant decreases in left atrial volume and all four pulmonary vein diameters following ablation therapy.
2. Methods
2.1. Segmentation and Analysis
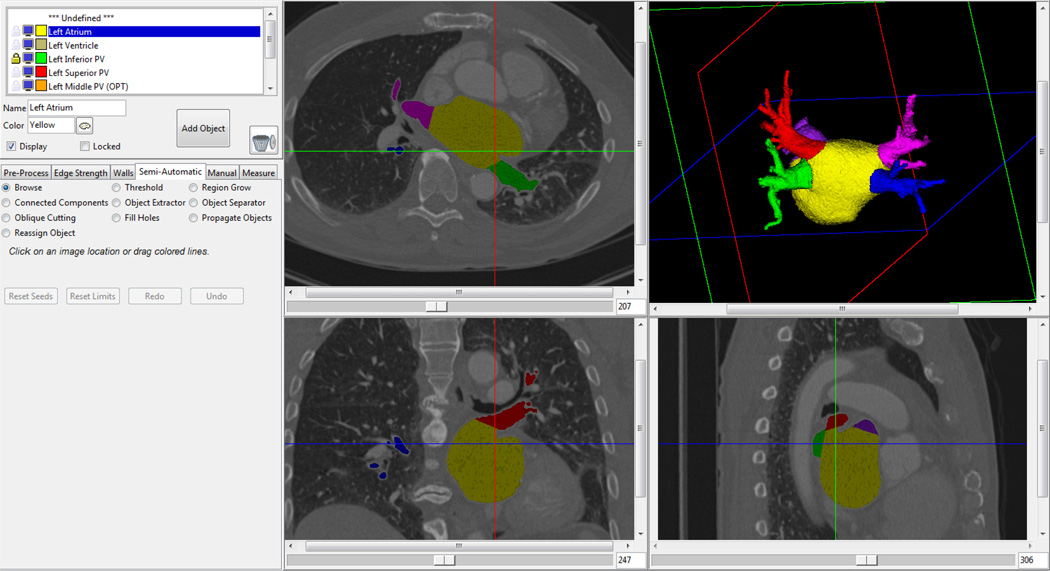
The segmentation methodology utilizes a semiautomatic approach in which an analyst interacts with a user interface developed specifically for this application, shown in Figure 2. On the left side of the user interface is a control panel which has several different tabs to select different components of the workflow. Pre-processing techniques, manual and semi-automatic segmentation tools, and measurement tools are available through these tabs. Visualizations of the current segmentation result are shown in both cross-sectional image slices and a three-dimensional volume rendering. Planes in the volume rendering indicate the location of the images slices. As modifications are made to the segmentation, results are instantaneously displayed in both the image cross-sections as well as the volume rendering.
Figure 2.
Screenshot of the 3D segmentation tool. Segmentation results are shown in both 2D cross-sectional images and a 3D volume rendering.
The segmentation workflow consists of a series of steps with minimal user interaction which operate on the 3D volumetric data. First, a median filter is run to reduce noise in the volume. Next, the mitral valve plane is defined using a semi-automatic approach. The user manually draws a line which separates the mitral valve from the left atrium on a subset of the images slices where the mitral valve is visible. The tool automatically interpolates between the manually drawn lines to create a plane which separates the mitral valve from the left atrium. This plane serves as a boundary in subsequent segmentation steps. Next, the user interactively selects a threshold and the left atrium, left atrial appendage, and pulmonary veins are segmented as a single structure using a region growing operation. This initial segmentation can contain extraneous surrounding anatomic structures which are removed using a geodesic SKIZ [17] algorithm that searches for thin connections between points defined by the user either in cross-sectional image slices or on the volume rendering. In short, two seed points are selected and morphologic erosion is applied until the two seeds are no longer connected and morphologic conditional dilation is used to re-grow the regions. If necessary, additional modifications can be made using manual tracing tools on either the 3D volume rendering or image slices.
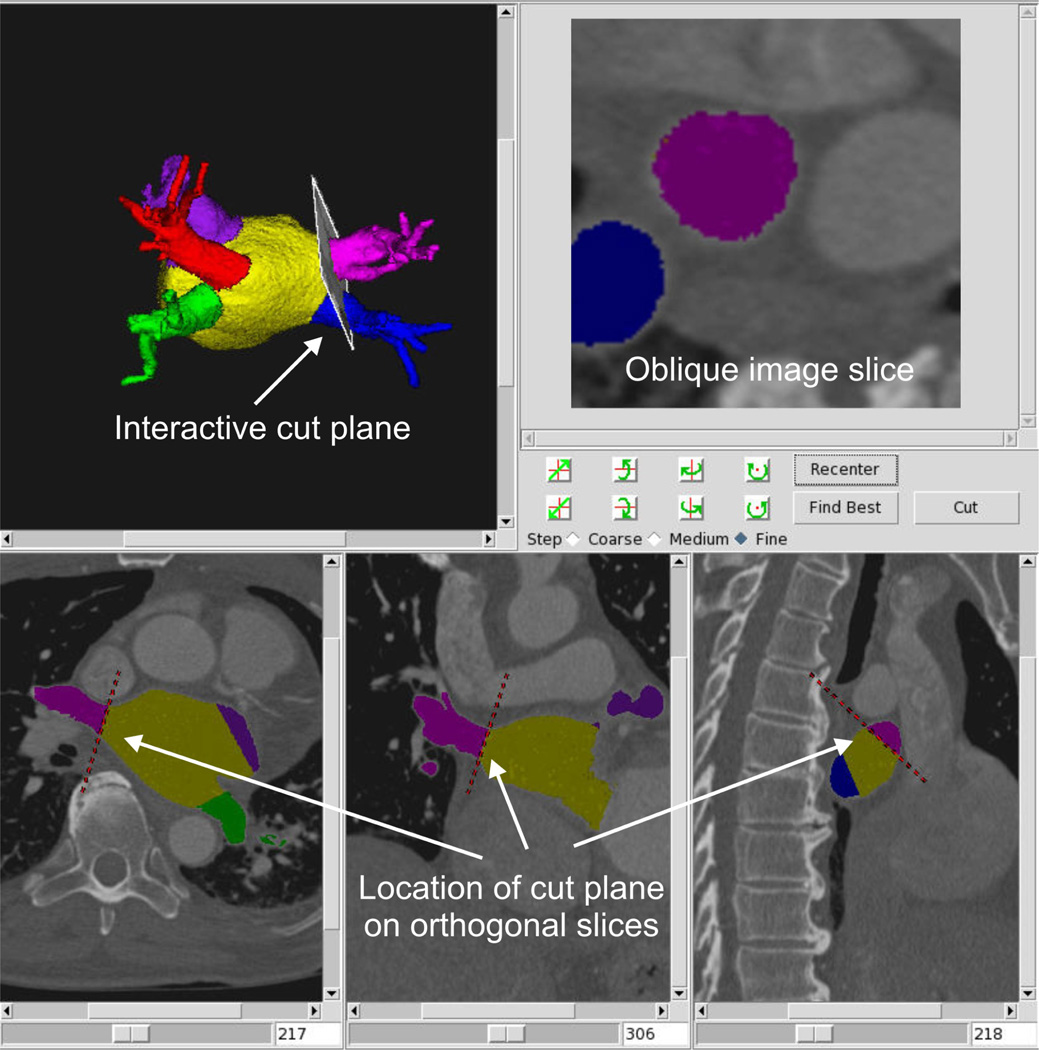
Next, the left atrial appendage and pulmonary veins are separated from the left atrium. The left atrial appendage is separated using a three-dimensional manual tracing tool to delineate the appendage boundary in the volume rendering view. The pulmonary veins are separated by interactively positioning a cut plane in a 3D visualization as shown in Figure 3. Orthogonal images along the bottom of the panel show the location of the cut in axial, sagital, and coronal views and the upper right image shows the oblique slice along the pulmonary vein. The user can interactively adjust the plane either by directly clicking on the plane with a mouse and rotating it in the volume rendering or using a set of three rotation buttons. The 3D visualization (top left) is used to position the plane to a position which is approximately orthogonal to the axis of the pulmonary vein. The location of the plane is also shown as a red dotted line in each standard orthogonal cross-sectional view along the bottom panel. The user can scroll through the cross-sectional images in each orientation to verify the placement of the cut throughout the image volume. In addition, the lines on the cross-sectional images can be dragged to change the location and orientation of the 3D cut plane. The oblique image (top right) is used as an additional visualization which illustrates the shape and size of the pulmonary vein ostium. This technique has the advantage that multiple visualizations can be utilized simultaneously in order to determine the most accurate location of the pulmonary vein ostium. Once the best position of the plane is determined, a cut is made at that location using a 3D region growing technique and the pulmonary vein is separated from the left atrium. A normal variation in pulmonary vein anatomy is to have a single common trunk for a pair of superior and inferior pulmonary veins [18]. In this case, a single cut plane is defined where the trunk enters the left atrium. The amount of time required for a complete segmentation including identification of the pulmonary vein cut planes ranges from 15 to 45 minutes depending on the quality of the data and patient anatomy.
Figure 3.
Separation of pulmonary vein from left atrium using a 3D cut plane. Plane is adjusted in 3D volume rendering view (top left) and location of cut is shown on orthogonal slices (bottom pane) and in oblique view (top right).
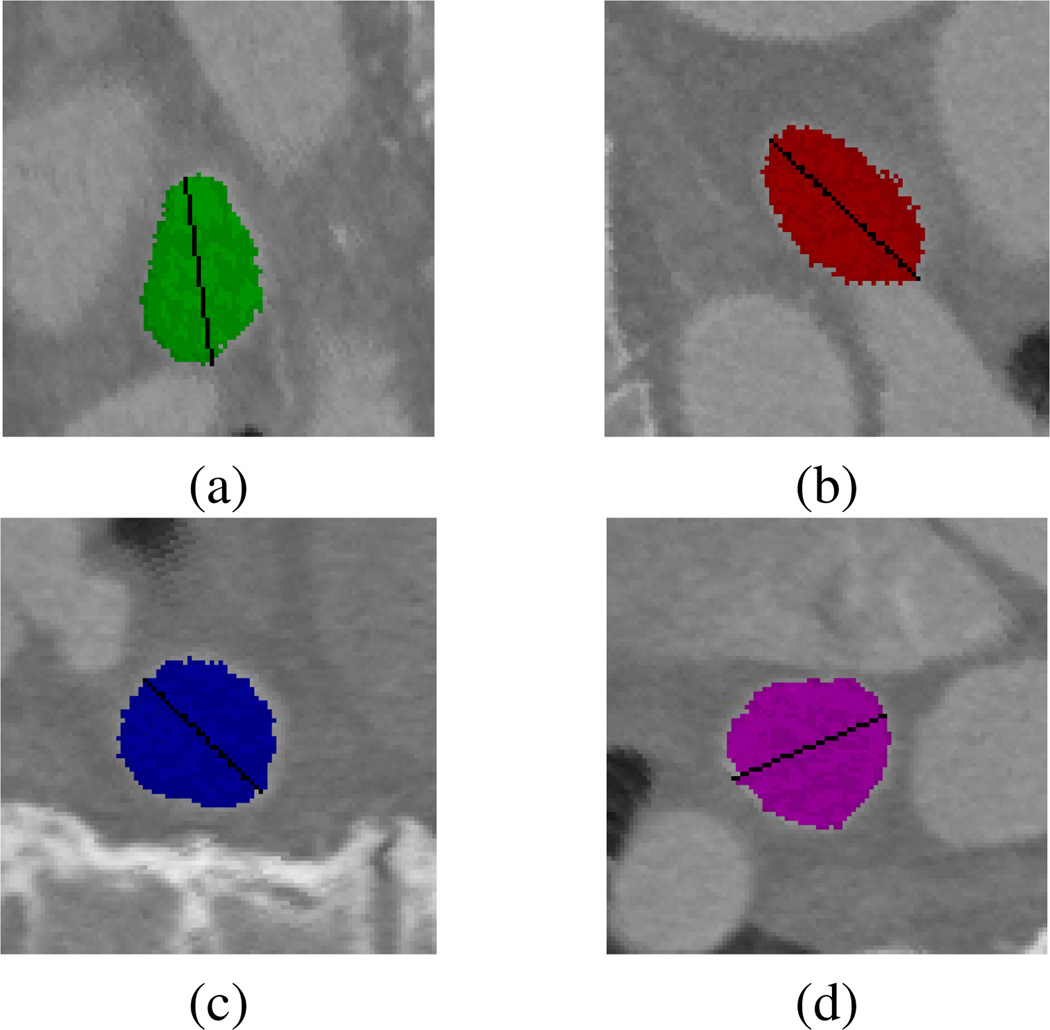
When the segmentation is complete, the user selects the measurement tab and the tool automatically computes left atrial volume by summing the voxels assigned to each structure and scaling by the voxel size. Pulmonary vein diameter measurements are made by first extracting the oblique image slices corresponding to the cut planes defined during the segmentation process. Next, the boundary of the pulmonary vein is extracted from the oblique image and the pulmonary vein diameter is computed as the longest line along the enclosed curve. The diameters computed for the four pulmonary veins from the dataset in Figure 3 are shown in Figure 4.
Figure 4.
Pulmonary vein diameter measurements for the (a) left inferior, (b) left superior, (c) right inferior, and (d) right superior pulmonary veins.
2.2. Description of Data
High-resolution, contrast enhanced computed tomographic datasets were obtained from the Catheter Ablation versus Antiarrhythmic Drug Therapy for Atrial Fibrillation Trial (CABANA) pilot imaging study repository. All imaging datasets were obtained from patients in the ablation arm of the study who were enrolled based on the following summary of the inclusion/exclusion criteria. Patients can be included in the trial if they are ≥65 years of age, or if they are <65 years of age with one or more of the following risk factors for stroke: hypertension, diabetes, congestive heart failure, prior stroke, transient ischemic attack or systemic emboli, atherosclerotic vascular disease, left atrial size >5.0 cm, or ejection fraction ≤35. Subjects <65 years of age whose only risk factor is hypertension must have a second risk factor or left ventricular hypertrophy to qualify. Patients are excluded from the trial if they have had recent cardiac events including myocardial infarction, percutaneous coronary intervention, or valve or bypass surgery in the preceding 3 months, hypertrophic obstructive cardiomyopathy, Class IV angina or Class IV congestive heart failure, or other arrhythmias mandating anti-arrhythmic drug therapy. Each participating site obtained approval from the local Institutional Review Board prior to data collection. A standard imaging protocol was provided to each site which requested prospective gating when possible based on condition of the patient (sinus rhythm) and available hardware. Parameter ranges for data reconstruction were as follows: slice thickness, 0.60 to 2.0 mm; in-plane resolution, 0.30 to 0.71 mm; and approximately 55% to 70% of the R-R interval.
2.3. Validation Studies
In the first validation study, accuracy of the left atrial volume measurements using the proposed volumetric segmentation technique were compared to a manual slice-by-slice tracing approach across 3 datasets. In the manual slice-by-slice approach, the boundary between the left atrium and each pulmonary vein was defined as the line that connects the points of maximal curvature on each side of the pulmonary vein. This rule was also applied to the boundary with the left atrial appendage. The mitral valve was not included as part of the left atrium. Absolute differences were computed between the 3D semi-automatic and 2D manual tracing approach. The pulmonary vein measurements were not evaluated in the accuracy study as there is currently no standard approach to utilize as the gold standard reference.
In the second validation study, inter- and intra-rater repeatability of the left atrial volume and pulmonary vein diameter measurements were evaluated across 2 raters and 6 datasets. First, the 6 high resolution CT datasets were duplicated and the order randomized so the analyst was blinded as to which datasets were the same. Next, each of the 12 datasets were semiautomatically segmented and left atrial volume and pulmonary vein diameters were computed. Absolute differences were computed between the 6 duplicated datasets for each rater to assess intra-rater repeatability. Absoulte differences between the two raters were computed across the 12 datasets to assess inter-rater repeatability.
2.4. Patient Study
Datasets were collected from 22 patients at sites participating in the CABANA pilot imaging study. Each patient was scanned at baseline and approximately 3 months following ablation therapy. In one patient, the baseline and follow-up scans were collected at different points in the cardiac cycle and this patient was therefore excluded from the study. Each of the 42 datasets was segmented independently with the analyst blinded to time point and over-read by an experienced radiologist (JFB). In the case of a common trunk in the pulmonary vein anatomy, the measurement of the full trunk was divided in half to obtain a measurement for each of the superior and inferior veins.
3. Results
3.1. Validation Studies
In the accuracy study, the mean absolute differences in left atrial volumes between the proposed semiautomatic approach and the manual slice-by-slice approach was 2.3±1.9 cm3. Results of the inter- and intra-repeatability study are given in Table 1. Inter-rater repeatability is similar between the two raters, with mean left atrial volume differences 4.7 and 4.4 cm3 for rater 1 and rater 2 respectively. Differences in pulmonary vein diameters ranged from 0.9 to 2.3 mm. As expected, absolute differences for the inter-rater repeatability were slightly higher; however, volumetric differences were still only 5.8 cm3 for left atrial volume and 1.4 to 2.3 mm for pulmonary vein diameters. These studies demonstrate that our methodology is both accurate as well as repeatable.
Table 1.
Results of repeatability study. Absolute differences of left atrial volume given in cm3 and absolute difference of pulmonary vein diameters given in mm.
| LA (cm3) | LIPV (mm) | LSPV (mm) | RIPV (mm) | RSPV (mm) | |
|---|---|---|---|---|---|
| Intra-Rater 1 (N=6) | 4.7±2.5 | 2.0±1.8 | 2.3±2.2 | 0.9±0.5 | 1.6±0.7 |
| Intra-Rater 2 (N=6) | 4.4±3.4 | 1.2±1.0 | 1.4±1.1 | 1.1±0.6 | 1.4±1.3 |
| Inter-Rater (N=12) | 5.8±5.1 | 2.0±1.6 | 2.3±2.4 | 1.4±0.9 | 1.8±1.9 |
LA=left atrium, LIPV=left inferior pulmonary vein, LSPV=left superior pulmonary vein, RIPV=right inferior pulmonary vein, RSPV=right superior pulmonary vein.
3.2. Patient Study
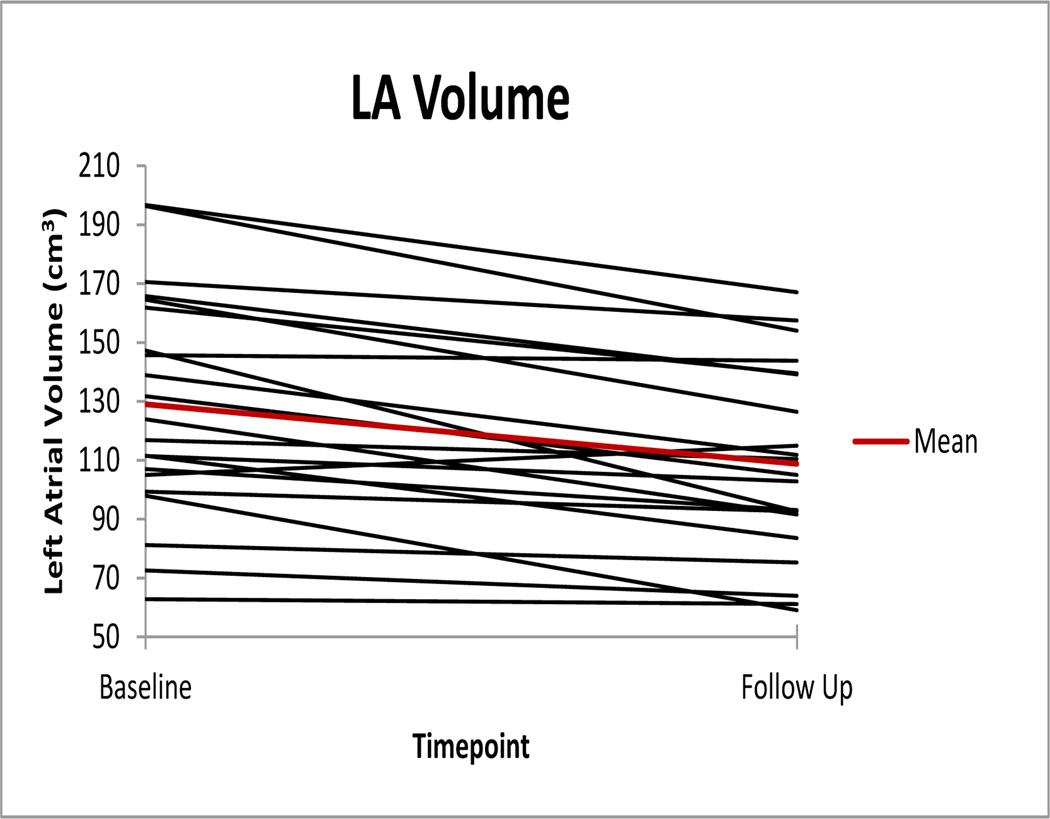
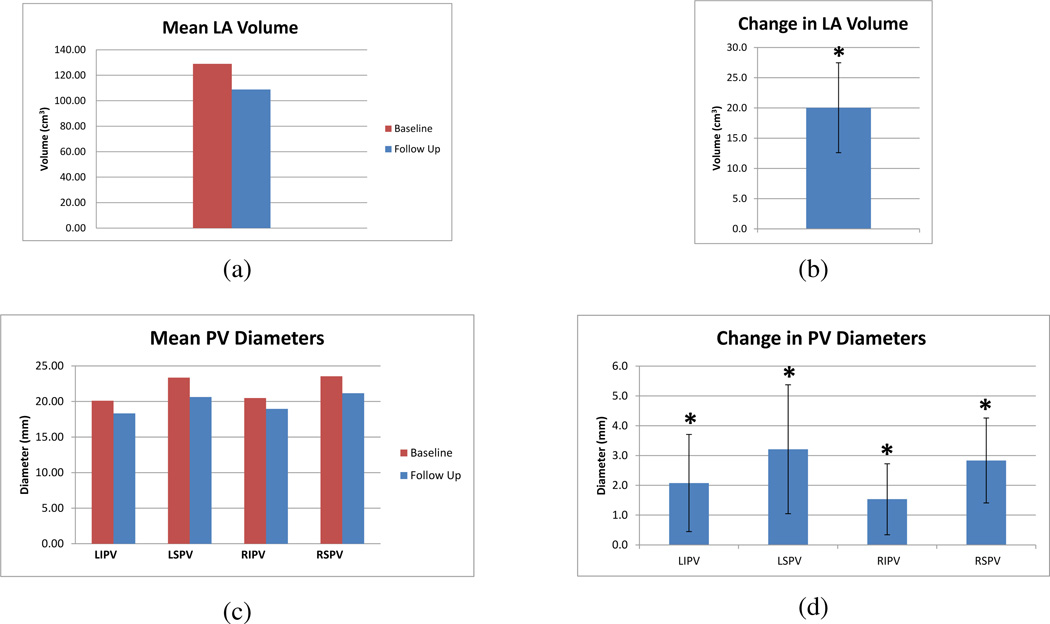
Left atrial volumes at baseline and follow-up across all subjects are shown in Figure 5. The mean left atrial volume measured at baseline and three month follow up is given in Figure 6(a) with the mean change in left atrial volume given in Figure 6(b). Across the 21 patients, the mean decrease in LA volume was 20.0 cm3, 95% CI [12.6, 27.5]. The mean pulmonary vein diameters measured at baseline and three month follow up are given in Figure 6(c) with the mean change pulmonary vein diameters given in Figure 6(d). The mean decrease in left inferior pulmonary vein diameter was 2.1 mm, 95% CI [0.4, 3.7], the mean decrease in left superior pulmonary vein diameter was 3.2 mm, 95% CI [1.0, 5.4], the mean decrease in right inferior pulmonary vein diameter was 1.5 mm, 95% CI [0.3, 2.7], and the mean decrease in right superior pulmonary vein diameter was 2.8 mm, 95% CI [1.4, 4.3]. Using a paired t-test, significant decreases (p < .05) were found in left atrial volume and all four pulmonary vein diameters.
Figure 5.
Left atrial volumes at baseline and follow-up across 21 patients.
Figure 6.
(a) Mean left atrial volume measured at baseline and three month follow-up. (b) Mean change in left atrial volume following ablation therapy with 95% confidence intervals. The * indicates statistical significance for p < .05. (c) Mean pulmonary vein diameters measured at baseline and three month follow-up. (d) Mean change in pulmonary vein diameters following ablation therapy with 95% confidence intervals. The * indicates statistical significance for p < .05.
4. Discussion and Conclusions
In this work, we describe a semi-automated technique for measuring left atrial volume and pulmonary vein diameters. The method was demonstrated to be accurate as compared to manually traced gold standard data and repeatable across a set of randomized and repeated datasets. Results were demonstrated on a series of patients undergoing cardiac ablation therapy. Using the proposed method, it was demonstrated that left atrial volumes and all four pulmonary vein diameters decreased following ablation treatment which is consistent with prior studies [3, 4, 5, 6, 7].
While the application demonstrated in the current work is the analysis of reverse structural remodeling following ablation therapy, accurate left atrial volume and pulmonary vein diameter measurements are important in the context of many applications. Prior morphological studies have evaluated normal shape and size of pulmonary vein diameters [12] as well as compared the morphology of different patient cohorts. For example, it was demonstrated that ostial and left atrial diameters were significantly higher in patients with chronic AF as compared to patients with paroxysmal AF [14]. Another study [19] found that patients with paroxysmal or chronic AF had larger superior pulmonary veins that normal controls. Other studies [1, 2], have demonstrated enlarged left atrial and pulmonary vein dimensions in patients with AF as compared to normal controls. Geometric measurements of the left atrium are also used to assess risk factors and predict recurrence. Several studies [8, 20, 21, 22, 23] have demonstrated that left atrial size is a risk factor for recurrence following cardiac ablation therapy. A recent study [24], found that patients with left atrial volumes greater than 95 mL have an increased likelihood to develop persistent AF if the ablation fails. The role of pulmonary vein diameter for outcome prediction; however, is less clear, with one study [25] finding a trend for reduced efficacy in patients with pulmonary vein diameters greater than 25 mm and another study [23], finding no relationship between pulmonary vein diameter and recurrence. These measurements are also important for treatment planning, with one study [26], using pulmonary vein ostial circumferences to determine the minimal diameter for balloon ablation catheters.
Prior work in measuring left atrial volume has required laborious slice-by-slice manual tracing [4, 8] or volumetric estimation using line measurements from orthogonal images slices [5, 6, 9]. Volume estimation from orthogonal line measurements has been shown to strongly correlate with left atrial volume; however, it underestimates true volume by approximately 20% [9]. Left atrial volume can also be measured from echocardiographic data; however, it has been demonstrated that echocardiography underestimates left atrial volume as compared to CT measurements [27]. Another study [28], found a relatively low correlation between echocardiographic left atrial diameters and true left atrial volume from multi-detector CT data. Futhermore, the authors found that left atrial volume measured from CT was correlated with treatement success as opposed to the echocardiographic measurements which did not demonstrate this correlation, thereby leading to the conclusion that measurements from pre-procedural CT data were a better predictor for AF recurrence. Recent advances in analysis of left atrial volume from three-dimensional echocardiography [29]; however, may provide measurements more consistent with those from volumetric CT data.
Prior techniques for measuring pulmonary vein diameters have primarily utilized manual lines drawn in either image cross-sections [10] or volume renderings [3, 4, 14]. In the study of Cronin et. al, inter-rater repeatability errors for measuring pulmonary vein diameters ranged from 1.8 to 2.1 mm across the four main pulmonary veins which is similar in magnitude to our semi-automatic approach. Another approach is to draw a line along the length of the pulmonary vein in one of the orthogonal images and then extract the oblique to that line [2, 6, 11, 12, 13] and make a manual measurement in this off-axis slice. As noted in previous work [30], reliable measurements of the pulmonary vein ostia are challenging since the anatomic border between the left atrium and pulmonary veins is not clearly defined. In addition, the ostia have an ovoid shape resulting in significantly different measurements depending on the orienation of the plane in which the measurement is made [30]. An important component of the methodology described in the current work is that the pulmonary veins are separated from the body of the left atrium using a cut plane which is visualized simultaneously as a 3D plane in a volume view as well as lines in the three orthogonal image views. The oblique image which represents the ostial plane is also shown for additional context. The combination of these visual cues allows the user to accurately position the plane based on both 3D and 2D anatomical information and the the final diameter measurement is automatically computed on the oblique image which best approximates the pulmonary vein ostium.
In conclusion, we propose and validate a semiautomatic methodology for making accurate and repeatable measurements of left atrial volume and pulmonary vein diameters. The methodology was used to evaluate reverse structural remodeling following cardiac ablation therapy; however, the proposed methodology has important application in other areas such as anatomical characterization, treatment planning, and outcome prediction. In future work, we will utilize the described techniques to evaluate a larger cohort of patients, with the overall goal of determining imaging metrics which can quantify treatment effects and guide treatment plans in the clinic.
Acknowledgements
This research was supported by NIH grants HL089709 and HL089645 from the National Heart Lung and Blood Institute, NIH grant EB002834 from the National Institute of Biomedical Imaging and Bio-engineering, Biosense-Webster, and St. Judes’s Foundation.
Appendix
CABANA Pilot Imaging Investigators
Steven Bailin, Mercy Medical Center, Des Moines, IA. Anil Bhandari, Good Samaritan Hospital, Los Angeles, CA. John Day, Intermountain Medical Center, Salt Lake City, UT. John Hummel, Ohio State University, Columbus, OH. Neil Kay, University of Alabama at Birmingham, Birmingham, AL. Douglas Packer, Mayo Clinic, Rochester, MN. David Wilber, Loyola University Medical Center, Maywood, IL.
Footnotes
Publisher's Disclaimer: This is a PDF file of an unedited manuscript that has been accepted for publication. As a service to our customers we are providing this early version of the manuscript. The manuscript will undergo copyediting, typesetting, and review of the resulting proof before it is published in its final citable form. Please note that during the production process errors may be discovered which could affect the content, and all legal disclaimers that apply to the journal pertain.
Conflict of Interest Statement
R.A. Robb, D.L. Packer, and Mayo Clinic have a financial interest in technology used in this research and have received royalties greater than the federal threshold for significant financial interest in the preceding 12 months from licensing this technology.
References
- 1.Tsao H, Yu W, Cheng H, Wu M, Tai C, Lin W, Ding Y, Chang M, Chen S. Pulmonary vein dilation in patients with atrial fibrillation. J Cardiovasc Electrophysiol. 2001;12(7):809–813. doi: 10.1046/j.1540-8167.2001.00809.x. [DOI] [PubMed] [Google Scholar]
- 2.Kato R, Lickfett L, Meininger G, Dickfeld T, Wu R, Juang G, Angkeow P, LaCorte J, Bluemke D, Berger R, Halperin H, Calkins H. Pulmonary vein anatomy in patients undergoing catheter ablation of atrial fibrillation. Circulation. 2003;107:2004–2010. doi: 10.1161/01.CIR.0000061951.81767.4E. [DOI] [PubMed] [Google Scholar]
- 3.Scharf C, Sneider M, Case I, Chugh A, Lai S, Pelosi F, Jr, Knight B, Kazerooni E, Morady F, Oral H. Anatomy of the pulmonary veins in patients with atrial fibrillation and effects of segmental ostial ablation analyzed by computed tomography. J Cardiovasc Electrophysiol. 2003;14:150–155. doi: 10.1046/j.1540-8167.2003.02444.x. [DOI] [PubMed] [Google Scholar]
- 4.Lemola K, Sneider M, Desjardins B, Case I, Chugh A, Hall B, Cheung P, Good E, Han J, Tamirisa K, Bogun F, Pelosi F, Jr, Kazerooni E, Morady F, Oral H. Effects of left atrial ablation of atrial fibrillation on size of the left atrium and pulmonary veins. Heart Rhythm. 2004;1(5):576–581. doi: 10.1016/j.hrthm.2004.07.020. [DOI] [PubMed] [Google Scholar]
- 5.Tsao H, Wu M, Huang B, Lee S, Lee K, Tai C, Lin Y, Hsieh M, Kuo J, Lei M, Chen S. Morphologic remodeling of pulmonary veins and left atrium after catheter ablation of atrial fibrillation. J. Cardiovasc Electrophysiol. 2005;16:7–12. doi: 10.1046/j.1540-8167.2005.04407.x. [DOI] [PubMed] [Google Scholar]
- 6.Jayam V, Dong J, Vasamreddy C, Lickfett L, Kato R, Dickfeld T, Eldadah Z, Dalal D, Blumke D, Berger R, Halperin H, Calkins H. Atrial volume reduction following catheter ablation of atrial fibrillation and relation to reduction in pulmonary vein size: An evaluation using magentic resonance angiography. J Interv Card Electrophysiol. 2005;13:107–114. doi: 10.1007/s10840-005-0215-3. [DOI] [PubMed] [Google Scholar]
- 7.Jeevanantham V, Ntim W, Navaneethan S, Shah S, Johnson A, Hall B, Shah A, Hundley W, Daubert J, Fitzgerald D, Meta-analysis of the effect of radiofrequency catheter ablation on left atrial size. volumes and function in patients with atrial fibrillation. Am J Cardiol. 2010;105:1317–1326. doi: 10.1016/j.amjcard.2009.12.046. [DOI] [PubMed] [Google Scholar]
- 8.Akutsu Y, Kaneko K, Kodama Y, Suyama J, Li H-L, Hamazaki Y, Tanno K, Gokan T, Kobayashi Y. Association between left and right atrial remodeling with atrial fibrillation recurrence after pulmonary vein catheter ablation in patients with paroxysmal atrial fibrillation: A pilot study. Circ Cardiovasc Imaging. 2011;4:524–531. doi: 10.1161/CIRCIMAGING.110.962761. [DOI] [PubMed] [Google Scholar]
- 9.Hof I, Arbab-Zadeh A, Dong J, Scherr D, Chilukuri K, Calkins H. Validation of a simplified method to determine left atrial volume by computed tomography in patients with atrial fibrillation. Am J Cardiol. 2008;102:1567–1570. doi: 10.1016/j.amjcard.2008.07.048. [DOI] [PubMed] [Google Scholar]
- 10.Cronin P, Kelly A, Gross B, Desjardins B, Patel S, Kazerooni E, Carlos R. Reliability of MDCT in characterizing pulmonary venous drainage, diameter and distance to first bifurcation: An interobserver study. Acad Radiol. 2007;14:437–444. doi: 10.1016/j.acra.2007.01.023. [DOI] [PubMed] [Google Scholar]
- 11.Yuan X, Bach D, Skanes A, Drangova M. Assessment of intra- and interobserver variability of pulmonary vein measurements from CT angiography. Acad Radiol. 2004;11:1211–1218. doi: 10.1016/j.acra.2004.07.016. [DOI] [PubMed] [Google Scholar]
- 12.Kim Y-H, Marom E, Herndon II J, McAdams HP. Pulmonary vein diameter, cross-sectional area, and shape: CT analysis. Radiology. 2005;235:43–50. doi: 10.1148/radiol.2351032106. [DOI] [PubMed] [Google Scholar]
- 13.Niinuma H, George R, Arbab-Zadeh A, Lima J, Henrikson C. Imaging of pulmonary veins during catheter ablation for atrial fibrillation: the role of mult-slice computed tomography. Europace. 2008;10 doi: 10.1093/europace/eun230. [DOI] [PubMed] [Google Scholar]
- 14.Kaseno K, Tada H, Koyama K, Jingu M, Hiramatsu S, Yokoawa M, Goto K, Naito S, Oshima S, Taniguchi K. Prevalance and characterization of pulmonary vein variants in patients with atrial fibrillation determined using 3-dimensional computed tomography. Am J Cardiol. 2008;101:1638–1642. doi: 10.1016/j.amjcard.2008.01.053. [DOI] [PubMed] [Google Scholar]
- 15.Rettmann M, Holmes III D, Camp J, Packer D, Robb R. Validation of semi-automatic segmentation of the left atrium. Proc. SPIE 6916, Medical Imaging 2008: Physiology, Function, and Structure from Medical Images [Google Scholar]
- 16.Rettmann M, Holmes III D, Gunawan M, Ge X, Karwoski R, Breen J, Packer D, Robb R. Validation of geometric measurements of the left atrium and pulmonary veins for analysis of reverse structural remodeling following ablation therapy. Proc. SPIE 8317, Medical Imaging 2012: Biomedical Applications in Molecular, Structural, and Functional Imaging [Google Scholar]
- 17.Beutel J, Sonka M. Handbook of Medical Imaging: Medical image processing and analysis, SPIE Press. 2000 [Google Scholar]
- 18.Marom E, Herndon J, Kim Y, McAdams H. Variations in pulmonary venous drainage to the left atrium: Implications for radiofrequency ablation. Radiology. 2004;230:824–828. doi: 10.1148/radiol.2303030315. [DOI] [PubMed] [Google Scholar]
- 19.Takase B, Nagata M, Matsui T, Kihara T, Kameyama A, Hamabe A, Noy K, Satomura K, Ishihara M, Kurita A, Ohsuzu F. Pulmonary vein dimensions and variation of branching pattern in patients with paroxysmal atrial fibrillation using magnetic resonance angiography. Jpn Heart J. 2004;45:81–92. doi: 10.1536/jhj.45.81. [DOI] [PubMed] [Google Scholar]
- 20.Berruezo A, Tamborero D, Mont L, Benito B, Tolosana J, Sitges M, Vidal B, Arriagada G, Mendez F, Matiello M, Monlina I, Brugada J. Pre-procedural predictors of atrial fibrillation recurrence after circumferential pulmonary vein ablation. Eur Heart J. 2007;28:836–841. doi: 10.1093/eurheartj/ehm027. [DOI] [PubMed] [Google Scholar]
- 21.Abecasis J, Dourado R, Ferreira A, Saraiva C, Cavaco D, Santos K, Morgado F, Adragao P, Silva A. Left atrial volume calculated by multi-detector computed tomography may predict successful pulmonary vein isolation in catheter ablation of atrial fibrillation. Europace. 2009;11:1289–1294. doi: 10.1093/europace/eup198. [DOI] [PubMed] [Google Scholar]
- 22.Hof I, Chilukuri K, Arbab-Zadeh A, Scherr D, Dalal D, Nazarian S, Henrikson C, Spragg D, Berger R, Marine J, Calkins H. Does left atrial volume and pulmonary venous anatomy predict the outcome of catheter ablation of atrial fibrillation? J Cardiovasc Electrophysiol. 2009;20:1005–1010. doi: 10.1111/j.1540-8167.2009.01504.x. [DOI] [PubMed] [Google Scholar]
- 23.denUijl D, Tops L, Delgado V, Schuijf J, Kroft L, de Roos A, Boersma E, Trines S, Zeppenfeld K, Schalij M, Bax J. Effect of pulmonary vein anatomy and left atrial dimensions on outcome of circumferential radiofrequency catheter ablation for atrial fibrillation. Am J Cardiol. 2011;107:243–249. doi: 10.1016/j.amjcard.2010.08.069. [DOI] [PubMed] [Google Scholar]
- 24.vonBary C, Dornia C, Eissnert C, Nedios S, Roser M, Hamer O, Gerts-Li J-H, Paetsch I, Jahnke C, Gebker R, Weber S, Fleck E, Kriatselis C. Predictive value of left atrial volume measured by non-invasive cardiac imagingg in the treatment of paroxysmal atrial fibrillation. J Interv Card Electrophysiol. 2012;34:181–188. doi: 10.1007/s10840-011-9641-6. [DOI] [PubMed] [Google Scholar]
- 25.Mulder A, Wijffels M, Wever E, Boersma L. Pulmonary vein anatomy and long-term outcome after multi-electrode pulmonary vein isolation with phased radiofrequency energy for paroxysmal atrial fibrillation. Europace. 2011;13(11):1557–1561. doi: 10.1093/europace/eur236. [DOI] [PubMed] [Google Scholar]
- 26.Ahmed J, Sohal S, Malchano Z, Holmvang G, Ruskin J, Reddy V. Three-dimensional analysis of pulmonary venous ostial and antral anatomy: Implications for balloon catheter-based pulmonary vein isolation. J Cardiovasc Electrophysiol. 2006;17:251–255. doi: 10.1111/j.1540-8167.2005.00339.x. [DOI] [PubMed] [Google Scholar]
- 27.Al-Mohaissen M, Kazmi M, Chan K, Chow B. Validation of two-dimensional methods for left atrial volume measurement: A comparison of echocardiography with cardiac computed tomography. Echocardiography. 2013;30(10):1135–42. doi: 10.1111/echo.12253. [DOI] [PubMed] [Google Scholar]
- 28.Sohns C, Sohns J, Vollmann D, Luethje L, Bergau L, Dorenkamp M, Zwaka P, Hasenfuss G, Lotz J, Zabel M. Left atrial volumetry from routine diagnostic work up prior to pulmonary vein ablation is a good predictor of freedom from atrial fibrillation. European Heart Journal - Cardiovascular Imaging. 2013;14:684–691. doi: 10.1093/ehjci/jet017. [DOI] [PubMed] [Google Scholar]
- 29.Zhong L, Kheng Tan L, Finn C, Ghista D, Liew R, Pin Ding Z. Effects of age and gender on left atrial ejection force and volume from real-time three-dimensional echocardiography. Ann Acad Med Singapore. 2012;41:161–9. [PubMed] [Google Scholar]
- 30.Hauser T, Peters D, Wylie J, Manning W. Evaluating the left atrium by magnetic resonance imaging. Europace. 2008;10:ii22–iii27. doi: 10.1093/europace/eun223. [DOI] [PMC free article] [PubMed] [Google Scholar]


